SNT/ETH Daily Technical AnalysisSNT/ETH Daily Technical Analysis
Idicators are POSSITIVE
Resistance point: 0,00003273 - 3600
Support point: 0,00002880 - 2767

SNT / ETH Short Term TASNT/ETH retesting the flag bottom line as resistance. If rejected:
Full Target may be 0.00007000rish (In ETH) But this Token is very bullish... maybe wont hit the target
Not a financial advise. Just my humble opinion!!!

SNTETH Descending ScallopBullish Descending Scallop, Breakout has already occurred just an observation, may push higher.

There is a trading opportunity to buy in SNTETHTechnical analysis:
. StatusNetworkToken/Etereum is in a range bound and the beginning of uptrend is expected.
. The price is below the 21-Day WEMA which acts as a dynamic resistance.
. The RSI is at 46.
Trading suggestion:
. There is a possibility of temporary retracement to suggested supp

SNT/ETHExpecting a range between the blue if this candle doesn't push above, followed by a push up to the red, rejection, with a build up using blue as support. Will post appropriate update's.

There is a trading opportunity to buy in SNTETHTechnical analysis:
. StatusNetworkToken/Ethereum is in a range bound and the beginning of uptrend is expected.
. The price is below the 21-Day WEMA which acts as a dynamic resistance.
. The RSI is at 41.
. While the RSI downtrend is not broken, bearish wave in price would continue.
Tradin

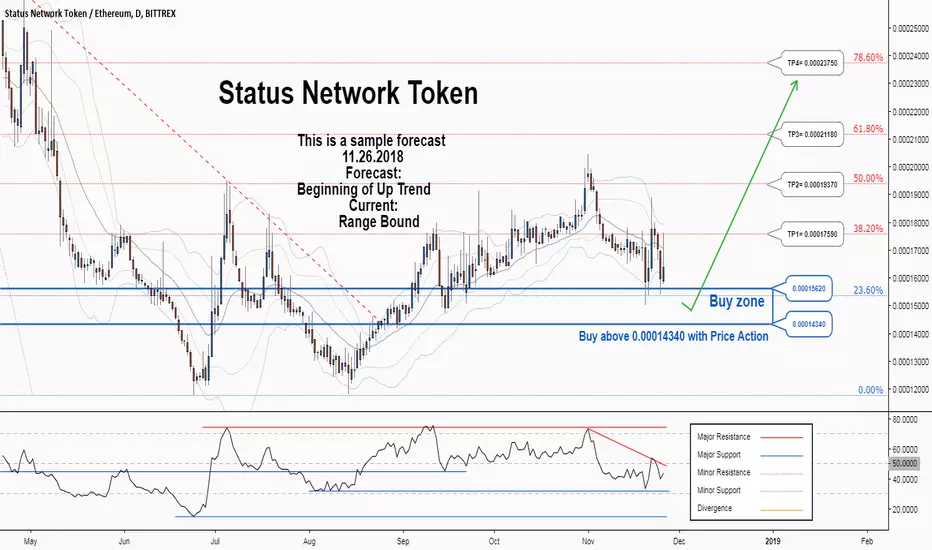
There is a possibility for the beginning of an uptrend in SNTETHTechnical analysis:
. StatusNetworkToken/Ethereum is in a range bound and the beginning of uptrend is expected.
. The price is below the 21-Day WEMA which acts as a dynamic resistance.
. The RSI is at 40.
Trading suggestion:
. There is a possibility of temporary retracement to suggested sup
There is a possibility for the beginning of an uptrend in SNTETHTechnical analysis:
. StatusNetworkToken/Ethereum is in a range bound and the beginning of uptrend is expected.
. The price is above the 21-Day WEMA which acts as a dynamic support.
. The RSI is at 54.
. The price downtrend in the daily chart is broken, so the probability of the resumption of a

See all ideas