SNT/ETH Daily Technical AnalysisSNT/ETH Daily Technical Analysis
Idicators are POSSITIVE
Resistance point: 0,00003273 - 3600
Support point: 0,00002880 - 2767
SNTETH trade ideas

SNT / ETH Short Term TASNT/ETH retesting the flag bottom line as resistance. If rejected:
Full Target may be 0.00007000rish (In ETH) But this Token is very bullish... maybe wont hit the target
Not a financial advise. Just my humble opinion!!!

SNTETH Descending ScallopBullish Descending Scallop, Breakout has already occurred just an observation, may push higher.

There is a trading opportunity to buy in SNTETHTechnical analysis:
. StatusNetworkToken/Etereum is in a range bound and the beginning of uptrend is expected.
. The price is below the 21-Day WEMA which acts as a dynamic resistance.
. The RSI is at 46.
Trading suggestion:
. There is a possibility of temporary retracement to suggested support zone (0.00015800 to 0.00014600). if so, traders can set orders based on Price Action and expect to reach short-term targets.
Beginning of entry zone (0.00015800)
Ending of entry zone (0.00014600)
Entry signal:
Signal to enter the market occurs when the price comes to " Buy zone " then forms one of the reversal patterns, whether " Bullish Engulfing ", " Hammer " or " Valley " in other words,
NO entry signal when the price comes to the zone BUT after any of the reversal patterns is formed in the zone.
To learn more about " Entry signal " and the special version of our " Price Action " strategy FOLLOW our lessons:
Take Profits:
TP1= @ 0.00017000
TP2= @ 0.00018000
TP3= @ 0.00018880
TP4= @ 0.00021240
TP5= @ 0.00026910
TP6= @ 0.00031160
TP7= Free

SNT/ETHExpecting a range between the blue if this candle doesn't push above, followed by a push up to the red, rejection, with a build up using blue as support. Will post appropriate update's.

There is a trading opportunity to buy in SNTETHTechnical analysis:
. StatusNetworkToken/Ethereum is in a range bound and the beginning of uptrend is expected.
. The price is below the 21-Day WEMA which acts as a dynamic resistance.
. The RSI is at 41.
. While the RSI downtrend is not broken, bearish wave in price would continue.
Trading suggestion:
. There is a possibility of temporary retracement to suggested support zone (0.00015600 to 0.00014600). if so, traders can set orders based on Price Action and expect to reach short-term targets.
Beginning of entry zone (0.00015600)
Ending of entry zone (0.00014600)
Entry signal:
Signal to enter the market occurs when the price comes to " Buy zone " then forms one of the reversal patterns, whether " Bullish Engulfing ", " Hammer " or " Valley " in other words,
NO entry signal when the price comes to the zone BUT after any of the reversal patterns is formed in the zone.
To learn more about " Entry signal " and the special version of our " Price Action " strategy FOLLOW our lessons:
Take Profits:
TP1= @ 0.00017590
TP2= @ 0.00019370
TP3= @ 0.00021180
TP4= @ 0.00023750
TP5= @ 0.00027000
TP6= @ 0.00029110
TP7= Free

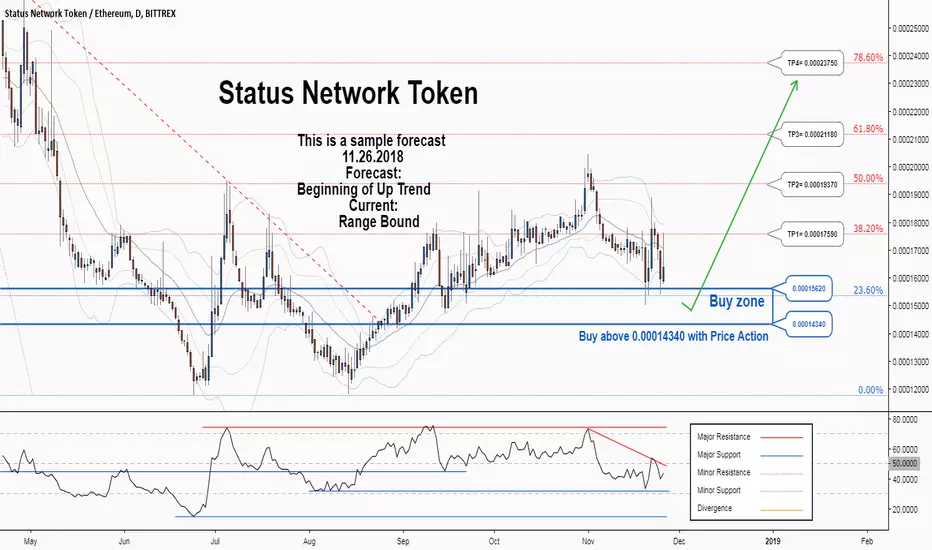
There is a possibility for the beginning of an uptrend in SNTETHTechnical analysis:
. StatusNetworkToken/Ethereum is in a range bound and the beginning of uptrend is expected.
. The price is below the 21-Day WEMA which acts as a dynamic resistance.
. The RSI is at 40.
Trading suggestion:
. There is a possibility of temporary retracement to suggested support zone (0.00015620 to 0.00014340). if so, traders can set orders based on Price Action and expect to reach short-term targets.
Beginning of entry zone (0.00015620)
Ending of entry zone (0.00014340)
Entry signal:
Signal to enter the market occurs when the price comes to "Buy zone" then forms one of the reversal patterns, whether "Bullish Engulfing", "Hammer" or "Valley" in other words,
NO entry signal when the price comes to the zone BUT after any of the reversal patterns is formed in the zone.
To learn more about "Entry signal" and the special version of our "Price Action" strategy FOLLOW our lessons:
Take Profits:
TP1= @ 0.00017590
TP2= @ 0.00019370
TP3= @ 0.00021180
TP4= @ 0.00023750
TP5= @ 0.00027000
TP6= @ 0.00029110
TP7= Free
There is a possibility for the beginning of an uptrend in SNTETHTechnical analysis:
. StatusNetworkToken/Ethereum is in a range bound and the beginning of uptrend is expected.
. The price is above the 21-Day WEMA which acts as a dynamic support.
. The RSI is at 54.
. The price downtrend in the daily chart is broken, so the probability of the resumption of an uptrend is increased.
Trading suggestion:
. There is a possibility of temporary retracement to suggested support zone (0.00015620 to 0.00014340). if so, traders can set orders based on Price Action and expect to reach short-term targets.
Beginning of entry zone (0.00015620)
Ending of entry zone (0.00014340)
Entry signal:
Signal to enter the market occurs when the price comes to "Buy zone" then forms one of the reversal patterns, whether "Bullish Engulfing" , "Hammer" or "Valley" in other words,
NO entry signal when the price comes to the zone BUT after any of the reversal patterns is formed in the zone.
To learn more about "Entry signal" and the special version of our "Price Action" strategy FOLLOW our lessons:
Take Profits:
TP1= @ 0.00017590
TP2= @ 0.00019370
TP3= @ 0.00021180
TP4= @ 0.00023750
TP5= @ 0.00027000
TP6= @ 0.00029110
TP7= Free


Stop Watching BTC for a few days dont miss out on free alt moneyExpect BTC sideways trade alts!
Between cyan lines = entry
green dotted lines = take profit
Below second cyan line = cut loss
Any questions? Ask

SNT 100% edge to edge coming up?Looks like price will hug the bottom edge of the cloud and fly though in a few day edge to edge.
That would be 100% move


SNT/ETH- About to SPikeBINANCE:SNTETH has a strong inverse head and shoulders...
Just wanted to let you know...
Cheers-


SNT - new up trend forming?A prolonged descent seems to have turned with count back buy signals printing yesterday and confirmed today.
Use todays low as stop loss level. (Red line)
I'm looking forward to the status app launch and accessing all those ethereum based DAPPS. Exciting times ahead!


