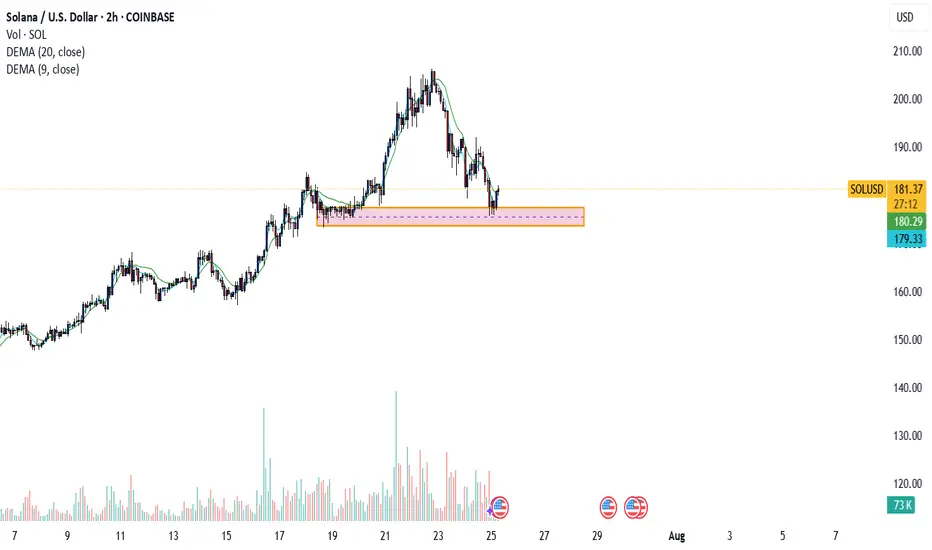
SOL: Clean Fakeout & Two Bearish Scenarios AheadHello guys!
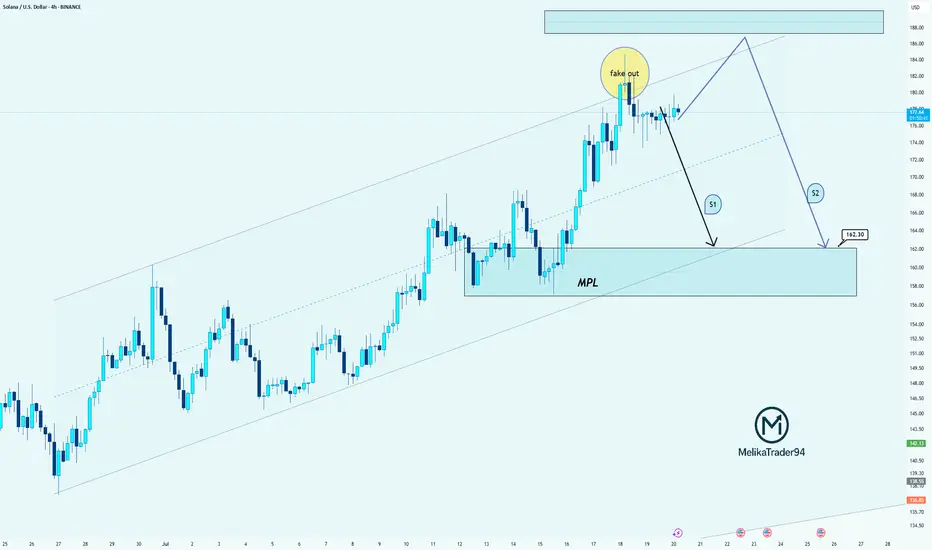
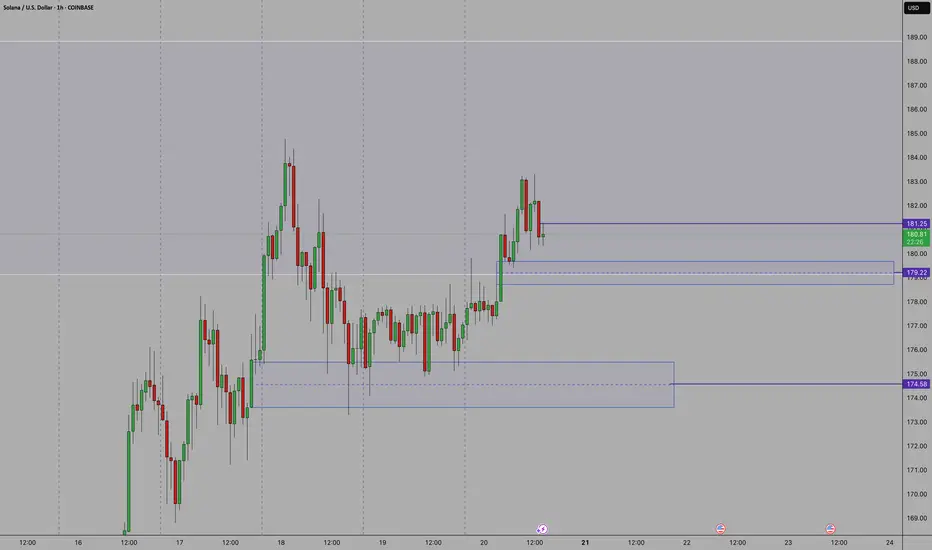
Price just created a textbook fakeout above the resistance zone, grabbing liquidity and quickly dropping back into the range!
Here’s what the chart is showing:
Price is still inside the ascending channel, but the breakout attempt failed
The MPL (maximum pain level) around $162.30 is the key downside target
Two possible paths:
S1: Direct drop from here toward the MPL
S2: Another move up to retest the highs or form a lower high before the deeper drop
I think the S2 is more probable!
SOLUSD trade ideas
Solana Approaching Key Resistance: watch for $219Hello guys!
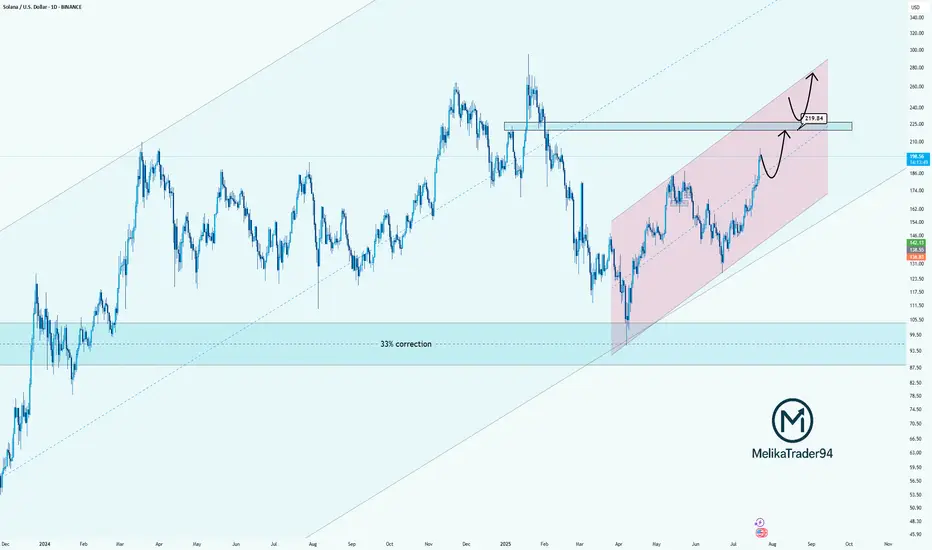
Solana has been trending strongly inside a rising parallel channel, recovering steadily after a significant 33% correction. The bullish momentum is clear, and the price is now approaching a key resistance zone near $219.84, which previously acted as a major turning point.
Here’s what I’m watching:
Strong uptrend within the pink channel shows controlled and healthy growth.
$219.84 is a critical decision zone. Price could:
React with a pullback before pushing higher,
Or break through it and flip the level into support for the next bullish leg.
The reaction in this zone will determine the next structure.
Whether we see a temporary correction or continuation to new highs.
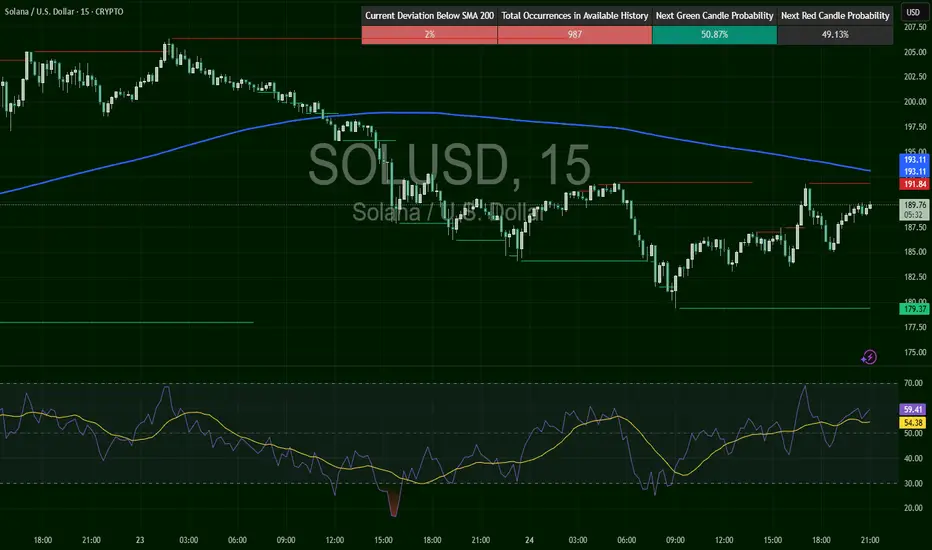
SOLUSD – Recovery Faces Wall at $193SOL broke below $198, hitting a low near $179, confirming the short trigger from the last setup. Since then, it’s building a grind-recovery, reclaiming $189 but stalling at a confluence zone ($191.84 resistance and SMA200 near $193.11). RSI at 59.41 still favors buyers — but SOL needs a clean break above $193+ to shift back into bullish territory.
Bounce with meLooking to spring off the areas below
We are at a Major Top and playing in Supply. I don't recommend betting big here but I'll be looking to add positions based on median level bounces below. 15M and hourly bodys above median. If levels break and close I'll be looking to exit quickly.
The lower area has better odds of bounce off of a major level and I would expect more impact here.
I'm overly bullish and we could see a massive move come in so play smart.
SOLANA - BULLISH & BAERISH
Hello everyone,
here is my current outlook on Solana (SOL):
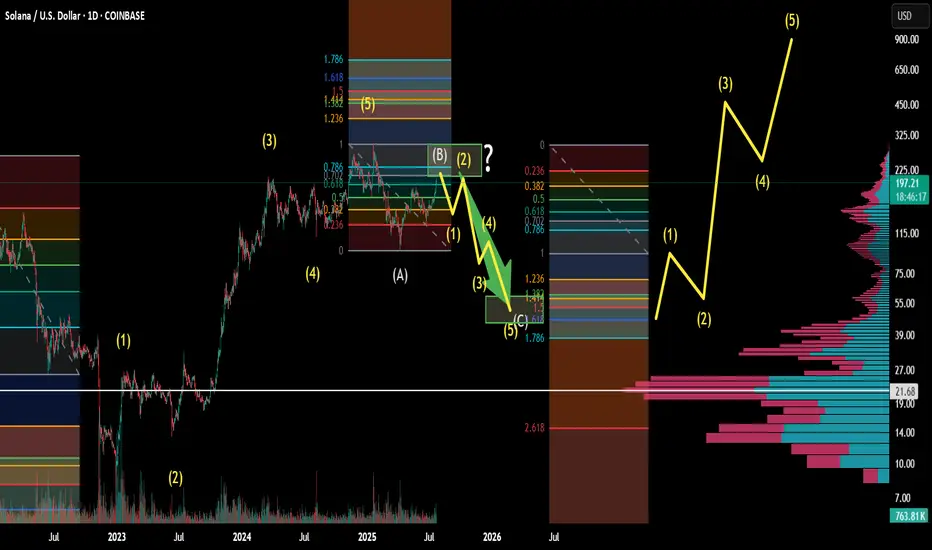
Personally, I am currently only watching Solana as we may already be in a correction phase. Nevertheless, there is an interesting scenario where we could still be in a green wave 5, which could potentially reach prices above USD 300.
Possible course:
In April 2025, the bottom may have been found following an ABC formation.
Wave 1 (yellow) could be completed in May 2025.
Wave 2 (yellow) could end in June 2025.
We could currently be in wave 3 (yellow).
Important point to watch:
If the price does not make it sustainably above the yellow wave 1 (approx. USD 190), the probability increases strongly that we are still in a B wave.
This would mean that we are still in a major correction, which could theoretically take us back to around USD 60. In this scenario, wave 1 would have already ended in January 2025 and we would still be in the correction of wave 2.
Conclusion:
The indicators are particularly important in this phase. Keep a close eye on them to better understand the structure.
Very Bullish!!
Solana chart looks very bullish. The price is currently dropping but I think it is a very healthy correction.
Weekly chart:
1) all momentum indicators just entered the bull zone.
2) The chart is forming higher highs.
Daily:
1) EMA55 finally crossed EMA200. The last time they crossed was October 2023 (see red vertical line in the chart) and it was the beginning of the macro bull trend.
2) Momentum indicators have reached overbought territory and crossed to the downside, however, given weekly momentum indicators have just entered the bull zone, this move is likely to be corrective action.
3) When EMA55 and EMA200 cross, the price often retraces initially to EMAs (21, 55 or 200). Once it completes the pull back, I anticipate the price to move to the previous ATH and beyond.
This is the time when high leverage trading volume increases.
Be careful not get wicked out. Focus on monthly/weekly/daily charts and ignore the noise in the lower timeframes.

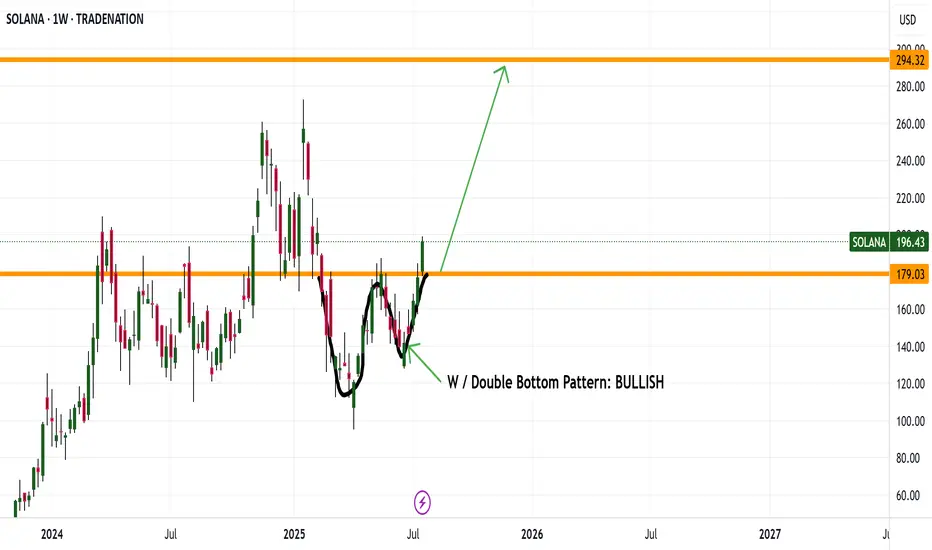
SOLANA DRIVING UP TO 294 Good evening everyone
It looks like SOL made a nice W pattern and now breaking its weekly high is driving up to 294
Enjoy happy trading this bull run
Kris/ Mindbloome Exchange
Trader Smarter Live Better
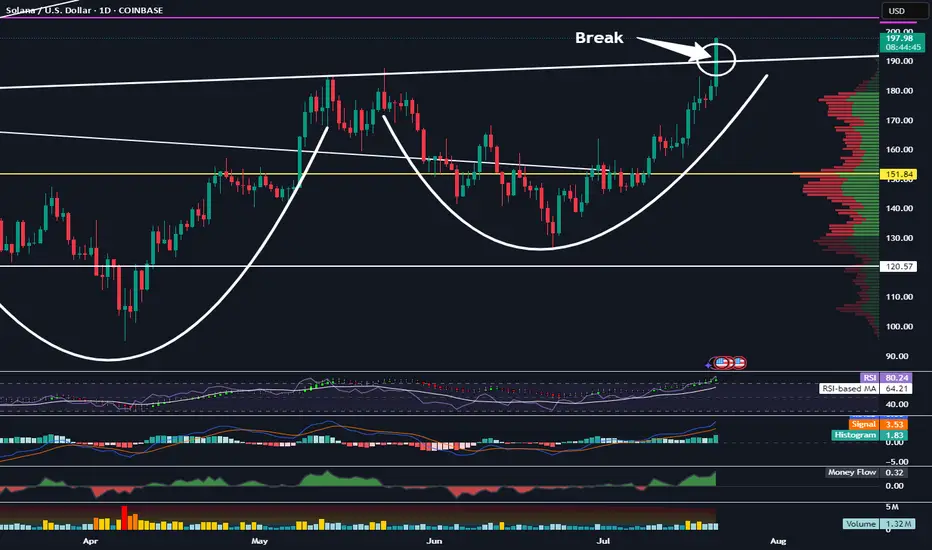
Solana Has Broken This Important Resistance LevelTrading Fam,
Things are definitely heating up in the altcoin space. Two big key movers are ETH and SOL. Right now SOL has broken a very important resistance level in the neckline of this inverse H&S pattern. Watch closely. If the body of our daily candle closes above this today and remains above it tomorrow, this pattern is in play and our target would be around $275.
✌️Stew
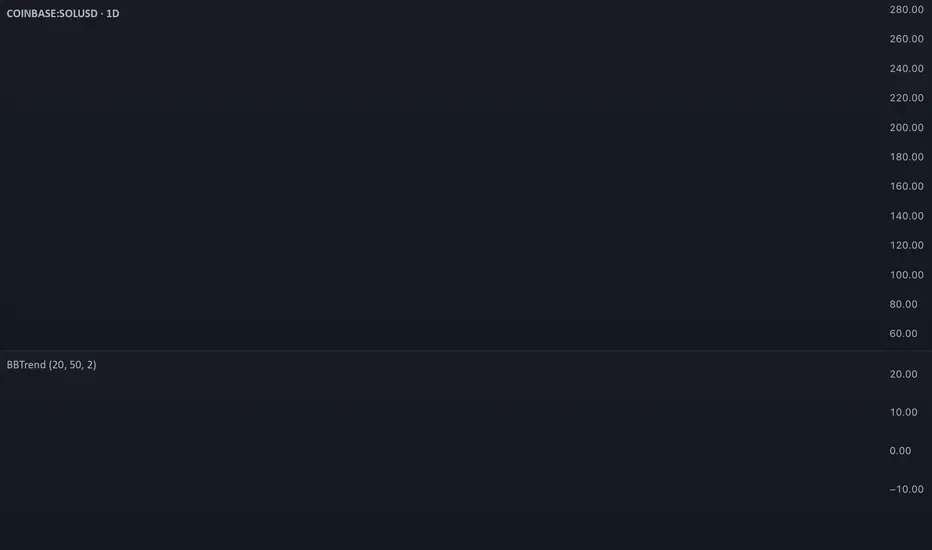
SOL Traders Begin Taking Profits Despite Bullish RallySolana (SOL) continues to climb, but under the surface, signs of selling pressure are starting to emerge. While price action has been bullish and on-chain activity remains strong, the BBTrend indicator is flashing red — literally. For the past three days, its histogram bars have turned red and gradually increased in size, signaling a rise in mild but persistent selling activity.
The BBTrend, which gauges trend strength using Bollinger Band behavior, shows that SOL is consistently closing near the lower band. This pattern suggests that despite the upward momentum, some traders are quietly taking profits — possibly positioning for a near-term pullback. The rally remains intact for now, but the growing divergence between price and BBTrend behavior hints at early signs of weakening confidence.
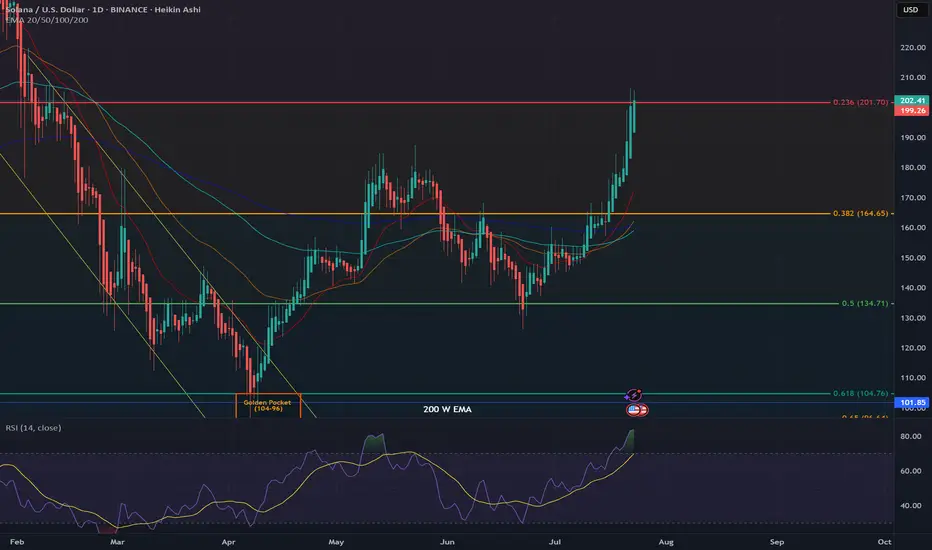
SOL key resistance 201We are reaching a key level in the fib retracement which sits at 201 USD. With the daily RSI being in the overbought area, I would expect a pullback to 180 or 165. DYOR, would love to hear your thought
SOLUSD at Strong SUPPORT SOLUSD was trading down trend the and is current at the support which was its resistance earlier and this is a strong support and expect further growth or up movement of for SOL. 2010-215.

20:1 R:R for SolanaTaking a chance on this super high-risk setup with a 20:1 R:R before it takes off.
Entry: 177.78
Stop Loss: 173
Target: 260

SOLUSDI can't say I'm a big fan of this chart setup. Sure, it's ascending triangle, but it has a lot of touches of support, and there's a huge gap to the VPVR shelf below. It's even lower than the candle support. It kind of shows you that all the action, all the volume happened way earlier in the chart, and recently, there hasn't been a lot of volume. SOL is running on fumes in my humble opinion. I think the risk is to the downside, but I'll be mistaken if volume suddenly picks up, and creates an ascending triangle breakout. I just don'e see it. I see trepidation on support.

SOL TO THE MOONthe solana has urged a retracement , going back to its key zone, the next bullrun will explode the price of solana, make sure you have enough sol in your wallet
Double bottomDouble bottom with RSI regular divergency. It seems that buyers a willing to buy at this level again.

Opened longI opened a long position.
Ideally it is safe to wait for EMAs to line up for the bull trend (EMA21 > 55> 200) in the Daily chart. However, there are many indications that the price will start to move to the upside and the upside move might be quite aggressive. So I decided to open a long position with a small position size.
The reasons for opening a long position:
Daily:
Bull candle has closed above EMA21 for a few times.
RSI lines have crossed and entered the bull zone.
MACD lines are about to enter the bull zone.
Stochastic lines are above to cross and move up.
The price has been staying above Fib 0.236 level for about 10 days.
The price has broke and closed above the descending parallel channel.
4H:
All momentum indicators are in the bull zone.
EMA21 is above EMA 55.
The price has closed above EMA200.
The price is consolidating above the top descending parallel channel.
It is not the perfect bull trend set up, however, there are enough confluences for the price to start to move to the upside.
Entry price: $142.59 (blue horizontal line in 4H chart)
Stop Loss: $130.40 (red horizontal line in 4H chart)
Target: $195 (green horizontal line: Fib 0.5 level in Daily chart and fair value gap zone)
$178 is a strong support and resistance area, so if it starts to stall, I might take a partial profit.
Fingers crossed.

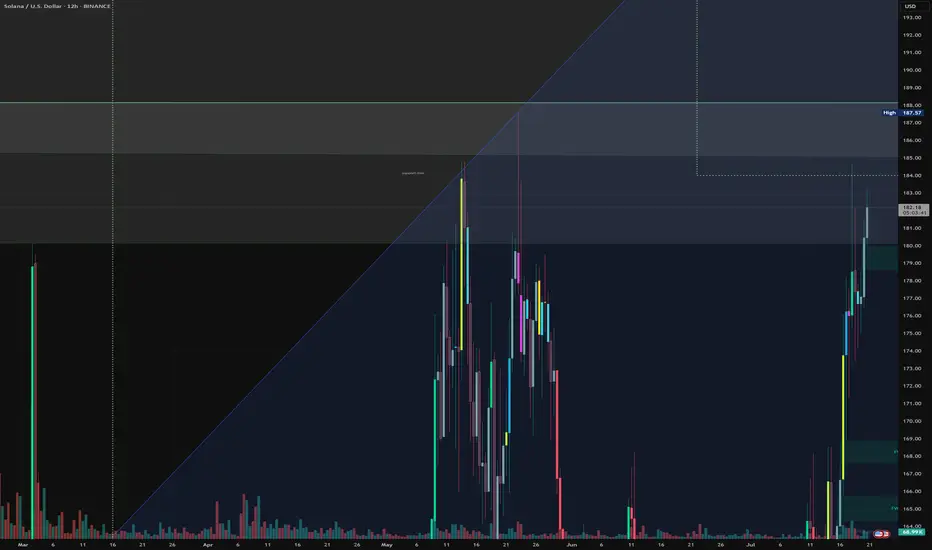
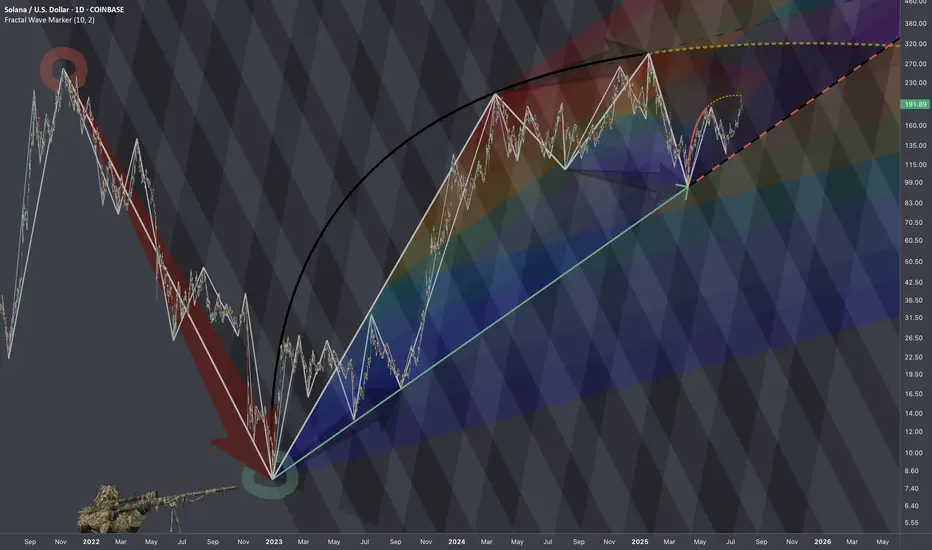
$SOLUSD: Scaling LawsResearch Notes
Progressions here are evident so I'll use the historic bits and organize them into structure that would determine the levels inside dark highlighted zone of the local scope.
If we scale back, it's hard to avoid the massive drop that structurally can serve as reference point.
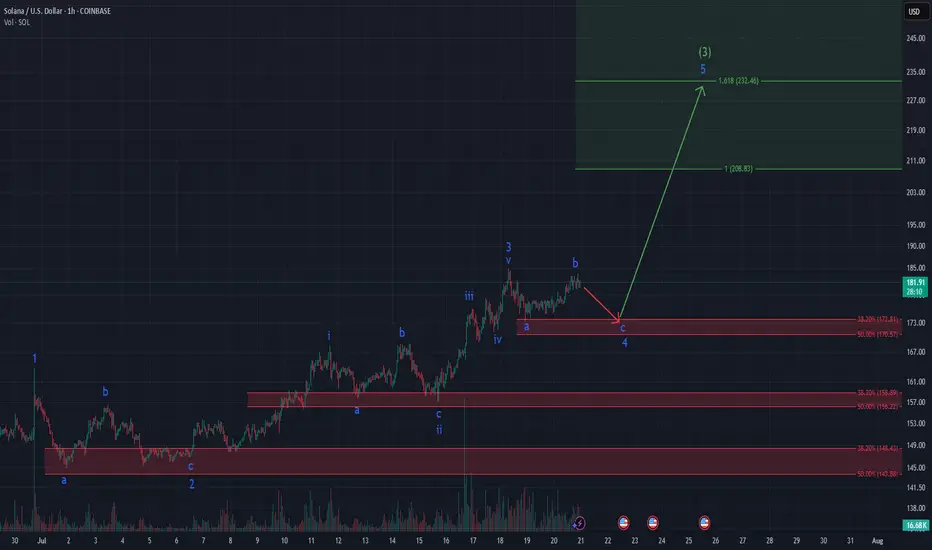
SOLANA ready for Explosion? Textbook Elliott Setup unfoldingSolana – Textbook Elliott Wave Structure Unfolding!
Clear impulsive fractals, textbook ABC corrections, and precise Fibonacci reactions – this 1h chart on CRYPTOCAP:SOL is a dream for any Elliottician.
We’re currently finishing wave C of (4) within a well-formed bullish impulse. Key support lies between $170–$173, aligning perfectly with the 38–50% retracement zone. From there, I expect wave 5 to launch, targeting $232.46 (1.618 extension), which would complete the green (3) wave.
Both RSI and MACD suggest we're approaching exhaustion – a healthy reset here could provide the perfect setup for the next breakout.
🔹 Are you bullish on Solana?
🔹 What chart would you like me to analyze next?
👇 Let me know in the comments and feel free to follow for more detailed Elliott Wave crypto setups.
#Solana #ElliottWave #CryptoTA #TechnicalAnalysis #Wave5 #Fibonacci #BullishSetup #Altseason #CryptoBreakout #SOLUSDT #TradingView
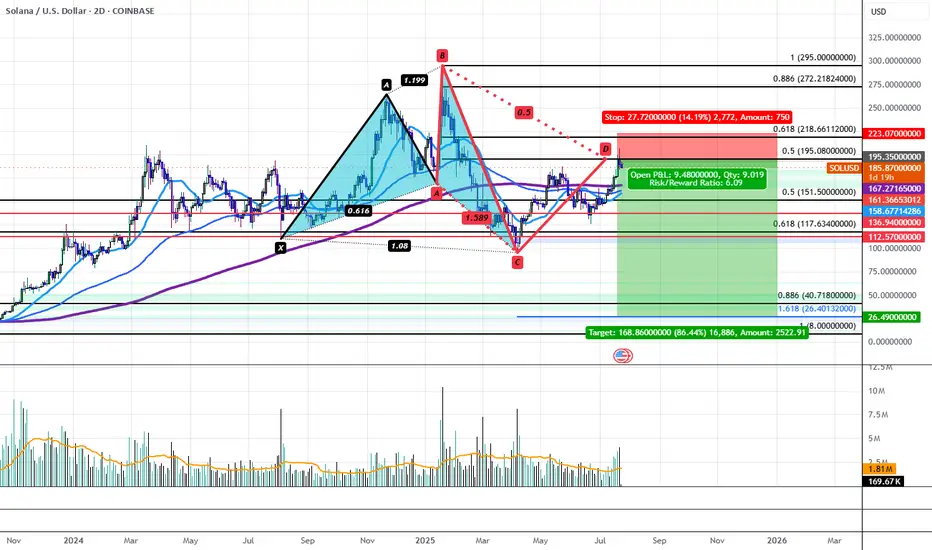
Solana's Bearish 5-0 is Locking in a Bearish Reversal to $26.40Solana has recently run up to Horizontal Resistance Zone of $195-$210 aligning with the PCZ of a Bearish 5-0 and has begun to impulse downwards with volume to back it. This could be the start of a greater move down that would take SOL back to the low of the distributive range at $95.16. If the level breaks, we would then target a drop down to the $40.72-$26.40 confluence area aligning with the all-time 0.886 retrace as well as the 1.618 extension from previous swing low to high. Only at these levels could we even possibly begin to consider Bullish Entries on Solana.
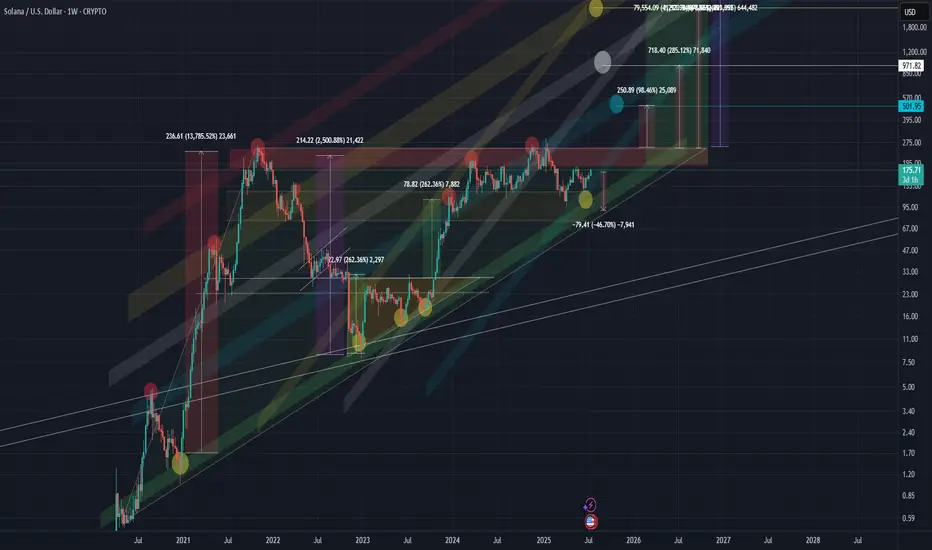
SOLANA SOL 1WThis coin is showing very interesting development, and the market maker seems to be painting clear structural patterns.
🔷 Macro Structure: Rising Triangle
On the higher timeframes, we can clearly see a rising triangle formation taking shape. If this pattern breaks out to the upside, the potential measured move suggests a target of up to ~2,500% from current levels.
📊 Chart Overview
Wide zones = key support and resistance
Former resistance often becomes support after a breakout
All target levels and zones are clearly marked on the chart
⚠️ Risk Warning & Realistic Scenario
Be mindful of market behavior:
Often before a bullish breakout, we see a fake breakdown — a trap to liquidate early longs — followed by a return into the triangle and a strong move upward. Don’t rush. Let the pattern confirm itself.
💡 Plan Accordingly
If you're already in, consider protecting your position with a stop-loss
Don’t overleverage, and take profit partially on strong levels
SOL Breakout Fueled by Momentum — $165 Flip Holding StrongSolana continues its strong uptrend after reclaiming key structure. Price broke out above the $165 resistance zone and turned it into support — a classic continuation setup.
What makes this move stand out isn’t just the structure, but how clean the momentum confirmation has been throughout.
The **MACD Liquidity Tracker Strategy** — designed to filter signals based on both trend alignment and momentum compression — flagged a long around the $155 reclaim.
From there, we saw rising histogram bars, a clean crossover, and price action that respected the entry all the way up through consolidation.
This type of strategy doesn't just look at MACD crosses alone.
It analyzes whether liquidity is *compressing or expanding*, and filters trades based on whether there's actual follow-through potential — especially useful in choppy markets like what we saw in late June.
This latest run is a good example of how pairing structure (support flips, key reclaims) with smart momentum filters can keep you in the move — and out of the chop.
We’re watching to see how SOL behaves above $180 and whether momentum sustains into higher resistance zones.
—
#SOLUSD #Solana #MACDStrategy #MomentumBreakout #SupportFlip #TradingEdge #BacktestBetter #QuantTradingPro #CryptoTrading #TradingView

SOL holding above the 204 on the daily could be a long positionSOL is respecting the 204 on the daily and if it holds above it, we could have a long position buying opportunity.
Upside could be too the 222 resistance line if it holds above the 204.
Sentiment seems to be good for Sol and other strong alt coins at the moment. This also supports and upside trajectory.

Solana Macro Cycle Elliotwave countTop has been in for solana since going back to ATH. We are in a bear market retrace rally. Looking to scoop between 50-40 about 1 year from now. Let me know what you think below.
Trading alts on solana right now during the retrace rally, then potentially looking to rotate into radix plays or other coins finishing their wave 2's