S&P 500 Bullish Rounding Bottom in PlayS&P 500 continues its upward trajectory, supported by a clearly defined rounding bottom formation. Price has successfully broken above the neckline resistance, followed by a technical pullback which was met with a strong buy reaction, validating this zone as a key demand area.
This pullback area no

US500 Needs retracementVery good opportunity to sell above 6400... and then i expect it to touch 6085

SP500 reinforcing a bearish short-term trendThe S&P 500 retreated in the final session of July, weighed down by renewed tariff concerns and ongoing uncertainty surrounding the Fed’s next policy move. Despite the late pullback, the index remains positive for the month overall.
From a technical perspective, the index has declined approximately

US500 Bearish Idea: Waiting for Structure Break ConfirmationWatching the SPX US500 right now 📈 — it’s rallied hard with strong momentum and is pushing into a key resistance level ⚠️. Since price is overextended, I’m expecting a pullback towards equilibrium on the current move 🔄. My bias is bearish from this level 🔻, with entry dependent on a break in structu

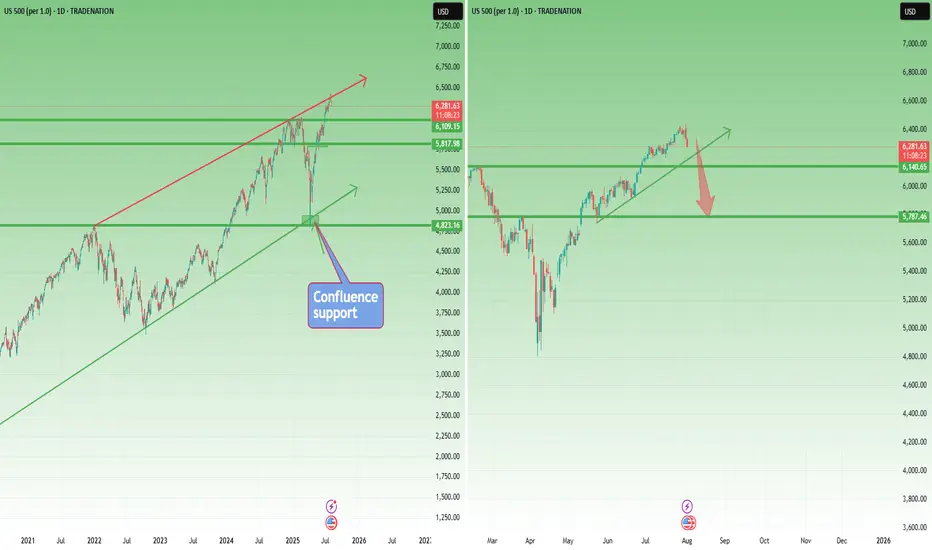
Correction Ahead? SP500 Prints Reversal Signal at Key Resistance📘 This market moves like a textbook chart
SP500 is acting like a perfect case study from a trading manual. Back in early April, the index dipped just below 5,000, right into a confluence support zone ( I had spoken about this at the time ) – formed by the long-term ascending trendline and the 202
S&P 500: Bearish For The Short Term! Sell It!Welcome back to the Weekly Forex Forecast for the week of July 28 - Aug 1st.
In this video, we will analyze the following FX market for the week of Aug 4-8th:
S&P 500 (ES1!)
The S&P 500 rose Friday to fresh highs, following a busy week of tariff updates and earnings. The S&P ended the week with

S&P500 at pivot zone Stocks are climbing higher, with S&P 500 futures up on hopes for interest rate cuts and solid company earnings. The outlook is positive, especially in the finance world—bankers, hedge funds, and asset managers are expected to get higher bonuses this year, reflecting stronger market conditions.
On t
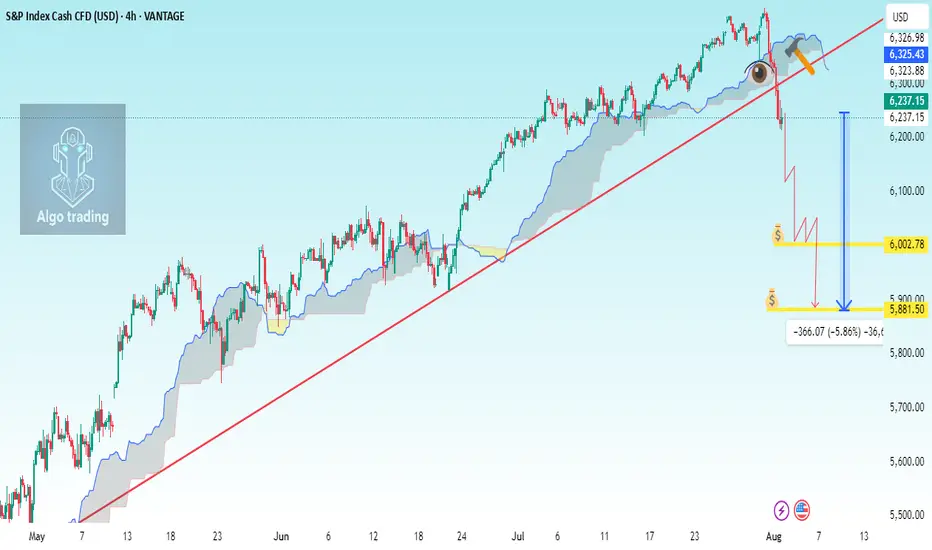
SP500 H4 analysis Breakdown TrendlineChart Components Observed:
Ichimoku Cloud: For trend and support/resistance visualization.
Uptrend line (manually drawn): Connecting higher lows since early May 2025.
Support break: Price has recently broken below the trendline and below the Ichimoku cloud.
Current Price: 6,237.15 (▼ -1.64%)
Lower High Complete?OFC earnings provided buys a good level to pick up price but POC at 6375 was key.
The 4HR shows and englufing with LH partially complete.
Bias is Short!

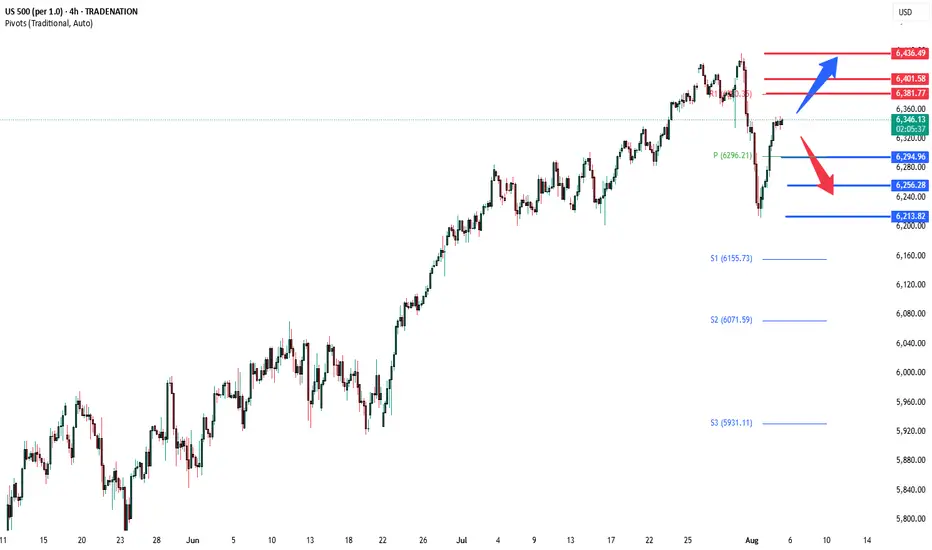
SPX500 Technical Setup – Eyes on 6365 and 6399 TargetsSPX500 – Overview
The price has stabilized above the key pivot level at 6341, maintaining a bullish bias. As long as the price holds above this level, the upward momentum is expected to continue toward 6365 and potentially 6389 or 6399.
However, a 1H close below 6323 would signal a possible trend

See all ideas
Displays a symbol's price movements over previous years to identify recurring trends.
Frequently Asked Questions
US 500 (SPI) / US Dollar reached its highest quote on Jul 31, 2025 — 6,468.38 USD. See more data on the US 500 (SPI) / US Dollar chart.
The lowest ever quote of US 500 (SPI) / US Dollar is 2,172.13 USD. It was reached on Mar 23, 2020. See more data on the US 500 (SPI) / US Dollar chart.
US 500 (SPI) / US Dollar is just a number that lets you track performance of the instruments comprising the index, so you can't invest in it directly. But you can buy US 500 (SPI) / US Dollar futures or funds or invest in its components.