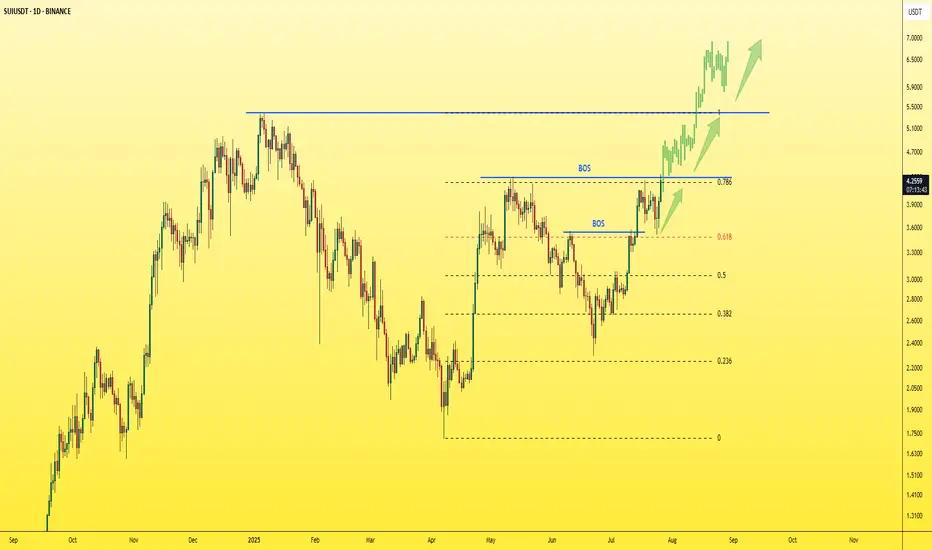
SUI - Just one step away from the explosion!The last candle on the daily chart just confirmed a BOS (Break of Structure) — a clear and strong sign of bullish continuation for the asset.
✅ This is a textbook entry for a long position.
🎯 Next target: $5 — and so far, no bearish signs in sight.
Best regards,
Ceciliones 🎯
Related pairs
TradeCityPro | SUI Eyes Breakout with Bullish Momentum Rising👋 Welcome to TradeCity Pro!
In this analysis, I want to review the SUI coin for you. It’s one of the Layer1 projects in the crypto space, currently ranked 13 on CoinMarketCap with a market cap of $13.66 billion.
📅 Daily Timeframe
On the daily timeframe, a lot has changed for SUI since the previous

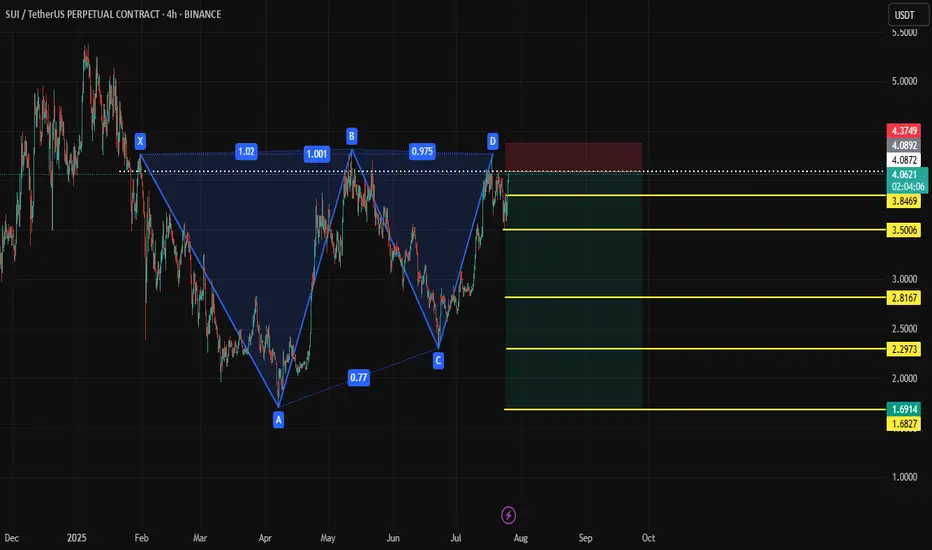
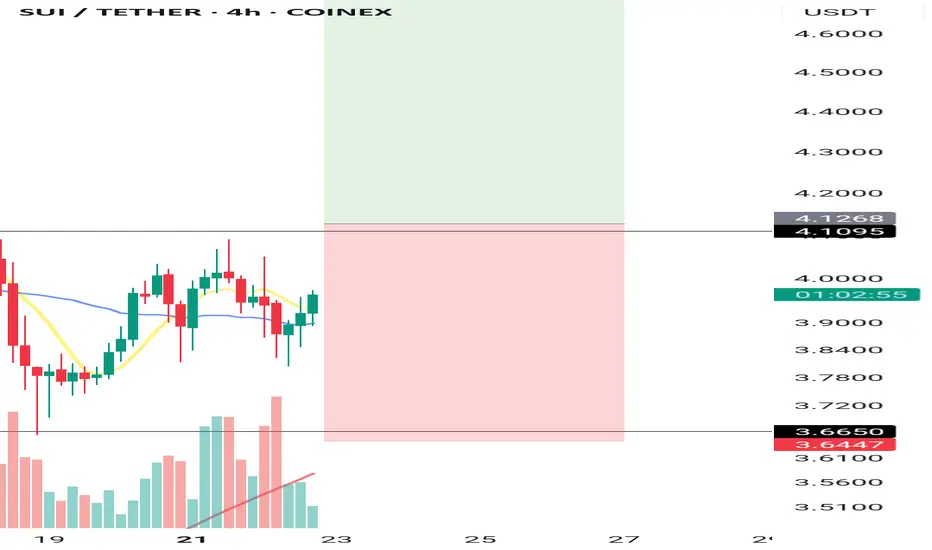
SUI Shortanalysis for sui bearish pattern
Short Entry: $4.10 – $4.20
Stop-Loss: $4.35+
Target 1: $3.60
Target 2: $3.10
Target 3 (Full XA move): ~$1.75 (aggressive)
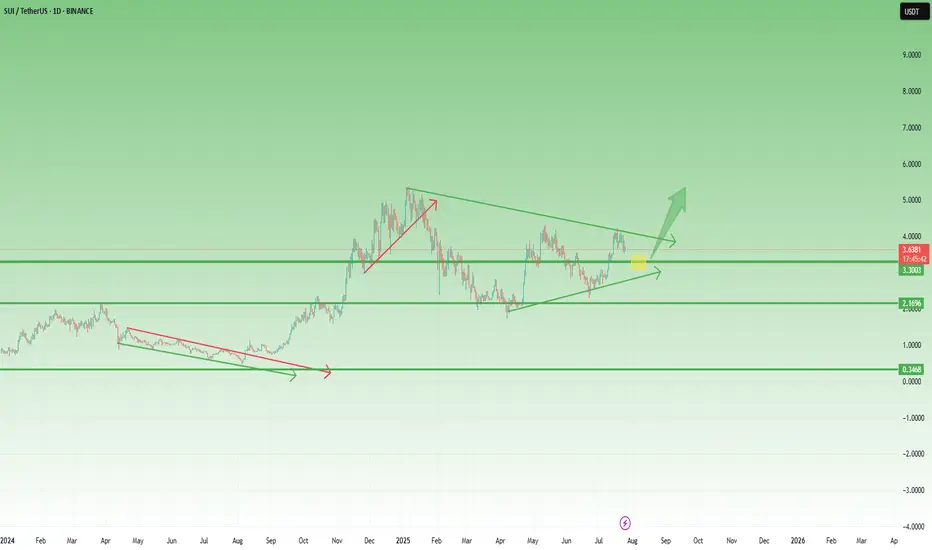
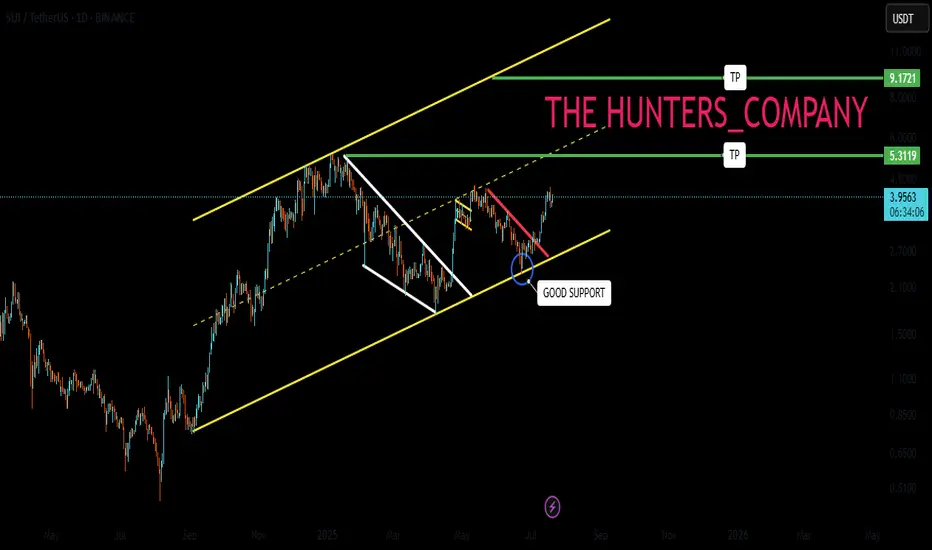
SUI – Preparing for a Breakout? Symmetrical Triangle in PlaySince the beginning of the year, SUI has been consolidating inside a classic symmetrical triangle — marked by higher lows and lower highs, a sign of tightening price action and growing pressure.
This kind of structure doesn’t last forever.
Usually, it ends with a strong breakout — especially if sup
Lingrid | SUIUSDT Buying Opportunity from Support ZoneBYBIT:SUIUSDT is pulling back from the recent range top after testing the resistance zone and is approaching the key breakout area. The structure shows an upward channel with a prior consolidation breakout and an ongoing corrective retracement. As long as the price holds above the confluence zone n

SUI Analysis (6H)If you're on the hunt for extreme risks and potentially high rewards — SUI might be calling your name.
Currently, SUI is trending within a well-respected ascending channel, and just today, it tapped both the demand zone and the lower boundary of this channel.
That’s what we call a double support,
SUI : HODL BASKETHello friends🙌
🔊We have come to introduce a signal that can be a good option for your investment portfolio.
Given that the price is in the ascending channel and has good support from buyers, it is expected that this time the price will break the middle line of the channel and move to the ceiling of
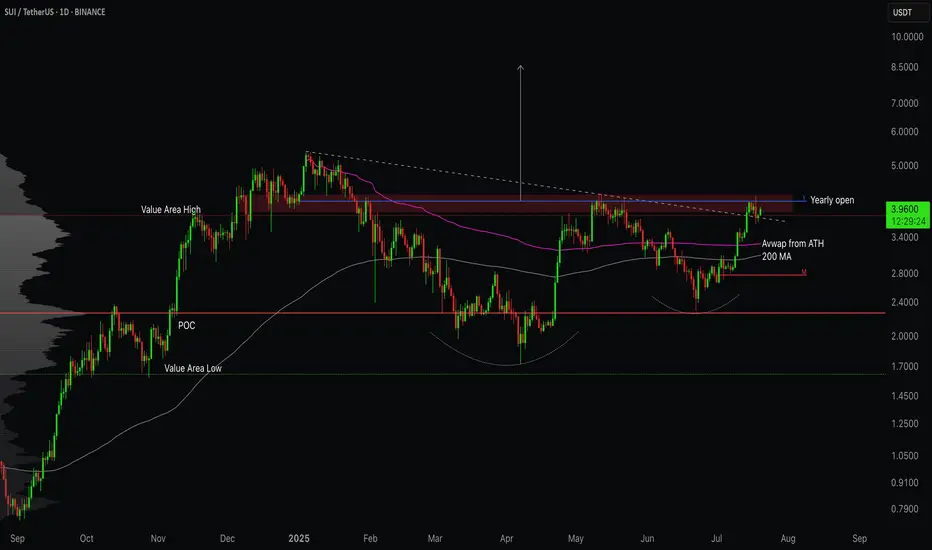
SUI - Breakout of the yearSUI is currently trading near the resistance line. Price was reject around this resistance line in the previous pump.
- Given the current bullish market, price is expected to breakout from this resistance easily
Entry Price: 4.04
StopLoss: 3.2
TP1: 4.5059
TP2: 5.3810
TP3: 6.5106
TP4: 7.8772
TP5: 1
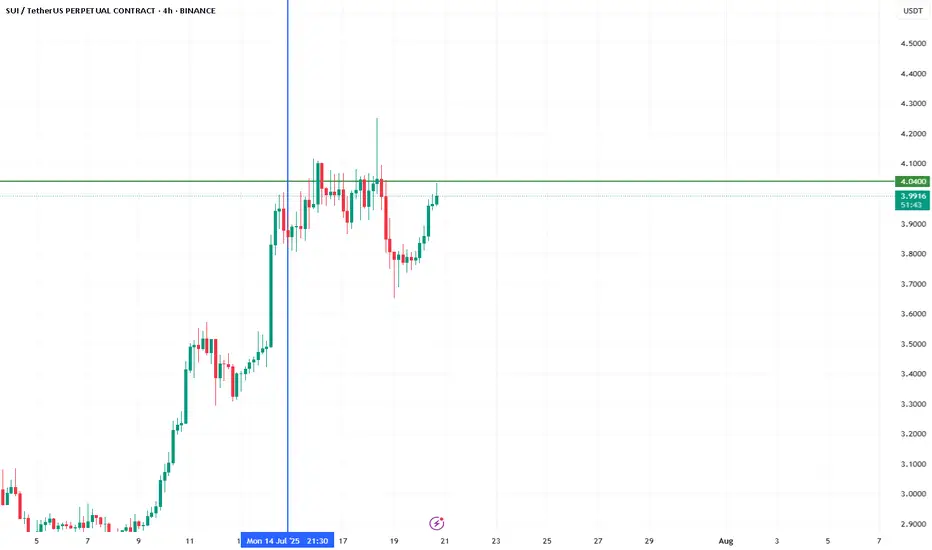
Technical Analysis – SUI/USDT long position (4H Timeframe)
🚀 Technical Analysis – SUI/USDT (4H Timeframe)
🗓 Date: July 22, 2025
📌 Suggested Entry:
$4.12
🎯 First Target:
$5.10 – Risk to reward ratio ≈ 1:2 ✅
🛑 Stop-Loss:
$3.60
---
🔍 Entry Conditions:
✅ If there is strong volume and momentum:
Enter on breakout of the $4.12 level in the 1-hour timeframe
SUI/USDT - Testing the Top of ValueSUI is back in focus as price pushes into a critical zone of resistance that has capped previous rallies. With key moving averages reclaimed and volume shifting in favour of bulls, the question now is simple - can it break free, or is this another trap before rotation lower?
Let’s break down the
See all ideas
Summarizing what the indicators are suggesting.
Oscillators
Neutral
SellBuy
Strong sellStrong buy
Strong sellSellNeutralBuyStrong buy
Oscillators
Neutral
SellBuy
Strong sellStrong buy
Strong sellSellNeutralBuyStrong buy
Summary
Neutral
SellBuy
Strong sellStrong buy
Strong sellSellNeutralBuyStrong buy
Summary
Neutral
SellBuy
Strong sellStrong buy
Strong sellSellNeutralBuyStrong buy
Summary
Neutral
SellBuy
Strong sellStrong buy
Strong sellSellNeutralBuyStrong buy
Moving Averages
Neutral
SellBuy
Strong sellStrong buy
Strong sellSellNeutralBuyStrong buy
Moving Averages
Neutral
SellBuy
Strong sellStrong buy
Strong sellSellNeutralBuyStrong buy
Displays a symbol's price movements over previous years to identify recurring trends.
Frequently Asked Questions
The current price of SUI / TetherUS (SUI) is 4.3361 USDT — it has risen 2.17% in the past 24 hours. Try placing this info into the context by checking out what coins are also gaining and losing at the moment and seeing SUI price chart.
SUI / TetherUS price has risen by 10.75% over the last week, its month performance shows a 63.26% increase, and as for the last year, SUI / TetherUS has increased by 450.83%. See more dynamics on SUI price chart.
Keep track of coins' changes with our Crypto Coins Heatmap.
Keep track of coins' changes with our Crypto Coins Heatmap.
SUI / TetherUS (SUI) reached its highest price on Jan 6, 2025 — it amounted to 5.3687 USDT. Find more insights on the SUI price chart.
See the list of crypto gainers and choose what best fits your strategy.
See the list of crypto gainers and choose what best fits your strategy.
SUI / TetherUS (SUI) reached the lowest price of 0.1000 USDT on May 3, 2023. View more SUI / TetherUS dynamics on the price chart.
See the list of crypto losers to find unexpected opportunities.
See the list of crypto losers to find unexpected opportunities.
The safest choice when buying SUI is to go to a well-known crypto exchange. Some of the popular names are Binance, Coinbase, Kraken. But you'll have to find a reliable broker and create an account first. You can trade SUI right from TradingView charts — just choose a broker and connect to your account.
Crypto markets are famous for their volatility, so one should study all the available stats before adding crypto assets to their portfolio. Very often it's technical analysis that comes in handy. We prepared technical ratings for SUI / TetherUS (SUI): today its technical analysis shows the strong buy signal, and according to the 1 week rating SUI shows the strong buy signal. And you'd better dig deeper and study 1 month rating too — it's strong buy. Find inspiration in SUI / TetherUS trading ideas and keep track of what's moving crypto markets with our crypto news feed.
SUI / TetherUS (SUI) is just as reliable as any other crypto asset — this corner of the world market is highly volatile. Today, for instance, SUI / TetherUS is estimated as 7.49% volatile. The only thing it means is that you must prepare and examine all available information before making a decision. And if you're not sure about SUI / TetherUS, you can find more inspiration in our curated watchlists.
You can discuss SUI / TetherUS (SUI) with other users in our public chats, Minds or in the comments to Ideas.