$TRX — "The Samurai Path" of Crypto? Long-term TRON outlook In a market where coins spike and crash from every tweet, CRYPTOCAP:TRX behaves like a stoic monk.
The price of OKX:TRXUSDT moves steadily, avoiding wild dumps and pumps — as if it exists in a parallel reality.
Now consider two events that would usually explode any altcoin’s chart — but not CRYPTOCAP:TRX :
📅 July 24 — Justin Sun’s TRON Inc gets listed on NASDAQ.
📅 July 28 — TRON Inc announces plans to raise $1B to buy back CRYPTOCAP:TRX and hold it on their balance sheet.
🔍 And yet… the chart remains calm. No hysteria. No euphoria.
Why?
Either CRYPTOCAP:TRX is so predictable that all news is already priced in —
or we simply don’t fully understand the inner mechanics of this ecosystem.
🧭 We call this "The Samurai Path":
Silent. Stable. Emotionless. But with serious long-term potential.
On the chart, we outlined how OKX:TRXUSDT has been moving — and what we expect next.
Because a market cap of $31B is already massive.
But $161B? That’s a statement...
📊 Can #TRON become the next “stable giant” of crypto — or will it surge when no one expects?
TRXUSDT trade ideas

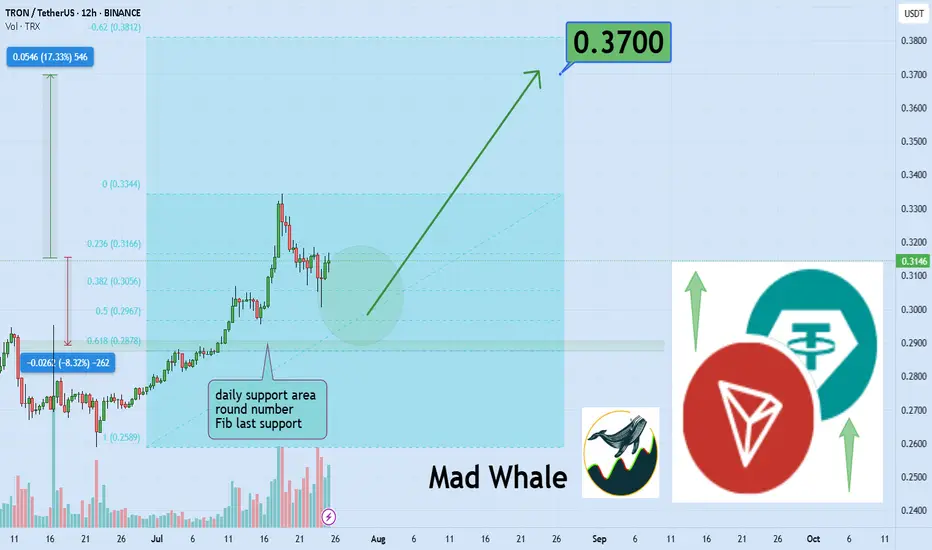
TRON Eyes 17 Percent Surge Toward Explosive 0.37 Breakout TargetHello✌
Let’s analyze TRON’s upcoming price potential 📈.
BINANCE:TRXUSDT is currently approaching a key daily support zone that aligns with a notable Fibonacci retracement level 🧭. This technical confluence suggests a potential short-term rebound, and I’m watching for a possible move of around 17% toward the 0.37 target 🎯.
✨We put love into every post!
Your support inspires us 💛 Drop a comment we’d love to hear from you! Thanks , Mad Whal
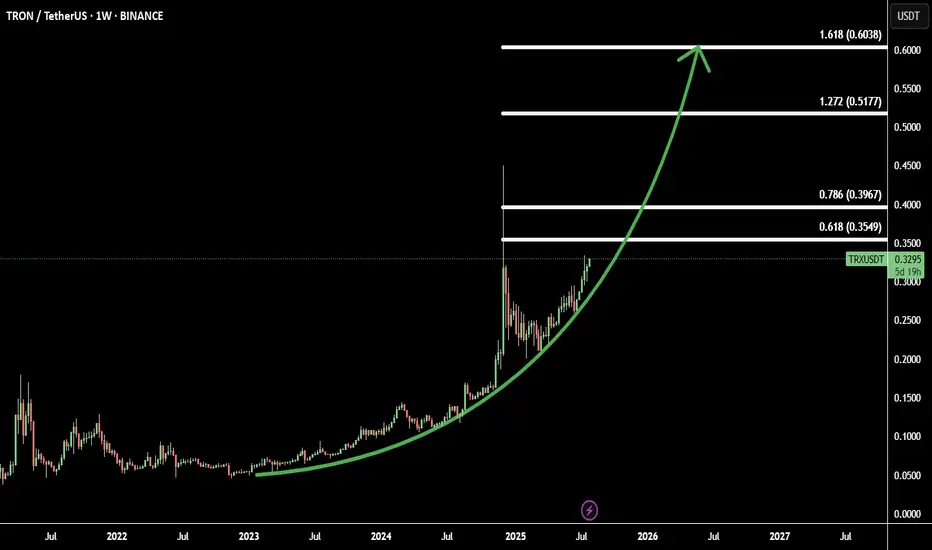
TRX/USDT Starting Parabolic Move: 4 Fibonacci Targets in SightTRX (Tron) is showing early signs of a parabolic breakout, supported by strong momentum and a solid technical structure.
After a long accumulation phase, TRX has gained bullish traction and is now accelerating. The price action suggests the beginning of a steep upward curve, often associated with parabolic rallies.
Using Fibonacci extensions, we identify 4 bullish targets:
Target 1: 0.618 Fib - 0.35 – initial breakout confirmation zone
Target 2: 0.786 Fib – 0.39 - key mid-level resistance
Target 3: 1.272 Fib – 0.51 - extended bullish target
Target 4: 1.618 Fib – 0.60 - full parabolic potential
This setup provides a great opportunity for trend traders aiming to ride the wave early.
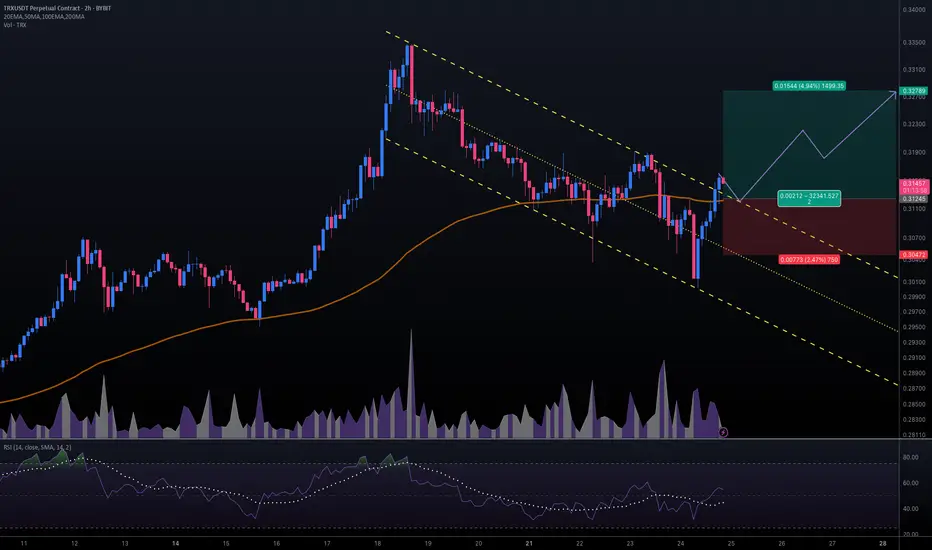
#TRXUSDT #2h (ByBit) Descending channel breakout and retestTron just regained 100EMA support and seems ready for bullish continuation after a pullback to it.
⚡️⚡️ #TRX/USDT ⚡️⚡️
Exchanges: ByBit USDT
Signal Type: Regular (Long)
Leverage: Isolated (16.0X)
Amount: 5.1%
Entry Targets:
1) 0.31245
Take-Profit Targets:
1) 0.32789
Stop Targets:
1) 0.30472
Published By: @Zblaba
CRYPTOCAP:TRX BYBIT:TRXUSDT.P #2h #TRON #DPoS #L1 #Web3 trondao.org tron.network
Risk/Reward= 1:2.0
Expected Profit= +79.1%
Possible Loss= -39.6%
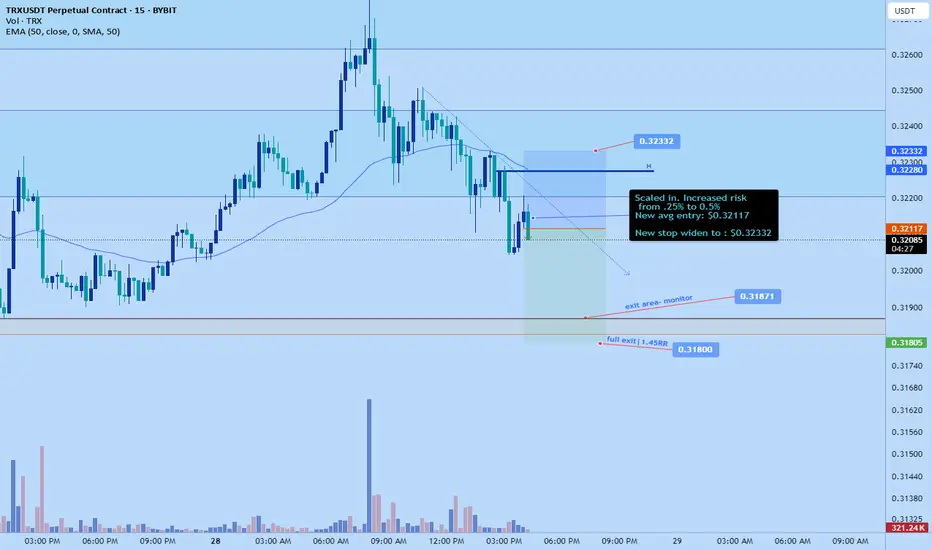
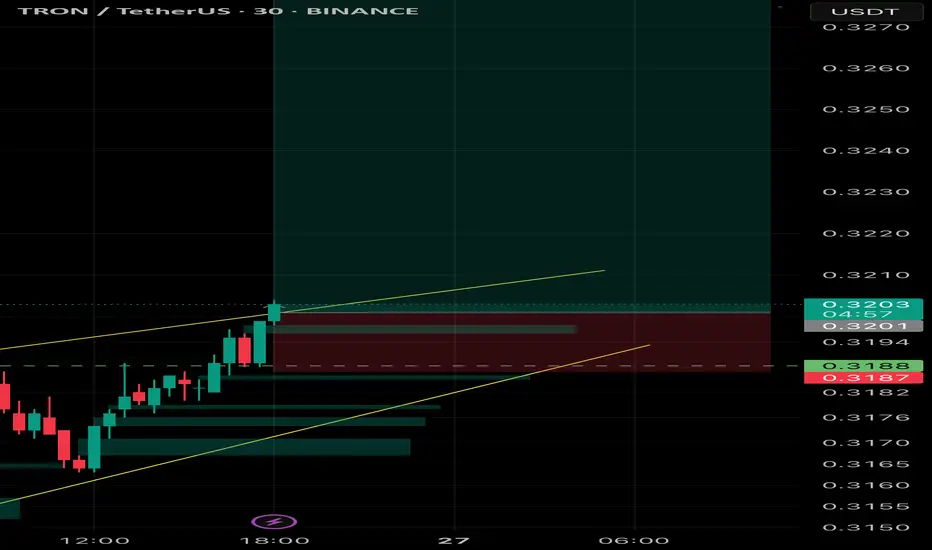
Trx scalp shortsl: $0.32332
Tp: $0.3180
Daily correction seems to be happening on trx. Lower tf flipping bearish to facilitate the move.
Time sensitive
Roughly 1:1 rr from current entry
Check if the second step-up trend can be maintained
Hello, traders.
If you "Follow" us, you'll always get the latest information quickly.
Have a great day.
-------------------------------------
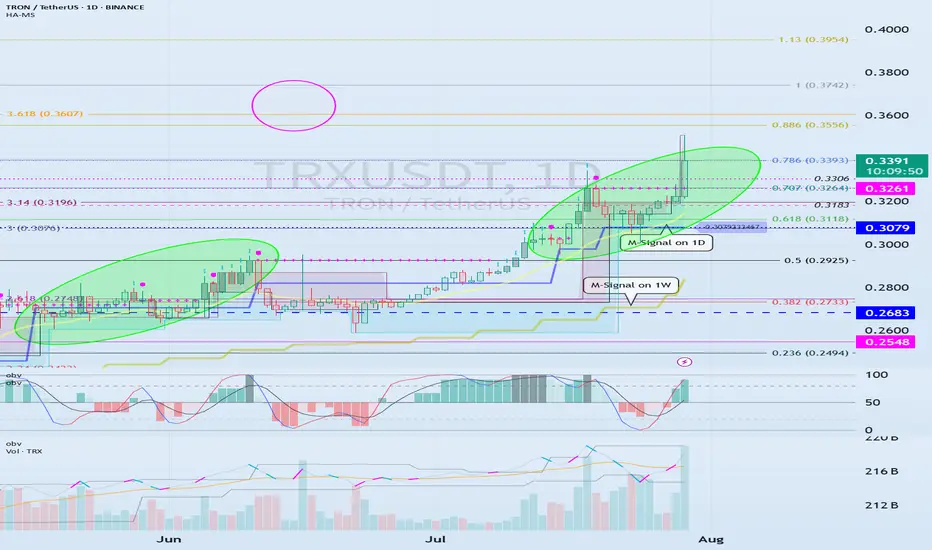
(TRXUSDT 1M Chart)
We need to see if the price can sustain itself by rising above the left Fibonacci level 3.618 (0.3607) and the right Fibonacci level 1 (0.3742).
When the next monthly candlestick is formed, we need to check the movements of the supporting indicators.
-
(1W Chart)
The DOM (60) indicator on the 1W chart is showing signs of forming a new trend.
Accordingly, we need to examine whether a rise above the left Fibonacci level of 3.618 (0.3607) will trigger a new wave.
The left Fibonacci level was created during the first rising wave.
Therefore, if the price rises above the left Fibonacci level of 3.618 (0.3607), a new wave is expected to form.
Since the HA-High indicator on the 1W chart is formed at 0.2683, if the price declines, support near 0.2683 will be crucial.
-
(1D chart)
If the price maintains above the 0.3079-0.3261 range, further upside is expected.
For the price to rise above the left Fibonacci ratio of 3.618 (0.3607) and the right Fibonacci ratio of 1 (0.3742), the OBV indicator of the Low Line ~ High Line channel must rise above the High Line and remain above it.
However, since the StochRSI indicator has entered an overbought zone, the upward movement may be limited.
Therefore, we need to consider how to reset the indicator.
-
The price is continuing a stepwise upward trend, rising above the HA-HIgh indicator.
It is currently in its second stepwise upward movement.
Therefore, the key is whether the price can sustain above the HA-High indicator.
Whether a third stepwise upward movement occurs will depend on whether the price can sustain itself around or above the 0.3079-0.3261 level.
-
Thank you for reading to the end.
I wish you successful trading.
--------------------------------------------------
- Here's an explanation of the big picture.
(3-year bull market, 1-year bear market pattern)
I'll explain more in detail when the bear market begins.
------------------------------------------------------
TRX 3000 RRRTrx is going to the moon, maybe. 5$ macro target imo on a super tight stop. A trader can dream let’s see mega moonshot
TRXUSDT Short Trade - Price CorrectionsBINANCE:TRXUSDT Short Day Trade - Low Risk, with my back testing of this strategy, it hits multiple possible take profits, manage your position accordingly.
Note: Manage your risk yourself, its risky trade, see how much your can risk yourself on this trade.
Use proper risk management
Looks like good trade.
Lets monitor.
Use proper risk management.
Disclaimer: only idea, not advice

TRXUSDT Forming bullish continuationTRXUSDT (TRON/USDT) is currently showing a strong bullish continuation pattern on the weekly chart, suggesting that the momentum is far from over. After a solid upward rally followed by a corrective wave, the price has resumed its uptrend with clear higher highs and higher lows forming on the chart. The recent breakout to the upside signals renewed bullish strength, supported by increasing volume and investor confidence.
The chart setup indicates a potential 40% to 50% price increase in the coming weeks, based on the current market structure and projection from the previous swing high. TRX is now targeting a significant resistance zone, and a successful breakout above this level could trigger a fresh leg up. With broader market conditions stabilizing and TRON's fundamentals remaining strong, the likelihood of sustained gains remains high.
TRON has consistently maintained its presence as one of the top utility-focused blockchain projects, offering fast, low-cost transactions and ongoing ecosystem development. This fundamental strength, combined with the technical setup, is drawing attention from both retail and institutional investors. The rising volume supports the idea that smart money is accumulating ahead of a bigger move.
With momentum building and chart signals aligning in favor of bulls, TRXUSDT is positioned for a potential breakout run. Traders and investors may consider keeping this pair on their radar, especially if it retests support levels successfully before pushing higher.
✅ Show your support by hitting the like button and
✅ Leaving a comment below! (What is You opinion about this Coin)
Your feedback and engagement keep me inspired to share more insightful market analysis with you!

TRXUSDT Long SwingBINANCE:TRXUSDT Long Swing Trade, with my back testing of this strategy, it hits multiple possible take profits, manage your position accordingly.
This is good trade, don't overload your risk like greedy, be disciplined trader.
I manage trade on daily basis.
Use proper risk management
Looks like good trade.
Lets monitor.
Use proper risk management.
Disclaimer: only idea, not advice

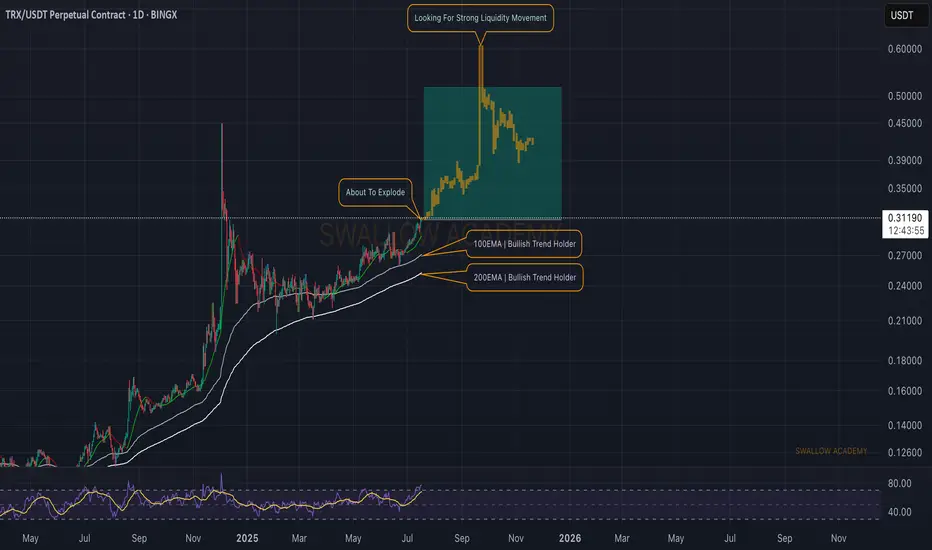
Tron (TRX): $0.40 Incoming | Strong Bullish DominanceTron coin is showing strong buyside dominance, where after the first wave of pump price has been stabilizing yet keeping itself above the lines of EMAs.
As we are seeing strong buyside dominance, we are getting ready for another pump, similar to the last one, so watch closely and be sure not to miss what might come next!
Swallow Academy

Lingrid | TRXUSDT Pullback Following the Bullish Momentum BINANCE:TRXUSDT is consolidating after retreating from the 0.3350 resistance, following a higher high within the upward channel. Despite short-term bearish momentum, price has rebounded off the key 0.3128 support near the blue trendline. A break above recent highs may open a move back toward the resistance zone and upper channel. As long as the ascending structure holds, bullish continuation remains favored.
📉 Key Levels
Buy trigger: Break above 0.3190
Buy zone: 0.3128–0.3160
Target: 0.3350
Invalidation: Break below 0.3090
💡 Risks
Failure to reclaim breakout structure
Channel support breakdown
Broader market weakness in altcoins
If this idea resonates with you or you have your own opinion, traders, hit the comments. I’m excited to read your thoughts!

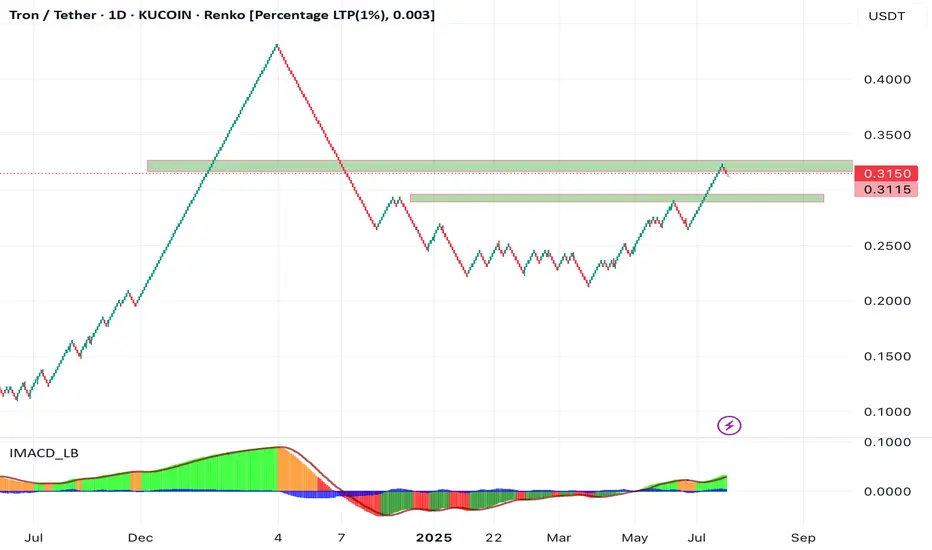
Remarkable Growth in TRON (TRX/USDT) Stability and Price – SuppoIn recent months, the TRON (TRX) network and price have witnessed remarkable stability and growth. According to a recent analysis by CryptoOnchain published on the CryptoQuant platform, one of the main indicators of this stability has been the unprecedented consistency in daily block production on the TRON network. The report highlights that the daily block count has remained nearly constant (around 28,500 blocks), mainly attributed to recent technical improvements, an increase in network energy capacity, and the implementation of a dynamic energy model.
On the provided Renko chart, TRX’s positive price momentum is also clear. Following the recovery from the 0.20–0.22 support zone and strengthening bullish momentum (as indicated by the histogram indicator), a breakout above the $0.3150 resistance could accelerate the upward trend.
Technical & Fundamental Context:
Based on the CryptoOnchain analysis on CryptoQuant: The network’s energy capacity has doubled and a dynamic energy model has been implemented, ensuring operational stability even alongside record transaction volumes.
Despite high on-chain activity, the block production rate has stayed stable, and strong fundamentals supported by security upgrades continue to strengthen both the network and price.
Technically, reclaiming key supports, holding above the Ichimoku cloud, and positive signals from the IMACD_LB indicator all confirm the strength of the trend.
Summary:
The synergy between strong fundamentals (as highlighted in the CryptoOnchain/CryptoQuant analysis) and the chart’s technical structure creates a positive outlook for TRX. If the price holds above the 0.22–0.25 support and overcomes the $0.3150 resistance, higher targets become more likely.

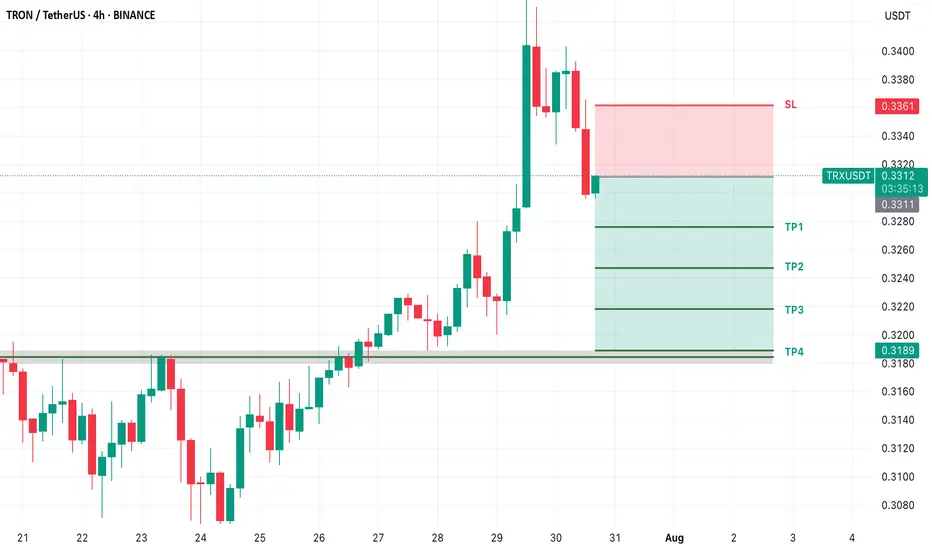
TRX SHORT TRADE SET UPNew Trade Setup: TRX-USDT
SHORT
Entry: 0.3312 OR CMP
Target: TP1: 0.3276, TP2: 0.3247, TP3: 0.3218, TP4: 0.3189
Stoploss: 0.3361
Leverage: 3X
Technical Analysis: TRX/USDT is currently facing strong resistance. There is a high probability of a short-term downward move.
Remarkable Growth in TRON (TRX/USDT) Stability and Price – SuppoIn recent months, the TRON (TRX) network and price have witnessed remarkable stability and growth. According to a recent analysis by CryptoOnchain published on the CryptoQuant platform, one of the main indicators of this stability has been the unprecedented consistency in daily block production on the TRON network. The report highlights that the daily block count has remained nearly constant (around 28,500 blocks), mainly attributed to recent technical improvements, an increase in network energy capacity, and the implementation of a dynamic energy model.
On the provided Renko chart, TRX’s positive price momentum is also clear. Following the recovery from the0.20–0.22 support zone and strengthening bullish momentum (as indicated by the histogram indicator), a breakout above the $0.3150 resistance could accelerate the upward trend.
Technical & Fundamental Context:
Based on the CryptoOnchain analysis on CryptoQuant: The network’s energy capacity has doubled and a dynamic energy model has been implemented, ensuring operational stability even alongside record transaction volumes.
Despite high on-chain activity, the block production rate has stayed stable, and strong fundamentals supported by security upgrades continue to strengthen both the network and price.
Technically, reclaiming key supports, holding above the Ichimoku cloud, and positive signals from the IMACD_LB indicator all confirm the strength of the trend.
Summary:
The synergy between strong fundamentals (as highlighted in the CryptoOnchain/CryptoQuant analysis) and the chart’s technical structure creates a positive outlook for TRX. If the price holds above the 0.22–0.25 support and overcomes the $0.3150 resistance, higher targets become more likely.
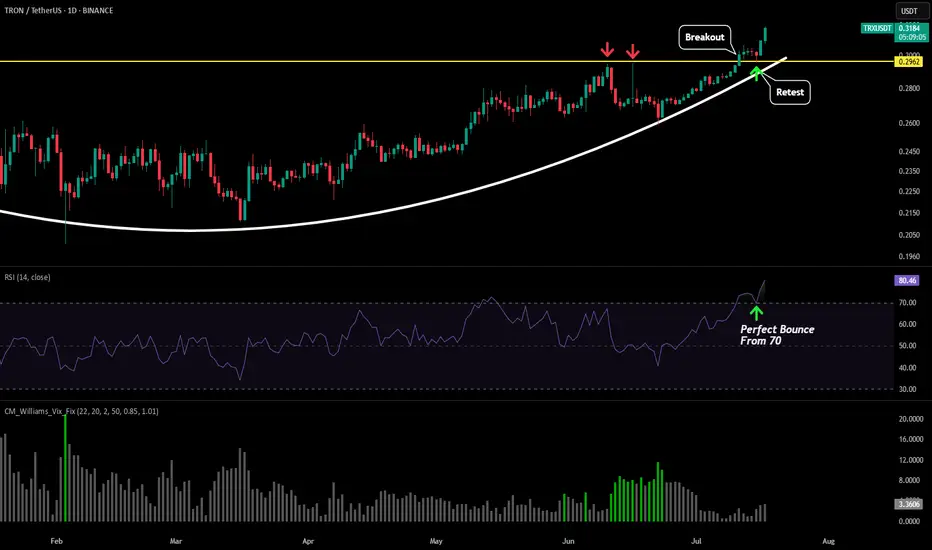
TRX Approaching Cup Breakout – Market Decision Imminent
TRX/USDT – Daily Chart Analysis
TRX is shaping a textbook Cup Pattern on the daily timeframe — a strong bullish continuation signal if confirmed. Price has gradually curved upward, and we are now testing the key resistance area at 0.29–0.30.
📌 Key Scenarios:
🔹 Bullish Breakout Scenario:
A confirmed breakout and daily close above 0.30 would validate the cup formation and set the stage for a rally toward the next target zones at 0.35 and 0.45 — measured based on the cup’s depth.
🔹 Bearish Rejection Scenario:
If the resistance holds, expect a pullback toward the midline (~0.24) for potential accumulation and base-building before the next move.
💡 Volume confirmation and breakout momentum are critical to watch here. The market is approaching a decision point.
🟢 Our directional bias remains bullish — we anticipate the breakout to occur, leading to an upward continuation. However, we’ll wait for confirmation of the breakout and completion of the pattern before entering a long position.

TRX - BreakoutRecently TRX brokeout from its resistance level (yellow line) and is skyrocketing to the upside. The technical move for this move is $0.43-$0.45.
Last time we were around these price levels we saw an almost 100% daily candle so it could shoot up there really quickly. A break back below the yellow line and this because a failed breakout, but right now things look very good.
Tron (TRX): We Are About To Explode | Easy Trade To TakeTron is about to explode. We have been talking for a very long time about it, and since then we have had a decent upward movement, but this is nothing compared to what we are expecting from TRX.
Looking for at least +50% movement from here.
Swallow Academy

TRX - Double signal short Wyckoff Up-Trust + PRS Reading the chart (annotations in sync with chat):
1. Largest Up volume wave
3. Resistance Level coming from Daily chart
3. Fast Up Wave (could be fake)
4. Placed AVWAP on fast wave and
5. Our Entry: Double Plutus signal after the retracement Wyckoff Up- Trhust + PRL
Enjoy reading the waves , speed index and Plutus signals.


DeGRAM | TRXUSD reached the resistance line📊 Technical Analysis
● TRX is grinding the channel top (≈ 0.288-0.290) while printing a narrowing rising-wedge; momentum is fading as each thrust stalls just below the June trend-line.
● A decisive break beneath 0.285 would invalidate the wedge and hand control to sellers, opening 0.279 (mid-band) and the broader channel floor/April pivot at 0.271.
💡 Fundamental Analysis
● Glassnode notes TRON’s stable-coin inflow growth slowed to its weakest since March, hinting at waning on-chain demand, while renewed U.S. regulatory noise around offshore venues keeps speculative flows cautious.
✨ Summary
Sell 0.288-0.290; loss of 0.285 targets 0.279 → 0.271. Bear view void on an H4 close above 0.2945.
-------------------
Share your opinion in the comments and support the idea with a like. Thanks for your support!

TRX USDT SHORT TRADE SETUPTRX/USDT is currently holding at a strong resistance zone, with a high probability of an downward price move. Also EMA 200 acting as a magnet to pull price downward for TRX.
