Stocks Are Crushing It at Record Highs. What’s Behind the Rally?Happy record highs, everyone — confetti, champagne, and yet another all-time high. The Nasdaq NASDAQ:IXIC and the S&P 500 SP:SPX just did it again — notched fresh closing records that have traders flexing their P&Ls like it’s 1999.
If you’ve been on the sidelines, you’re probably staring at th

Biggest What-Ifs in Stocks (or How Investors Live with Regret)You think you’ve got regrets because you didn’t buy Nvidia NASDAQ:NVDA at $50 or sold Tesla NASDAQ:TSLA at $420? Join the club.
The stock market’s history is littered with “almost” trades, missed deals, and facepalm-worthy decisions that turned out to be trillion-dollar pivots.
This is the ha

The market bias stays up, MJ stocks may be a buy here. The market continues to be biased up, and the target is likely the weekly B. MJ stocks are showing technical signs that a reversal may come. There may be other sectors similar as I think the summer bottom gamblers will start appearing now that everything else is at the highs. Gold looks like it will

S&P500 Bullish Leg not over yet.The S&P500 index (SPX) has been trading within a Channel Up since the May 07 Low and is currently unfolding the latest Bullish Leg.
As you can see, it is far from having topped, not just by a plain trend-line (Higher Highs) perspective but also based on the Fibonacci and % rise terms relative to th

$SPX500 Most Hated Rally to Continue?FOREXCOM:SPX500 continues into price discovery suggesting a wave (3) is still underway but nearing a its minimum target of the 1.618 Fibonacci extension target $6310. Overextension of this target will demonstrate an even stronger bullish outlook.
Long term terminal targets remains above $7000 for

Bearish Outlook on the S&P 500: Time to Get ReadyFrom a long-term perspective, I see a short setup building on the S&P 500 index. The anticipated rate cuts in the U.S. — which I believe are coming soon — have historically led to market declines, despite the common perception that lower rates are bullish for equities.
Additionally, the market app

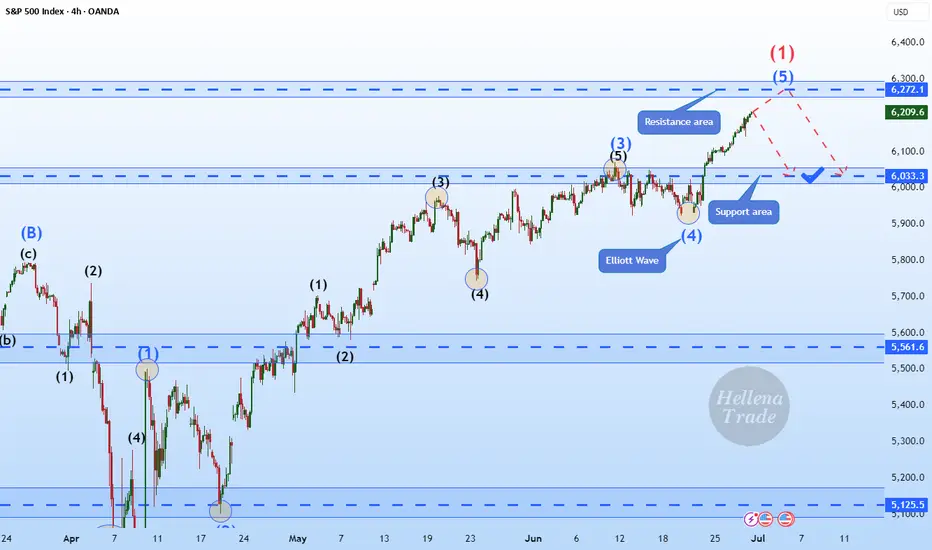
Hellena | SPX500 (4H): SHORT to support area of 6033.Colleagues, I assume that wave “1” completes the upward movement and somewhere around here a major correction ‘2’ should begin, which will consist of waves “ABC” and may continue to the level of 5700. But for now, I think we need to focus on the nearest targets.
I see the support area of 6033 as the
US500 will fly!US500 (H4 time frame) is in up trend and recently broke the highest CTS and touches POI, if it keeps higher and breaks 6,168.13 then go long
This result depends on my own analysis (Am not professional or advisor)

$100 to $1k to $10k to $100k: TRADING MASTERCLASSHow I approach trading:
Trading is a mostly psychological endeavor
You will not WIN LONGTERM in trading until you WIN YOURSELF (i.e. master your emotions)
I use Technical Analysis to help me determine overall Market Direction and Entry/Exit points
I do not use ANY fundamental analysis in my t

Major resistance level for the S%P 500the s and p 500 have been on an uptrend but reems some correction might take place soon

See all ideas
Displays a symbol's price movements over previous years to identify recurring trends.
Frequently Asked Questions
S&P 500 SPOT reached its highest quote on Jul 3, 2025 — 6,283.65 USD. See more data on the S&P 500 SPOT chart.
The lowest ever quote of S&P 500 SPOT is 1,264.50 USD. It was reached on Jan 4, 2012. See more data on the S&P 500 SPOT chart.
S&P 500 SPOT is just a number that lets you track performance of the instruments comprising the index, so you can't invest in it directly. But you can buy S&P 500 SPOT futures or funds or invest in its components.