Stocks Are Crushing It at Record Highs. What’s Behind the Rally?Happy record highs, everyone — confetti, champagne, and yet another all-time high. The Nasdaq NASDAQ:IXIC and the S&P 500 SP:SPX just did it again — notched fresh closing records that have traders flexing their P&Ls like it’s 1999.
If you’ve been on the sidelines, you’re probably staring at th

S&P500 Potential UpsidesHey Traders, in today's trading session we are monitoring US500 for a buying opportunity around 6,075 zone, S&P500 is trading in an uptrend and currently is in a correction phase in which it is approaching the trend at 6,075 support and resistance area.
Trade safe, Joe.

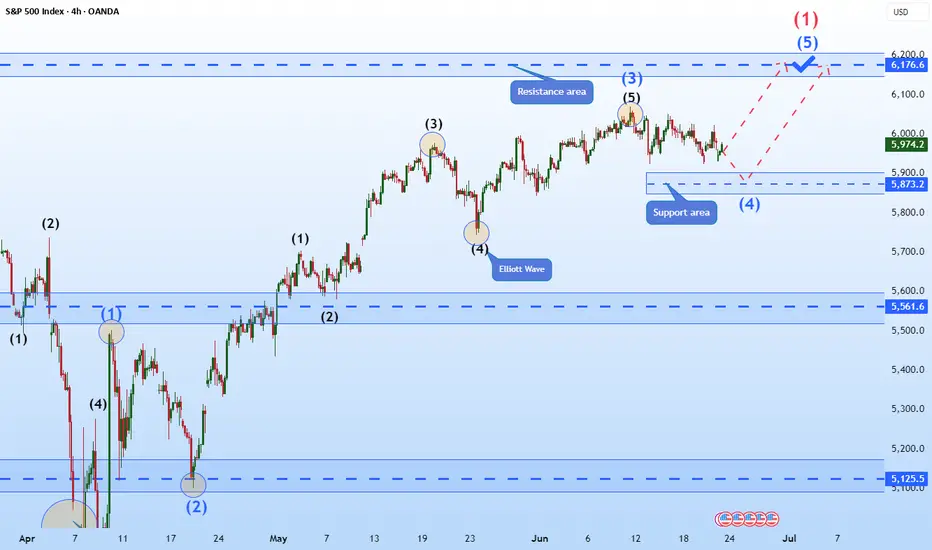
Hellena | SPX500 (4H): LONG resistance area of 6176 (Wave 1).Colleagues, the previous forecast remains essentially unchanged, and the target is still 6176, but I think the forecast can be updated because the price has been flat for quite some time.
I still expect the upward movement to continue in the large wave “1” and in the medium-order wave “5”.
A small
Nasdaq All-Time Highs, S&P Close, Blast Off or Breakdown?What an incredible melt-up since April 7 lows in the US markets.
Trump vs Musk - ignored
Iran vs Israel - ignored
High Valuations - ignored
FED Pausing - ignored
The US economy is resilient and it's a good thing because the world is performing really well (EX-US). Europe/China/India/Emerging Marke

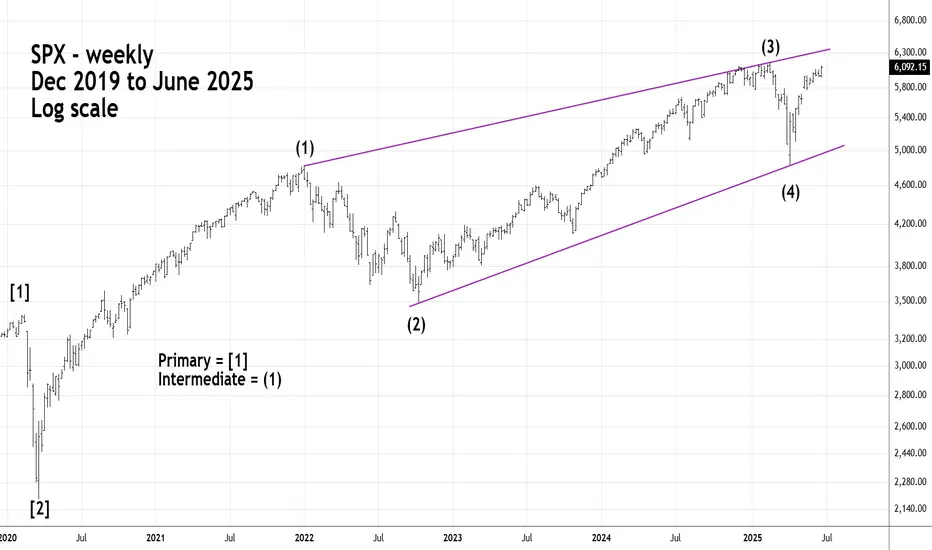
Long - Term S&P 500 - Elliott Imulse WaveThe S&P 500 - (SPX) could soon complete a five - year Elliott Impulse wave that began in March 2020.
Fibonacci resistance is in the SPX 6,200 area which could be reached on 06/26/25 or 06/27/25.
The market bias stays up, MJ stocks may be a buy here. The market continues to be biased up, and the target is likely the weekly B. MJ stocks are showing technical signs that a reversal may come. There may be other sectors similar as I think the summer bottom gamblers will start appearing now that everything else is at the highs. Gold looks like it will

S&P500 1D Golden Cross, middle of 3y Channel, much upside to go!The S&P500 index (SPX) has been trading within a Channel Up since the final sell-off of the 2022 Inflation Crisis. The only time this pattern broke was for 4 days during the bottom formation (April 2025) of the recent Trade War.
Ahead of the first 1D Golden Cross since January 26 2023, the market l

S&P500 and Nasdaq Short: Wave 5 <= Wave 3Based on the Elliott Wave rule that wave 3 is not the shortest wave, I gave a projection on where the peak of both S&P500 and Nasdaq could be. Based on these peaks, the stop is set above and the take profit target is where wave 4 was.

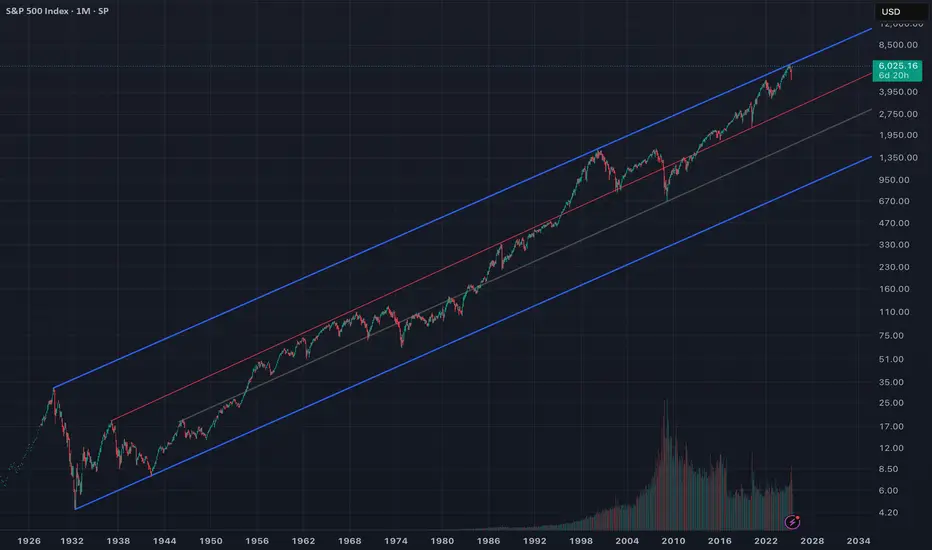
🇺🇸 America at the Crossroads: Golden Age or Great Reset? As the S&P 500 crosses 6,000 , investors celebrate yet another all-time high. But beneath the surface of this rally lies an uncomfortable truth: we are standing at a national and market inflection point.
This isn’t just another leg up. This is the top of a century-long trend channel, a moment wh
S&P 500 - Fibonacci Resistance Intermediate wave (5) up from the 04/07/25 bottom could be nearing completion.
Minor wave 5 of (5) is close to a Fibonacci relationship with Minor wave 1.
Using leeway around the 6,208 target gives a broad zone of 6,175 to 6,220. The SPX could reach this zone on 06/27/25.

See all ideas
Displays a symbol's price movements over previous years to identify recurring trends.
Frequently Asked Questions
US SPX 500 Index reached its highest quote on Jun 27, 2025 — 6,190.78 USD. See more data on the US SPX 500 Index chart.
The lowest ever quote of US SPX 500 Index is 1,347.90 USD. It was reached on Nov 15, 2012. See more data on the US SPX 500 Index chart.
US SPX 500 Index is just a number that lets you track performance of the instruments comprising the index, so you can't invest in it directly. But you can buy US SPX 500 Index futures or funds or invest in its components.