Volume Droughts and False Breakouts: Your Summer Trading TrapsThe market’s heating up — but is your breakout about to dry up? Here’s a word about the importance of summer trading success (helped by volume — the main character).
☀️ Welcome to the Liquidity Desert
Summer’s getting ready to slap the market with a whole flurry of different setups. Picture this — the beaches are full, your trading desk is half-abandoned, and the only thing more elusive than a decent breakout is your intention to actually read that big fat technical analysis book you bought last year.
And yet, here you are — eyes glued to the chart — watching a clean breakout above resistance that’s just begging for you to hit “buy.” Everything looks perfect. Price rips through the level like it’s made of butter. But there’s just one tiny problem: no volume. None. Nada. Niente.
Congratulations. You’ve just bought the world’s most attractive false breakout.
🏝️ Summer Markets: Where Good Setups Go to Die
Let’s set the scene.
It’s June. The big dogs on Wall Street are golfing in the Hamptons and sipping mezcal espresso martinis, interns are running the order flow, and every chart you love is doing just enough to get your hopes up before crushing them like a half-melted snow cone.
This isn’t your usual high-volatility playground. Summer markets — especially between June and August — are notorious for thin liquidity . That means fewer participants, smaller volume, and a much higher likelihood of being tricked by price action that looks strong… until it’s not.
And it’s not just stocks. Forex, crypto, commodities — even the bond boys — all face the same issue: when fewer people are trading, price becomes more fragile. And fragile price = bad decisions.
🚨 Why False Breakouts Love Quiet Markets
False breakouts happen when price appears to break above resistance (or below support), only to reverse sharply — often trapping late traders and triggering stop hunts.
But in summer? It’s a whole different beast. Here’s why:
No liquidity cushion : In normal markets, you need strong volume to fuel a breakout. Without that, the breakout doesn’t necessarily have the gas to keep going.
Market makers get bored : Thin markets mean it’s easier for a few big orders to push prices where they want. Welcome to manipulation season (there, we said what we said!).
Algos go wild : With fewer humans around, algorithms dominate. And they love playing games around key levels.
🧊 The Mirage Setup: A Cautionary Tale
Let’s say you’re watching GameStop NYSE:GME stock. Resistance at $30. Price hovers there for days, teasing a breakout. Then — boom — a sudden 6% pop above.
You buy. Everyone buys. The trading community goes nuts. “This is it bois!”
But there’s a problem. Look at the volume: a trickle. Not even half the average daily volume. Ten minutes later, NYSE:GME is back below $30, your stop loss is hit, and you’re left explaining to your cat why you’re emotionally invested in a ticker.
Moral of the story? Don’t trust breakouts when no one’s trading.
📉 Volume: Your Summer Lie Detector
Volume is more than just a histogram under your chart. It’s your truth serum. Your smoke alarm. Your buddy who tells you to think twice before jumping in that trade.
Here’s how to read it right when everyone else is checking out:
Confirm the move : If price breaks out, but volume doesn’t spike at least 20–30% above the average — be suspicious.
Look for acceleration : Healthy moves gather steam. You want to see volume growing into the breakout, not fizzling.
Watch for volume cliffs : A sudden volume drop right after a breakout often signals that the move is running on fumes.
Add Volume Profile Indicators : Just to be safe, you can always add Volume Profile Indicators to your chart — they analyze both price and volume and can highlight what your keen eye might miss.
Remember what happened last summer? And how we all learned the downside of something called "carry trade"? Those who were short the Japanese yen remember .
🧠 Context Over Candles: Be a Liquidity Detective
Let’s say you see a double top pattern — your favorite. Clean lines. Tight price action. Perfect setup.
But now zoom out.
It’s July 3. Pre-holiday half-day. No volume. And the S&P 500 SP:SPX has moved 0.04% all day. Still want in?
Technical analysis doesn’t work in a vacuum. Chart patterns lose their predictive power when the environment they live in is compromised. And thin liquidity is a compromised environment.
🐍 Snakes in the Sand: How Market Makers Bait Traps
Market makers (and large players) are like desert snakes — quiet, patient, and very good at making you move when you shouldn’t.
Here’s how they bait traders in illiquid markets:
Run stops above resistance to trigger breakout buyers.
Dump shares immediately after breakout to trap retail.
Ride the reversal as trapped longs scramble to exit.
They’re so powerful some say they run the game — and can stop it anytime it’s not going their way (remember the GameStop freeze? ) It’s a psychological game — and in the summer, it’s easier to do shenanigans because most players aren’t watching.
Don’t be the one jumping at shadows. Be the trader who expects the trap.
🛠️ How to Survive (and Thrive) in the Summer Slump
Not all is lost. You can still trade — smartly.
Here’s your Summer Survival Toolkit :
Wait for volume confirmation on every breakout.
Lower your position size . Less liquidity = more slippage risk.
Set wider stops , or better yet, sit out the chop.
Focus on trending names with relative strength and solid weight (think: tech titans, oil plays, or financials).
Use alerts instead of staring at charts . Don’t mistake boredom for opportunity.
And most importantly: Know when not to trade . Discipline is a position too.
🔚 Final Word: This Isn’t the Off-Season. It’s the Setup Season.
Summer might feel slow, but it’s not dead.
Smart traders know that the best trades of Q3 and Q4 often begin in July — as early trendlines form, consolidation patterns develop, and institutional footprints quietly appear in the tape.
So use this time wisely. Don’t force trades. Watch volume like a hawk. And never forget: the best breakouts don’t need hype — they bring their own thunder.
Stay cool, stay patient, and trade smart. The mirage may be tempting, but the oasis always belongs to the ones who go far enough and don’t give up.
Off to you : How are you navigating trading during the summer months? Staying poolside with one eye on the charts or actively seeking out opportunities while folks catch a break? Share your insights in the comments!
US500 trade ideas

Position Sizing 101: How Not to Blow Up Your Account OvernightWelcome to the trading equivalent of wearing a seatbelt. Not really exciting but entirely recommended for its lifesaving properties. When the market crashes into your stop-loss at 3:47 a.m., you’ll wish you’d taken this lesson seriously.
Let’s talk position sizing — the least flashy but most essential tool in your trading kit. This is your friendly reminder that no matter how perfect your chart setup looks, if you’re risking 50% of your capital on a single trade, you’re not trading. You’re gambling. And also — if you lose 50% of your account, you have to gain 100% to get even.
✋ “Sir, This Isn’t a Casino”
Let’s start with a story.
New trader. Fresh demo account turned real. He sees a clean breakout. He YOLOs half his account into Tesla ( TSLA ). "This is it," he thinks, "the trade that changes everything."
News flash: it did change everything — his $10,000 account turned into $2,147 in 48 hours.
The lesson? Position sizing isn’t just about managing capital. It’s about managing ego. Because the market doesn’t care how convinced you are.
🌊 Risk of Ruin: The More You Know
There’s a lovely concept in trading called “risk of ruin.” Sounds dramatic — and it is. It refers to the likelihood of your account going to zero if you keep trading the way you do.
If you risk 10% of your account on every trade, you only need to be wrong a few times in a row to go from “pro trader” to “Hey, ChatGPT, is trading a scam?”
Risking 1–2% per trade, however? Now we’re talking sustainability. Now you can be wrong ten times in a row and still live to click another chart.
🎯 The Math That Saves You
Let’s illustrate the equation:
Position size = Account size × % risk / (Entry – Stop Loss)
Example: $10,000 account, risking 1%, with a 50-point stop loss on a futures trade.
$10,000 × 0.01 = $100
$100 / 50 = 2 contracts
That’s it. No Fibonacci razzle-dazzle or astrology needed. Just basic arithmetic and a willingness to not be a hero.
🤔 The Myth of Conviction
Every trader has a moment where they say: “I know this is going to work.”
Spoiler alert: You don’t. And the moment you convince yourself otherwise, you start increasing position size based on emotion, not logic. That’s where accounts go to die.
Even the greats keep it tight. Paul Tudor Jones, the legend himself, once said: “Don't focus on making money; focus on protecting what you have.” Translation: size down, cowboy.
🔔 Position Size ≠ Trade Size
A common mistake: confusing position size with trade size.
Trade size is how big your order is. Position size is how much of your total capital is being risked. You could be trading 10 lots — but if your stop loss is tight, your position size might still be conservative.
So yes, trade big. But only if your risk is small. You’ll do better at this once you figure out how asymmetric risk reward works.
🌦️ Losses Happen. Don’t Let Them Compound
Let’s say you lose 5% on a trade. No big deal, right? Until you try to “make it back” by doubling down on the next one. And then again. And suddenly, you’re caught in a death spiral of revenge trading .
This is not theoretical. It’s Tuesday morning for many traders.
Proper position sizing cushions the blow. It turns what would be a catastrophe into a lesson — maybe even a mildly annoying Tuesday.
🌳 It’s Not Just About Risk — It’s About Freedom
Smart sizing gives you flexibility (and a good night’s sleep).
Want to hold through some noise? You can. Want to scale in? You’re allowed. Want to sleep at night without hugging your laptop? Welcome to emotional freedom.
Jesse Livermore, arguably the most successful trader of all time, said it best: “If you can’t sleep at night because of your stock market position, then you have gone too far. If this is the case, then sell your position down to the sleeping level.”
⛳ What the Pros Actually Do
Here’s a dirty little secret: pros rarely go all-in without handling the risk part first (that is, calibrating the position size).
If they’re not allocating small portions of capital across uncorrelated trades, they’ll go big on a trade that has an insanely-well controlled risk level. That way, if the trade turns against them, they’ll only lose what they can afford to lose and stay in the game.
Another great one, Stanley Druckenmiller, who operated one of the best-returning hedge funds (now a family office) said: “I believe the best way to manage risk is to be bullish when you have a compelling risk/reward.”
🏖️ The Summer of FOMO
Let’s address the seasonal vibes.
Summer’s here. Volume’s thin. Liquidity’s weird. Breakouts don’t follow through. Every false move looks like the real deal until it isn’t. And every poolside Instagram story from your trader friend makes you want to hit that buy button harder.
This is where position sizing saves you from yourself. Small trades, wide stops, chill mindset. Or big trades, tight stops, a bit of excitement in your day.
No matter what you choose, make sure to get your dose of daily news every morning, keep your eye on the economic calendar , and stay sharp on any upcoming earnings reports (GameStop NYSE:GME is right around the corner, delivering Tuesday).
☝️ Final Thoughts: The Indicator You Control
In a world of lagging indicators, misleading news headlines, and “experts” selling you dreams, position sizing is one of the few things you have total control over.
And that makes it powerful.
So next time you feel the rush — the urge to go big — take a breath. Remember the math. Remember the odds. And remember: the fastest way to blow up isn’t a bad trade — it’s a good trade sized wrong.
Off to you: How are you handling your trading positions? Are you the type to go all-in and then think about the downside? Or you’re the one to think about the risk first and then the reward? Let us know in the comments!

5821 target beaeish flowBeen awhile since I posted to spy channel.
Ive observed a negative flow, with a bearish apex on the 2hr futures chart. My target is 5820. Fail attempt to breakout above 600 on spy, this appears ro be a liquidity grab by smart moneym I will break chart down further into layers

S&P500 is Nearing an Important Support of 5,960!!!Hey Traders, in today's trading session we are monitoring US500 for a buying opportunity around 5,960 zone, US500 is trading in an uptrend and currently is in a correction phase in which it is approaching the trend at 5,960 support and resistance area.
Trade safe, Joe.

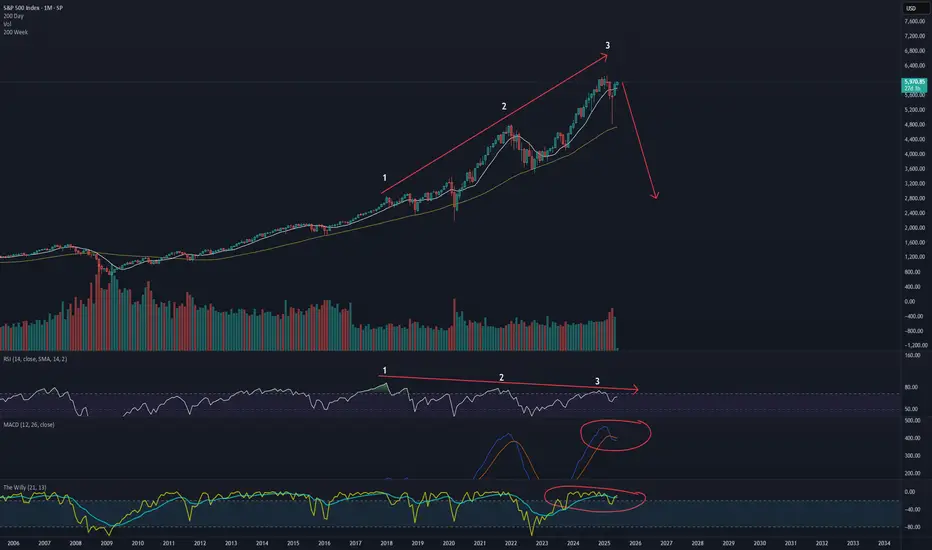
Hellena | SPX500 (4H): LONG resistance area of 6176.6.Colleagues, it appears that price has not yet completed the upward movement in a five-wave move.
At the moment I expect the continuation of wave “3” and reaching the target in the resistance area of 6176.6.
Manage your capital correctly and competently! Only enter trades based on reliable patterns!

You're all doomedEveryone has gone full bull again. The selloff is not over. The selloff is about to resume. The shorts are MIA. Down til Christmas. Starts this week.

S&P500 Giant Inverse Head and Shoulders waiting for its breakoutThe S&P500 index (SPX) appears to be forming the Right Shoulder of a long-term Inverse Head and Shoulders (IH&S), the pattern that made the April 07 bottom of the Tariff War correction.
Currently supported by both its 1D MA50 (blue trend-line) and 1D MA200 (orange trend-line), once the overhead Resistance/ neckline breaks, we expect a +24.55% rise to the 2.0 Fibonacci extension, the equivalent of the rise it made from the April bottom up until now.
The target given is 7400.
-------------------------------------------------------------------------------
** Please LIKE 👍, FOLLOW ✅, SHARE 🙌 and COMMENT ✍ if you enjoy this idea! Also share your ideas and charts in the comments section below! This is best way to keep it relevant, support us, keep the content here free and allow the idea to reach as many people as possible. **
-------------------------------------------------------------------------------
Disclosure: I am part of Trade Nation's Influencer program and receive a monthly fee for using their TradingView charts in my analysis.
💸💸💸💸💸💸
👇 👇 👇 👇 👇 👇

US500 Bullish Outlook US500 Bullish Outlook
US500 is well-positioned for another upward wave.
The price is forming a bullish triangle pattern, suggesting further gains if it breaks above the pattern or surpasses 5990.
Key upside targets are 6100 and 6240.
Investors are closely watching any new trade deal. If Trump rejects any deal or issues threats, the US500 could temporarily fall to 5930 before resuming its rise.
So far, the overall trend remains bullish, with no signs of reversal as long as key levels hold.
You may find more details in the chart!
Thank you and Good Luck!
❤️PS: Please support with a like or comment if you find this analysis useful for your trading day❤️

3 drives of bearish monthly divergence = bear market incoming"A bull market is like sex, it feels best just before it ends"
would like to draw attention to the bubble stocks and crypto right now, providing a definitive definition of mania.
The argument for a lost decade is in order.
The first decline in the spx will be aprox 55% to 2800, likely to recover its highs similar to how the market traded in the 1970's
$SPX $SPY /ES! Bearish divergence at 6000SP:SPX AMEX:SPY Bearish divergence at 6000
When we dropped to the 35EMA, which happens when we see a red signal line, then we bounced but with a bearish divergence.

SPX500 – Volatile Week Ahead as Trade Talks and CPI LoomSPX500 | Overview
Fundamental Insight:
S&P 500 futures edged lower early Monday as traders brace for a high-impact week.
Key events include:
- US-China trade talks in London (Monday)
- U.S. inflation data (CPI) expected midweek (Wednesday)
Markets are cautious, awaiting clarity from both geopolitical developments and macroeconomic indicators, which could trigger strong directional moves.
Technical Outlook:
The price appears to be entering a correction phase, with the potential to drop toward 5966.
A confirmed break below 5966 may extend the bearish trend toward 5938 and 5902.
However, a break above 6030 would invalidate the bearish scenario and could trigger a bullish continuation toward 6098 and potentially a new all-time high (ATH).
Pivot Line: 6010
Support Levels: 5966, 5938, 5902
Resistance Levels: 6030, 6098

All-Time Highs (3% Up) or US/China Trade Gap (4-5% Down)?It's summer time (1st week of June)
Brutally slow price action thus far, Non-Farm Payroll hits this Friday
Next week will be more US Inflation Date (CPI, PPI)
S&P and Nasdaq are only 3% (or slightly less) away from all-time highs
Melt-up momentum says it's the path of least resistance
US/China Trade Agreement Gap (that silly little Monday announcement) is 4-5% lower
Whatever we hit, there will be disappointed traders and investors - the ultimate pain trade :)
I'm not bearish, I'm ridiculously cautious as a bull and wanting to see a pullback. I can tell
because it's actually annoying watching the market grind so slow to the upside shrugging
off every bad news bite and sense of reality
The big beautiful tax bill is losing support (see Elon Musk's latest comments)
The Trump Administration has pivoted so hard the other way the market is virtually
ignoring tariff news now
Let price be your guide. I'm connecting the April 7 lows forward and if the bears cross it and price sweeps some lows, there might be some pullback potential in the cards
Plenty to watch - be patient - opportunities await. Not forcing anything for now and I'm
doing the "boring" stuff for income trading.
Thanks for watching!!!

S&P500 No signs of stopping here. Can hit 6900 before years end.The S&P500 index (SPX) has turned the 1W MA50 (blue trend-line) into Support, successfully testing it and holding and is now going for the All Time High Resistance test. Based on its 1W RSI structure and candle action, it resembles the previous times since 2023 that after a quick consolidation, it broke upwards again aggressively.
As you can see, both of those Bullish Legs that started on the 2023 Higher Lows trend-line, hit at least their 1.618 Fibonacci extension before a new 3-week red pull-back. In the case of 2024, even the 2.0 Fib ext got hit a little later.
As a result, we expect to see at least 6900 (Fib 1.618) before the end of 2025, with the good case scenario (Fib 2.0) going as high as 7500.
-------------------------------------------------------------------------------
** Please LIKE 👍, FOLLOW ✅, SHARE 🙌 and COMMENT ✍ if you enjoy this idea! Also share your ideas and charts in the comments section below! This is best way to keep it relevant, support us, keep the content here free and allow the idea to reach as many people as possible. **
-------------------------------------------------------------------------------
Disclosure: I am part of Trade Nation's Influencer program and receive a monthly fee for using their TradingView charts in my analysis.
💸💸💸💸💸💸
👇 👇 👇 👇 👇 👇

Skeptic | SPX 500 Analysis: Long Triggers Ready to Rip!Hey, what’s good? It’s Skeptic! 😎 Last week, we scored a nice R/R on SPX 500, and now it’s looking ready for another big move, super close to our long trigger. Let’s check it out with a multi-timeframe breakdown to grab those long and short triggers!
Daily Timeframe: The Big View
The SPX was riding a strong bullish wave, then hit a deep correction. Here’s what’s up:
It’s bounced back most of that drop and is nearing its ceiling at 6128.55. 🏔️
A break and hold above 6128.55 could kick the bullish trend into high gear, per Dow Theory.
Watch the daily RSI—if it goes overbought, we might see a fast, big rally. 🚀
This is our long-term play, so let’s zoom in for the short-term action!
4-Hour Timeframe: Long & Short Triggers
On the 4-hour chart, here’s the plan for our trades:
Long Trigger: Break above 5990.67, with RSI above 66.57 to show the move’s got juice.
Stop Loss: Your choice—put it below 5955.77, or check 1H or 15-minute charts for a tighter stop under the last low. 🎯
Short Trigger: A drop below 5856.93 lets you short, but it’s against the trend, so keep it low-risk. Take profits quick, use a small stop loss, and close when you hit a good R/R. ⚠️
Shorts are tricky here, so play it safe and don’t go all-in!
RSI Trick & Your Input
Love RSI? I’ve been using it forever, and I think most guides get it wrong. They say overbought RSI means sell, but for me, it’s a go sign for longs! Want a full RSI tutorial? Tell me in the comments, and I’ll hook you up! 📢
💬 Let’s Talk!
If this got you hyped, hit that boost—it helps a ton! 😊 Got another pair or setup you want me to hit? Drop it in the comments. Thanks for chilling with me—keep trading smart! ✌️

Another leg of bull market comingBeing bearish in the stock market—especially after such a big correction and a V-shaped recovery—is definitely not a good idea. Probability and past history are against you. If Trump succeeds in bringing more jobs by tarrifs and reduce government expending as he promises, it could easily keep the uptrend going for the next two years and push past the 10,000 level, just like 2018 and 2020

A Potentially Dangerous Pattern Takes ShapeWhile the futures market has yet to break into new all-time high territory, the previously discussed bearish micro setup has now been invalidated. In its place, we’re witnessing a complex, overlapping advance—creeping steadily toward the prior highs in the S&P 500 (ES).
At the micro level, I currently see no compelling bearish setup. However, this grinding upward move—lacking strong conviction from either buyers or sellers—is not necessarily bullish. In fact, it’s a hallmark of a potentially dangerous pattern: a primary degree ending diagonal.
If my interpretation is correct, both the “orange” and “purple” wave counts point to the same ominous conclusion. They suggest that what we're seeing could culminate in a sharp, possibly violent reversal—one that would ultimately retrace back to where this entire primary wave began. For reference, that’s just above 4,000, marked by the conclusion of Primary Wave 4 in October 2022.
This is the moment for caution—not after the damage is done.
Yes, we may push into new all-time highs. But within this fragile and overlapping structure, that outcome is far from guaranteed. Even if we get there, the looming question remains:
At what cost?

SPX is overheated, a correction is necessary📉 Market Update: No, It Has Nothing to Do with Trump
This move has nothing to do with Trump’s dramatic announcements. The reality is simple: the MACD on the daily chart is overheated, and a healthy correction is needed — likely down to the 5,520 level — before resuming the uptrend.
Now, does it surprise anyone that Trump acts like a PR agent for his investors? He always seems to drop “bad news” at the exact moment the charts call for a pullback. My guess? They're shorting right now.
🪙 Bitcoin Stalling
CRYPTOCAP:BTC is also losing momentum, and looks like it’s in need of a short-term correction as well. This suggests a week of consolidation ahead for the whole crypto market.
But let’s be clear:
🚀 The Bull Market Is Not Over
The weekly charts remain very bullish, and this trend could last another 4–6 months. The macro bullish structure for crypto remains intact.
However, in TradFi, there are cracks:
🔻 20-year bonds sold at 5.1% — a major recession red flag
💸 Tariffs are putting pressure on global trade
📉 The entire traditional market is starting to de-risk
🔮 What to Expect
Short-term correction to ~5,518 (first bottom target)
A possible rebound after healthy consolidation
A continued uptrend in crypto unless key support breaks
I’ll publish a new update when conditions change.
📌 Follow me to stay ahead of the market. And as always: DYOR.
#CryptoMarket #Bitcoin #MACD #TechnicalAnalysis #CryptoCorrection #BullishTrend #RecessionWarning #TradFi #Altcoins #BTC #MarketUpdate #TrumpEffect #DYOR

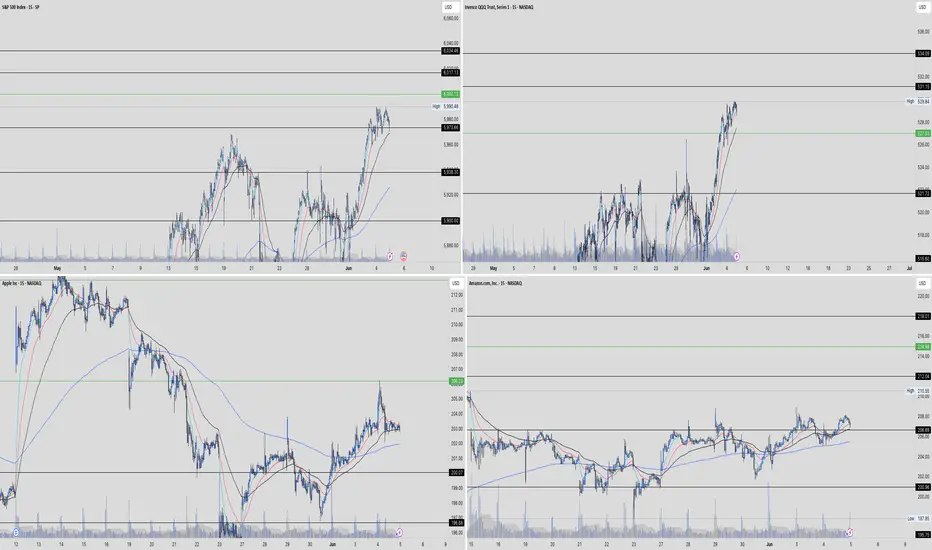
Andycharts, publishing key levels. We have key levels across 15 different charts which I am looking at tomoorow for contination,
SPX Key Levels to Watch Jun 4 In today’s analysis of the S&P 500 (SPX), we’ll break down the crucial levels to watch as we head into June 4th. After perfectly testing the 5929 level yesterday, the market bounced back, setting the stage for potential moves. We’ll discuss the new support range between 5954 and 5967 and what it means for traders. If this range holds, we might see a rally towards 6165, but if it falters, a drop to 5850 could be on the horizon. These levels are highly actionable, so stay sharp and ready to react!

S&P 500 Short Update: Ending DiagonalEnding diagonals completed. Stop above 6040. Take profit at 5744 first.

Elliott Wave Perspective: S&P 500 (SPX) Set to Finish Wave 3Since reaching its low on April 7, 2025, the S&P 500 (SPX) has embarked on an impulsive rally. From that bottom, the index progressed through distinct waves, as defined by Elliott Wave theory. Wave 1 concluded at 5246.57, followed by a corrective pullback in wave 2, which found support at 4910.42. Currently, wave 3 is underway, unfolding as a strong impulse with subdivisions in a lesser degree.
From the wave 2 low, the rally continued with wave ((i)) peaking at 5481.34. A brief retracement in wave ((ii)) then followed which ended at 5101.63. The index then surged higher in wave ((iii)), reaching 5968.61. A subsequent pullback in wave ((iv)) found support at 5767.41, setting the stage for further gains. The index should push to a few more highs to complete wave ((v)) of 3. This will mark the culmination of this upward phase.
Looking ahead, once wave 3 concludes, a corrective wave 4 should follow, retracing part of the rally from the April 7, 2025 low. This correction could unfold in a 3, 7, or 11-swing pattern before the index resumes its upward trajectory. In the near term, as long as the pivot low at 5765.74 holds, the S&P 500 is poised to achieve additional highs to finalize wave ((v)) of 3. However, if this critical support at 5765.74 is breached, it would signal the end of wave 3, prompting a larger wave 4 pullback, potentially in a 3, 7, or 11-swing structure.

Balance could break todaySPX may go higher but it could be a false break according to the RSI. Gold looks like it will go higher. USOIL is retreating from resistance so far. BTC still looks like it will drop.

SPX: chasing the 6KThe jobs data were in the spotlight of markets during the previous week. The Non-farm payrolls in May with 139K new jobs came as better than market anticipated, which supported the optimistic mood of investors. The S&P 500 managed to return to the levels modestly above the 6K level. Tech companies were again in the spotlight of investors. In this sense, the magnificent 7 drove the market to the higher grounds. In the Friday trading session, NVDA gained 1,2%, AMZN was up by 2,7%, while Tesla gained 3,7%. It should be noted that Tesla had quite a turbulent week. Its shares first dropped by 14% at the beginning of the week, after its CEO commented negatively on a current policy of the US President Trump. Certainly, this came as a surprise for markets, considering Musk's strong support for President Trump, both during the electoral campaign and his presidency.
Current optimism might be slowed down with forthcoming inflation data. Namely, a large number of economists are pointing to potential for the economic slowdown and higher inflation induced by implemented trade tariffs by the US Administration. In this sense, there is a probability that higher volatility of the index might continue in the coming period, as markets will try to understand what impact future growth and earnings will have on any new news on trade tariffs. It has been announced that further talks between China and US officials on trade tariffs will be held next week in London. This event will be closely monitored by investors.
