Volume Droughts and False Breakouts: Your Summer Trading TrapsThe market’s heating up — but is your breakout about to dry up? Here’s a word about the importance of summer trading success (helped by volume — the main character).
☀️ Welcome to the Liquidity Desert
Summer’s getting ready to slap the market with a whole flurry of different setups. Picture thi

S&P500 Giant Inverse Head and Shoulders waiting for its breakoutThe S&P500 index (SPX) appears to be forming the Right Shoulder of a long-term Inverse Head and Shoulders (IH&S), the pattern that made the April 07 bottom of the Tariff War correction.
Currently supported by both its 1D MA50 (blue trend-line) and 1D MA200 (orange trend-line), once the overhead Res

5821 target beaeish flowBeen awhile since I posted to spy channel.
Ive observed a negative flow, with a bearish apex on the 2hr futures chart. My target is 5820. Fail attempt to breakout above 600 on spy, this appears ro be a liquidity grab by smart moneym I will break chart down further into layers

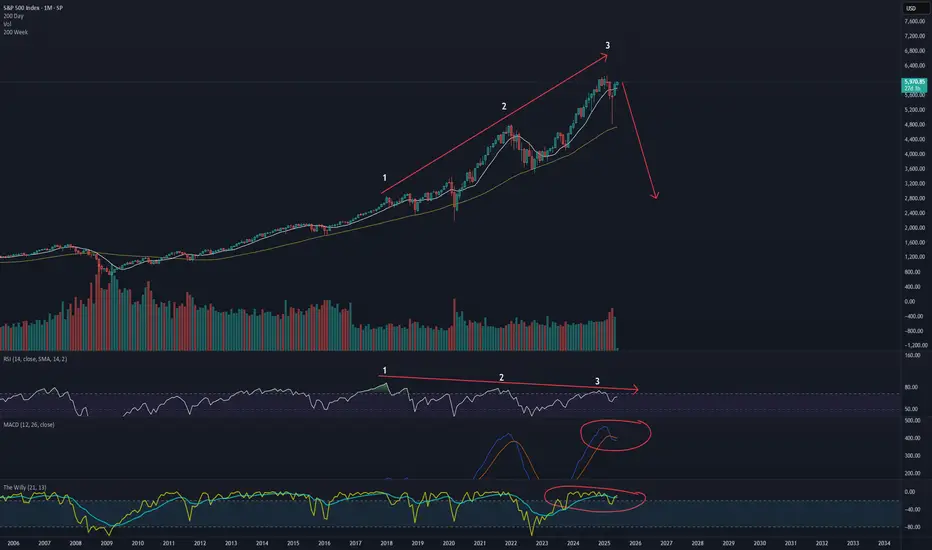
3 drives of bearish monthly divergence = bear market incoming"A bull market is like sex, it feels best just before it ends"
would like to draw attention to the bubble stocks and crypto right now, providing a definitive definition of mania.
The argument for a lost decade is in order.
The first decline in the spx will be aprox 55% to 2800, likely to recover
Hellena | SPX500 (4H): LONG resistance area of 6176.6.Colleagues, it appears that price has not yet completed the upward movement in a five-wave move.
At the moment I expect the continuation of wave “3” and reaching the target in the resistance area of 6176.6.
Manage your capital correctly and competently! Only enter trades based on reliable patterns!

You're all doomedEveryone has gone full bull again. The selloff is not over. The selloff is about to resume. The shorts are MIA. Down til Christmas. Starts this week.

S&P500 is Nearing an Important Support of 5,960!!!Hey Traders, in today's trading session we are monitoring US500 for a buying opportunity around 5,960 zone, US500 is trading in an uptrend and currently is in a correction phase in which it is approaching the trend at 5,960 support and resistance area.
Trade safe, Joe.

US500 Bullish Outlook US500 Bullish Outlook
US500 is well-positioned for another upward wave.
The price is forming a bullish triangle pattern, suggesting further gains if it breaks above the pattern or surpasses 5990.
Key upside targets are 6100 and 6240.
Investors are closely watching any new trade deal. If Tr

$SPX $SPY /ES! Bearish divergence at 6000SP:SPX AMEX:SPY Bearish divergence at 6000
When we dropped to the 35EMA, which happens when we see a red signal line, then we bounced but with a bearish divergence.

SPX500 – Volatile Week Ahead as Trade Talks and CPI LoomSPX500 | Overview
Fundamental Insight:
S&P 500 futures edged lower early Monday as traders brace for a high-impact week.
Key events include:
- US-China trade talks in London (Monday)
- U.S. inflation data (CPI) expected midweek (Wednesday)
Markets are cautious, awaiting clarity from both geopoliti

See all ideas
Displays a symbol's price movements over previous years to identify recurring trends.
Frequently Asked Questions
SPX500 reached its highest quote on Feb 19, 2025 — 6,147.47 USD. See more data on the SPX500 chart.
The lowest ever quote of SPX500 is 1,922.62 USD. It was reached on Mar 1, 2016. See more data on the SPX500 chart.
SPX500 is just a number that lets you track performance of the instruments comprising the index, so you can't invest in it directly. But you can buy SPX500 futures or funds or invest in its components.