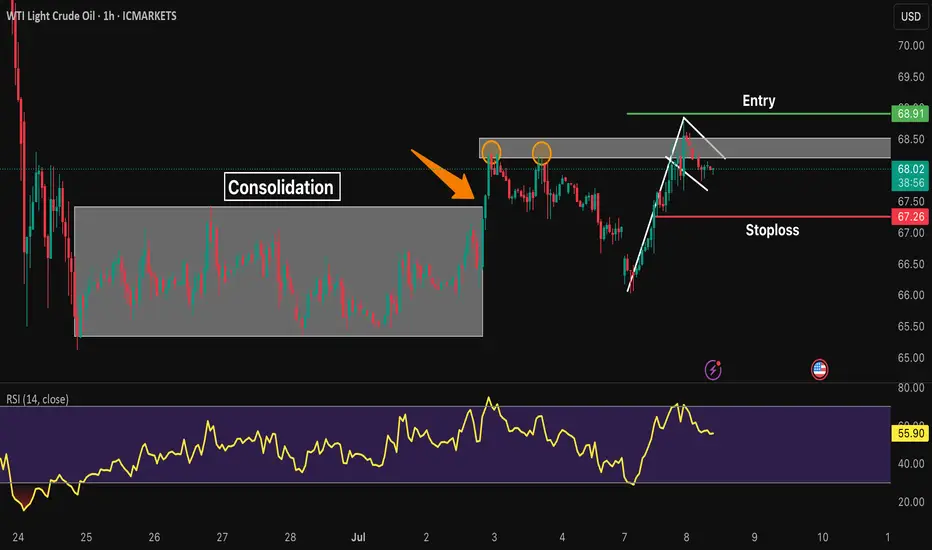
XTIUSD* Bullish Trend after consolidation box break.
* Bullish flag pattern is formed.
* Entry will be taken at the break of the pole.
* Stoploss is below the last HL.
CRUDE OIL (WTI): Will It Rise More?
Quick update for my yesterday's analysis for WTI Crude Oil.
As I predicted yesterday, the price went up to the target.
We got one more strong bullish confirmation after a New York
session opening:
the price violated a resistance of a horizontal range on a 4H time frame.
I think that the market

USOIL - Bearish Double TOPHello Traders !
The USOIL failed to create a new higher high.
The price formed a double top pattern.
Currently, The neckline is broken !
So, I expect a bearish move📉
________________
TARGET: 64.970🎯

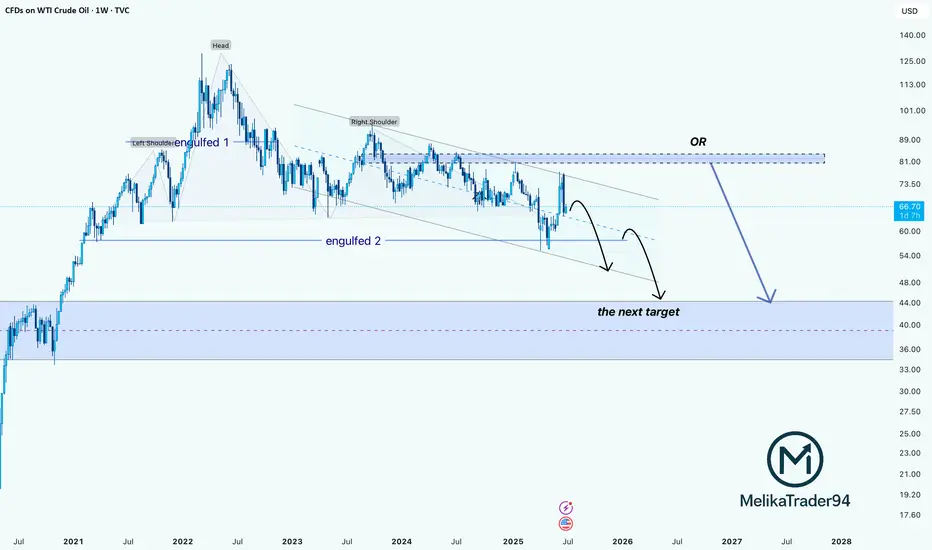
WTI Crude Oil: Double Engulf + H&S Breakdown Points to $40Hello guys! Let's dive into WTI!
The weekly chart of WTI Crude Oil reveals a bearish Head & Shoulders pattern playing out over a long-term descending channel. Price recently got rejected from the upper trendline, showing weakness despite a short-term bounce.
- Engulfed 1 & 2:
Two major engulfin
Strong USOIL Setup: Long from Support + 4.34 R/RHey Guys, hope you're all doing well!
I've placed a limit buy order on USOIL from a key support level. Below are the relevant levels for your reference:
- 🔵 Entry Level: 67.424
- 🔴 Stop Loss: 66.803
- 🟢 Target 1 (TP1): 67.908
- 🟢 Target 2 (TP2): 68.456
- 🟢 Target 3 (TP3): 70.036
📊 Risk/Reward R

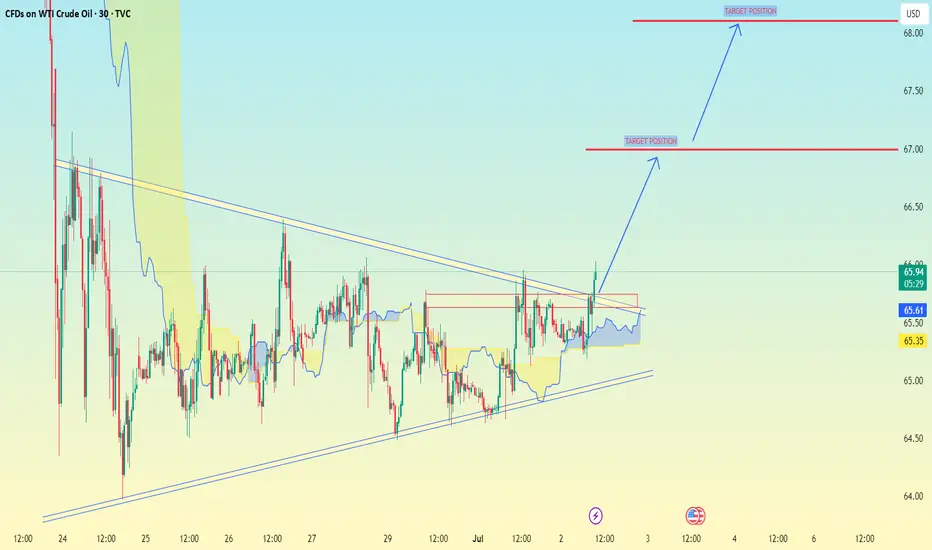
(WTI Crude Oil) on the 30-minute timeframe:(WTI Crude Oil) on the 30-minute timeframe:
You have a clear triangle breakout happening.
The chart shows two bullish target positions marked with blue arrows.
Based on your chart:
Current Price Zone: Around 66.20 - 66.25
Target Levels:
✅ First Target: 67.00
✅ Second Target: 68.00 - 68.10
-
USOIL - Bearish Double TOPHello Traders !
The USOIL failed to create a new higher high!
The price formed a double top pattern.
Currently, The neckline is broken !
So, I expect a bearish move📉
________________
TARGET: 64.960🎯

USOIL: Historic Full CyclesResearch Notes
Documenting historic examples of fractal loops for future references and research.
Fractal full cycles
70's; 80's; 90's
Late 90's & Early 00's
00's
10's
10's & 20's

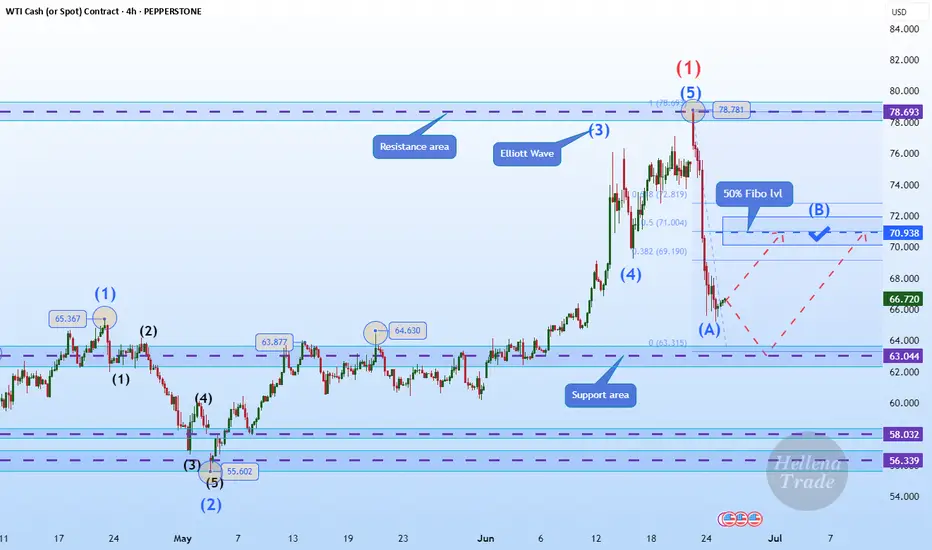
Hellena | Oil (4H): LONG to 50% lvl Fibo area of 70.00.Colleagues, after a long break, I think it is worth returning to oil forecasts. The situation is stabilizing a bit and now I think that the price is in a strong correction (ABC) at the moment I see wave “B”, which may reach the area of 50% Fibonacci 70 level.
It is possible that wave “A” will conti
US Oil - July WK#2 ExpectationsNYSE:TVC :
USOIL Last trade close @ $66.5.
Expected to start the week @ $68.xx.
The formation of cup & handle shape lead to continuous increase to start hitting 1st Target @ $70.
Trump will announce Tariffs implementation will support increasing prices.

See all ideas
Displays a symbol's price movements over previous years to identify recurring trends.