US500, XAUUSD & XTIUSD Daily Trade SetupsIn this update, we review the recent price action in the US500, XAUUSD & XTIUSD and identify the next high probability trading opportunity and price objectives to target. To review today's video analysis, click here.
USCRUDEOILCFD trade ideas

OIL PULLBACK 58-59 Then go up to 75-80OIL PULLBACK 58-59 Then go up to 75-80. Buy limit 58-59 sl 56.5 tp75-80

US OilCrude Oil
- Falling Wedge as an corrective pattern in Short Time Frame
- Break of Structure
- S / R Level
- Completed " 12345 " Impulsive Waves and " A " Corrective Waves
- Demand Zone

Long WTIUS10Y yield (white) and WTI typically trade in lockstep, but have recently diverged with US10Y rebounding while WTI has continued to observe selling pressure.
Expecting divergence to narrow, with WTI moving higher off recent lows. Entering long positions on WTI contracts.

US OIL SHORT RESULT Crude oil price action moved exactly in our Prediction and even Better.
Currently the price is in a new Bullish trend due to the FOMC news, but we'll watch it to see if it holds and it's authenticity before Opening new trades to ensure it's not just hype or manipulation.

OIL TO PUMP UPOil has broken the downtrend and turned bullish. Tump's Iran threads is also likely to accelerate the bullish push faster.
Risk no more than one per cent.
Swing trade so expect to hold it for weeks
Once trade over 200 pips in profit, set breakeven
Follow us for more perfect swing setups

WTI OIL Buy opportunity or more meltdown coming?WTI Oil (USOIL) has been trading within a long-term Channel Down since the September 25 2023 High and the recent Trade War sell-off helped the price drop towards the pattern's bottom (Lower Lows trend-line) much quicker.
Technically this has been a 1W MA50 (blue trend-line) rejection, previously a Lower High rejection on the 1W MA200 (orange trend-line). Notice how the 1W RSI has also been trading within a Channel Down of its own, with the indicator near its bottom as well.
Being more than -31% down (more than the -29% of the first Bearish Leg), we can technically claim that this is a solid level for a medium-term buy again. The previous Bullish Leg marginally exceeded the 0.618 Fibonacci retracement level before the Lower High. As a result, our new Target is $70.00.
-------------------------------------------------------------------------------
** Please LIKE 👍, FOLLOW ✅, SHARE 🙌 and COMMENT ✍ if you enjoy this idea! Also share your ideas and charts in the comments section below! This is best way to keep it relevant, support us, keep the content here free and allow the idea to reach as many people as possible. **
-------------------------------------------------------------------------------
Disclosure: I am part of Trade Nation's Influencer program and receive a monthly fee for using their TradingView charts in my analysis.
💸💸💸💸💸💸
👇 👇 👇 👇 👇 👇

bearsTechnically going to check the London sessions bottom.Commercial crude oil stocks excluding the Strategic Petroleum Reserve rose by 2.6 million barrels to 442.3 million barrels in the week ended April 4, and were about 5% below the five-year average for the time of year, the EIA said. Analysts surveyed by The Wall Street Journal had predicted crude stockpiles would rise by 2.1 million barrels.

CRUDE OIL (WTI): Important Support Clusters to Watch
On a today's live stream, we discussed potentially significant
historic supports on WTI Crude Oil to watch.
Support 1: 57.0 - 59.0 area
Support 2: 52.5 - 54.6 area
Support 3: 48.8 - 50.4 area
Support 4: 40.6 - 43.7 area
The price is currently testing a lower boundary of Support 1.
It perfectly matches with a completion point of a harmonic ABCD pattern.
It looks like we may see some pullback soon.
❤️Please, support my work with like, thank you!❤️

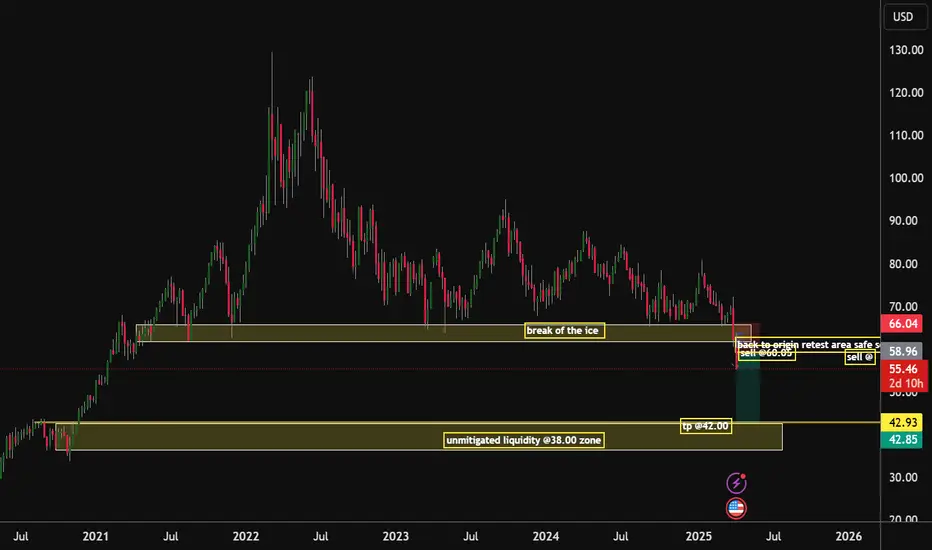
Bears to scoop the Oil all the way to the 42.00 zone U.S. oil prices have extended their losses this Wednesday, plunging by more than 6% after China just announced it has raised tariff trade duty on goods from the United States from 34% to 84% starting 10th April in response to US President Donald Trump's tariffs, including a cumulative levy rate of 104% on Chinese imports. Traders are now remaining wary of investing amid United States President Donald Trump's tariffs on other countries and specific imports, despite the continued turmoil in the Middle East,
That being said I'm with the bears on this one
sell @after retest @60.00
1st Tp @42.00
WTI Crude Oil selling pressure continuationWTI Crude Oil is showing bearish sentiment, in line with the current downtrend. Recent price action confirms a break below a key consolidation zone, adding pressure to the downside.
Key Levels:
Resistance: 6065 (former support, now resistance), 6307, 6400
Support: 5480, 5336, 5200
Bearish Outlook:
Price has broken below 6065, which was a key intraday consolidation level. If WTI sees a short-term bounce but fails to break above 6065, it could resume its downward move toward 5480, then 5336, and possibly 5200 over time.
Bullish Scenario:
If WTI breaks above 6065 and closes above it on the daily chart, the bearish setup would be invalidated. This could open the door for a rally toward 6307, then 6400.
Conclusion:
The trend remains bearish below 6065. A rejection at this level would reinforce the downside bias. However, a confirmed break and daily close above 6065 would shift the outlook to bullish in the short term.
This communication is for informational purposes only and should not be viewed as any form of recommendation as to a particular course of action or as investment advice. It is not intended as an offer or solicitation for the purchase or sale of any financial instrument or as an official confirmation of any transaction. Opinions, estimates and assumptions expressed herein are made as of the date of this communication and are subject to change without notice. This communication has been prepared based upon information, including market prices, data and other information, believed to be reliable; however, Trade Nation does not warrant its completeness or accuracy. All market prices and market data contained in or attached to this communication are indicative and subject to change without notice.

Crude oil is in big trouble...no quarterly closes below 67$
THIS MUST HOLD
recession 2001
recession 2008
recession?

Oil holds below $60: demand likely down, supply upSince the announcement of higher than expected new American tariffs, especially on China, oil’s decline has been dramatic. The very high tariffs on China are important because China is the largest importer of oil, so economic headwinds there usually have a significant effect on demand. OPEC+ decided last week to increase supply next month.
4 April was American light oil’s lowest weekly close since August 2021, so it’s difficult to estimate the next potential support. The 78.6% monthly Fibonacci retracement is around $40, but even in the circumstances that’s a very long way from where the price is now. The unusual strength of the oversold signal and the size of recent candlesticks call into question whether the price might continue immediately lower unless significant fresh trade news reaches markets.
Equally, buying oil now looks like trying to ‘catch the knife’. Fundamentals are quite strongly negative and 7 April’s failed bounce suggests that demand is likely to remain low for some time unless there’s another round of strong losses or the tone of the news changes. Short-term trading of retracements seems to be the least bad option now.
This is my personal opinion, not the opinion of Exness. This is not a recommendation to trade.

USOIL SENDS CLEAR BULLISH SIGNALS|LONG
USOIL SIGNAL
Trade Direction: long
Entry Level: 57.67
Target Level: 66.44
Stop Loss: 51.82
RISK PROFILE
Risk level: medium
Suggested risk: 1%
Timeframe: 12h
Disclosure: I am part of Trade Nation's Influencer program and receive a monthly fee for using their TradingView charts in my analysis.
✅LIKE AND COMMENT MY IDEAS✅

USOILUSOIL will continue to drop,the geopolitical tension and china trade war will shift demand to black market where oil is discounted ,usoil will experience poor demand pushing for lower price ,

WTI Oil H4 | Heading into a pullback resistanceWTI oil (USOIL) is rising towards a pullback resistance and could potentially reverse off this level to drop lower.
Sell entry is at 59.51 which is a pullback resistance that aligns with the 38.2% Fibonacci retracement.
Stop loss is at 61.95 which is a level that sits above the 61.8% Fibonacci retracement and an overlap resistance.
Take profit is at 53.41 which is a support level that aligns with the 78.6% Fibonacci projection.
High Risk Investment Warning
Trading Forex/CFDs on margin carries a high level of risk and may not be suitable for all investors. Leverage can work against you.
Stratos Markets Limited (tradu.com):
CFDs are complex instruments and come with a high risk of losing money rapidly due to leverage. 63% of retail investor accounts lose money when trading CFDs with this provider. You should consider whether you understand how CFDs work and whether you can afford to take the high risk of losing your money.
Stratos Europe Ltd (tradu.com):
CFDs are complex instruments and come with a high risk of losing money rapidly due to leverage. 63% of retail investor accounts lose money when trading CFDs with this provider. You should consider whether you understand how CFDs work and whether you can afford to take the high risk of losing your money.
Stratos Global LLC (tradu.com):
Losses can exceed deposits.
Please be advised that the information presented on TradingView is provided to Tradu (‘Company’, ‘we’) by a third-party provider (‘TFA Global Pte Ltd’). Please be reminded that you are solely responsible for the trading decisions on your account. There is a very high degree of risk involved in trading. Any information and/or content is intended entirely for research, educational and informational purposes only and does not constitute investment or consultation advice or investment strategy. The information is not tailored to the investment needs of any specific person and therefore does not involve a consideration of any of the investment objectives, financial situation or needs of any viewer that may receive it. Kindly also note that past performance is not a reliable indicator of future results. Actual results may differ materially from those anticipated in forward-looking or past performance statements. We assume no liability as to the accuracy or completeness of any of the information and/or content provided herein and the Company cannot be held responsible for any omission, mistake nor for any loss or damage including without limitation to any loss of profit which may arise from reliance on any information supplied by TFA Global Pte Ltd.
The speaker(s) is neither an employee, agent nor representative of Tradu and is therefore acting independently. The opinions given are their own, constitute general market commentary, and do not constitute the opinion or advice of Tradu or any form of personal or investment advice. Tradu neither endorses nor guarantees offerings of third-party speakers, nor is Tradu responsible for the content, veracity or opinions of third-party speakers, presenters or participants.

Light Crudeoil hourly trend analysis on April 09, 2025Light Crude oil has given a short signal at 69.855 with a stop loss above 79.885. The bearishness will continue with a support at 55.005.

USOIL Long Setup: Targeting $69 – Bullish Momentum in PlayUSOIL Long Setup Analysis: Targeting $69 with Bullish Momentum
Technical Analysis: The current price action shows USOIL trading at $70.51, demonstrating a recovery from a key liquidity pool zone. Technical indicators support this bullish outlook, with the 50-day SMA at 69.34 and 200-day EMA at 69.32, creating a strong foundation for upward momentum. The RSI reading of 57.82 indicates growing bullish momentum without being overbought, suggesting room for further upside. The ATR value of 0.29257 shows significant volatility, which could facilitate quick price movements toward our target.
Fundamental Drivers: Several fundamental factors support this bullish setup:
Geopolitical tensions in the Middle East are creating potential supply disruption concerns, which supports higher prices in the near term.
OPEC+ production cuts are maintained through December, providing a floor for prices and supporting the bullish case. This supply constraint helps maintain price stability and potential upward pressure.
The EIA's Short Term Energy Outlook projects tighter market conditions, with prices expected to average $75 per barrel in the third quarter of 2025, supporting our bullish thesis.
Sentiment Analysis: Market sentiment indicators provide additional confirmation:
Institutional positioning through COT reports shows significant activity from large speculators and hedge funds, indicating strong institutional interest in the market.
Analysts maintain a bullish outlook, forecasting Brent crude to average $80 per barrel in Q4 2024, suggesting broader market confidence in higher prices.
The combination of technical indicators and fundamental factors has created a positive sentiment environment, supported by institutional outlooks derived from market reports.
Price Target Rationale: The $69 target is well-supported by:
Technical support from the 50-day SMA (69.34) and 200-day EMA (69.32)
EIA's forecast of $68 per barrel, providing a fundamental basis
The current price action showing recovery from support levels with increasing momentum
Market structure suggesting potential for continued upward movement
Risk Considerations:Monitor potential market surplus projected for early 2025
Watch for changes in OPEC+ compliance with production cuts
Keep track of geopolitical developments that could impact price volatility
Consider the impact of China's economic recovery on demand dynamics
This setup provides a balanced risk-reward opportunity, supported by technical, fundamental, and sentiment factors, with clear support levels and upside potential aligned with major forecasts.

WTI Wave Analysis – 8 April 2025
- WTI broke the long-term support zone
- Likely to fall to support level 55.00
WTI crude oil recently broke the long-term support zone set between the support levels 60.00 and 65.00. This support zone has stopped all downward corrections from the middle of 2021.
The breakout of this support zone accelerated the active downward impulse wave 3, which belongs to the intermediate impulse wave (3) from the start of 2024.
Given the strong downtrend seen on the weekly WTI charts, WTI crude oil can be expected to fall to the next support level 55.00, the target price for the completion of the active impulse wave (3).

WTI Continues Sharp Decline and Enters Oversold TerritoryOver the past five trading sessions, oil prices have dropped more than 17% , with WTI crude falling below the $60 per barrel mark. This move reflects ongoing market uncertainty, as investors expect the new trade war to significantly weaken oil demand in the coming months. As long as confidence remains in a fragile zone, downward pressure on oil prices is likely to persist.
Break of the Sideways Channel
In recent weeks, a key sideways channel that had held since November 2023 has been broken. This shift could alter the neutral outlook that has dominated the oil market in the long term and now points toward seller dominance. As price movements stabilize, a stronger bearish trend may begin to develop in the short term.
Oversold Conditions Appear
RSI: The RSI line is currently holding below the 30 level, which signals oversold conditions on the indicator. This suggests that while bearish pressure has been dominant, the market may be entering an early stage of exhaustion, potentially opening the door for short-term bullish corrections.
Bollinger Bands: The price has completely broken through the lower Bollinger Band, indicating that it has moved beyond two standard deviations from the mean. This reflects high volatility and could signal a pause in selling momentum. In turn, it may lead to potential rebound zones forming soon.
Key Levels:
$58 – Near Support: This is the most important short-term barrier, aligning with multi-year lows not seen since 2021. Continued selling below this level could reinforce the current bearish bias.
$66 – Near Resistance: This level marks the lower boundary of the former sideways channel. It may act as a potential zone for bullish corrections in the short term.
$73 – Distant Resistance: This level aligns with the 200-period moving average. Price action approaching this area could reactivate the previously abandoned uptrend.
By Julian Pineda, CFA – Market Analyst

USOIL ChatGPT: Chart Analysis for WTI Crude Oil (1-Hour Timeframe) – April 08, 2025
Key Observations:
1. Trend and Price Action:
- WTI Crude Oil has been trading in a range-bound pattern, as shown by the blue trendlines. The price has been bouncing between the resistance and support levels. Currently, the price is at the lower end of this range near the support level around 58.88.
- The resistance level is at 59.05, and this has been tested multiple times without a sustained breakout, indicating that sellers have been in control around this level.
- The price just tested the support level and bounced slightly higher, which suggests the market may be consolidating before deciding the next move.
2. Order Block and FVG (Fair Value Gap):
- The order block is located…
ChatGPT: - Fair Value Gap (FVG) has been formed around the order block. This means there’s an imbalance in the market that could eventually be filled. Traders should watch for price action near this gap for further insight into whether the gap will be filled or left untested.
3. Volume:
- Volume is relatively low, which suggests a lack of strong momentum in the market. This is typical in range-bound markets, where buying and selling activity are often balanced.
- However, the volume has spiked during the downward move, which could indicate a potential bearish continuation if the price breaks below 58.88.
4. Bearish Setup and Target:
- The chart is showing a bearish setup with the price trading below the resistance zone, and it is testing the support level near

Trump vs. ChinaDonald Trump’s recent actions show strong similarities to key moments in history. His push for high tariffs on imports reminds us of the 1930 Smoot-Hawley Tariff Act, which aimed to protect American jobs but ended up hurting the economy when other countries struck back with their own tariffs. Today, we’re seeing the same pattern, Trump’s tariffs on China, the EU, and others have already led to retaliation, and experts warn this could lead to inflation or even a recession. His tough stance on immigration also echoes early 20th century laws like the Immigration Act of 1924, which restricted immigrants to preserve a so called “American identity.” Even his populist, anti elite tone reminds many of President Andrew Jackson, who presented himself as a voice for the common man while shaking up the political system.
On the home front and globally, Trump’s moves also reflect a shift toward isolation similar to what the U.S. tried after World War I. Back then, the U.S. pulled away from global cooperation, and it didn’t work out well. Now, Trump is cutting foreign aid and pulling out of major global agreements like the Paris Climate Accord and the WHO, which could weaken America’s role on the world stage. Domestically, his push to revive coal and cut diversity programs feels like turning back the clock on social and environmental progress. History has shown us that these kinds of decisions often have long term consequences. As the saying goes, history tends to repeat itself and if we don’t learn from it, we may find ourselves repeating the same costly mistakes.

USOIL CATCHING THE FALLING KNIFE|LONG|
✅CRUDE OIL lost 18% of it's
Value in the last 5 days on the
Trade war news, which makes
The market to expect a recession
And a sharp drop in the oil demand
However, I still think that Oil
Is locally oversold, therefore
A local bullish correction is
To be expected from the
Horizontal support below
Around 57.34$ and the
Target being the resistance
Above around 61.81$
LONG🚀
✅Like and subscribe to never miss a new idea!✅
Disclosure: I am part of Trade Nation's Influencer program and receive a monthly fee for using their TradingView charts in my analysis.
