USDCAD I Weekly CLS I Model 1 I Targe 50% CLSYo Market Warriors ⚔️
Fresh outlook drop — if you’ve been riding with me, you already know:
🎯My system is 100% mechanical. No emotions. No trend lines. No subjective guessing. Just precision, structure, and sniper entries.
🧠 What’s CLS?
It’s the real smart money. The invisible hand behind $7T/d
About U.S. Dollar / Canadian Dollar
The US Dollar vs. the Canadian Dollar is a very popular currency pair due to the extremely large amount of cross border trading that occurs between the U.S. and Canada. The CAD is considered to be a commodity currency because of the large amount of natural resources, especially oil, that are mined and exported to southern neighbors. The USDCAD is one of the most traded currency pairs in the world.
Related currencies

USD/CAD) Down Trand Read The captionSMC trading point update
Technical analysis of USD/CAD (U.S. Dollar / Canadian Dollar) on the 1-hour timeframe, with a focus on a potential double-top formation at strong resistance, followed by a drop toward support:
---
Analysis Overview
Trend Structure: Downward-sloping channel with low

USDCAD I Weekly CLS I Model 1 I KL - OB I Target CLS LowYo Market Warriors ⚔️
BIG SHORT — if you’ve been riding with me, you already know:
🎯My system is 100% mechanical. No emotions. No trend lines. No subjective guessing. Just precision, structure, and sniper entries.
🧠 What’s CLS?
It’s the real smart money. The invisible hand behind $7T/day — bank

USDCAD Potential DownsidesHey Traders, in today's trading session we are monitoring USDCAD for a selling opportunity around 1.36900 zone, USDCAD is trading in a downtrend and currently is in a correction phase in which it is approaching the trend at 1.36900 support and resistance area.
Trade safe, Joe.

The importance of trendlines in FOREXIn the world of currencies or FOREX, there are certain entry points that only happen a few times a year , but they’re incredibly powerful . These opportunities come after a trend breaks, a trend that has been touched and confirmed as a support or resistance zone over several years.
Right now, wit

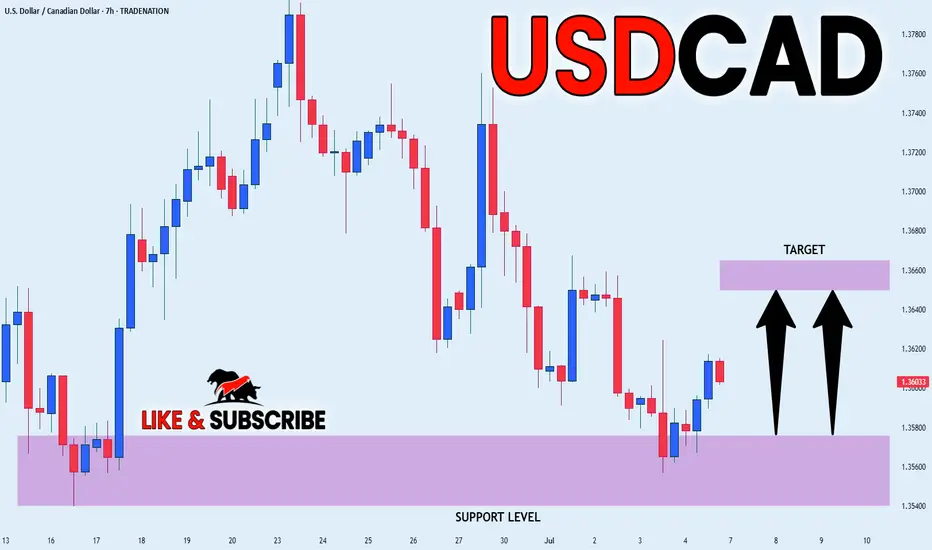
USD_CAD POTENTIAL LONG|
✅USD_CAD went down to retest
A horizontal support of 1.3560
Which makes me locally bullish biased
And I think that a move up
From the level is to be expected
Towards the target above at 1.3652
LONG🚀
✅Like and subscribe to never miss a new idea!✅
Disclosure: I am part of Trade Nation's
USD /CAD) bearish reversal analysis Read The captionSMC trading point update
Technical analysis of USD/CAD pair on the 2-hour timeframe, suggesting that the price is likely to drop toward the support zone. Here's the detailed idea behind the analysis:
---
Chart Breakdown (2H – USD/CAD)
1. Resistance Zone (Yellow Box - Top):
Marked as a st

USDCAD Potential UpsidesHey Traders, in tomorrow's trading session we are monitoring USDCAD for a buying opportunity around 1.35750 zone, USDCAD is trading in an uptrend and currently is in a correction phase in which it is approaching the trend at 1.35750 support and resistance area.
Trade safe, Joe.

USD/CADIt is very amazing chart 1h frame
Entry point 1.3600
stop loss below 1.39450 (93.4 point)
T1 1.39232 (325 Point)
T2 1.40417 (443 Point)
T3 141600 (558 Point)

USDCAD MARKET OUTLOOK📊 USDCAD Institutional Market Outlook
🔷 Monthly & Weekly Structure – Bearish Bias
A Monthly Fair Value Gap (FVG) was formed after a breakaway gap, closing all prior bullish FVGs. This signals strong bearish intent from institutions, with a likely draw toward the next key liquidity level at 1.34210.

See all ideas
Summarizing what the indicators are suggesting.
Oscillators
Neutral
SellBuy
Strong sellStrong buy
Strong sellSellNeutralBuyStrong buy
Oscillators
Neutral
SellBuy
Strong sellStrong buy
Strong sellSellNeutralBuyStrong buy
Summary
Neutral
SellBuy
Strong sellStrong buy
Strong sellSellNeutralBuyStrong buy
Summary
Neutral
SellBuy
Strong sellStrong buy
Strong sellSellNeutralBuyStrong buy
Summary
Neutral
SellBuy
Strong sellStrong buy
Strong sellSellNeutralBuyStrong buy
Moving Averages
Neutral
SellBuy
Strong sellStrong buy
Strong sellSellNeutralBuyStrong buy
Moving Averages
Neutral
SellBuy
Strong sellStrong buy
Strong sellSellNeutralBuyStrong buy
Displays a symbol's price movements over previous years to identify recurring trends.
Frequently Asked Questions
The current rate of USDCAD is 1.36873 CAD — it has increased by 0.23% in the past 24 hours. See more of USDCAD rate dynamics on the detailed chart.
The value of the USDCAD pair is quoted as 1 USD per x CAD. For example, if the pair is trading at 1.50, it means it takes 1.5 CAD to buy 1 USD.
The term volatility describes the risk related to the changes in an asset's value. USDCAD has the volatility rating of 0.58%. Track all currencies' changes with our live Forex Heatmap and prepare for markets volatility.
The USDCAD showed a 0.78% rise over the past week, the month change is a 0.16% rise, and over the last year it has increased by 0.52%. Track live rate changes on the USDCAD chart.
Learn how you can make money on rate changes in numerous trading ideas created by our community.
Learn how you can make money on rate changes in numerous trading ideas created by our community.
USDCAD is a major currency pair, i.e. a popular currency paired with USD.
Currencies are usually traded through forex brokers — choose the one that suits your needs and go ahead. You can trade USDCAD right from TradingView charts — just log in to you broker account. Check out the list of our integrated brokers and find the best one for your needs and strategy.
When deciding to buy or sell currency one should keep in mind many factors including current geopolitical situation, interest rates, and other. But before plunging into a deep research, you can start with USDCAD technical analysis. The technical rating for the pair is neutral today, but don't forget that markets can be very unstable, so don't stop here. According to our 1 week rating the USDCAD shows the sell signal, and 1 month rating is neutral. See more of USDCAD technicals for a more comprehensive analysis.