USDZAR-BUY strategy 3 Hourly chart Reg. ChannelThe pair is still under pressure, and certainly not out of negative territory. I suspect we may test down side further, especially we have moved below 17.8750 area. The channel support is 17.60s and near that level would start considering BUY entry. The indicators are slightly positive, so if one is
About U.S. Dollar / South African Rand
The U.S. Dollar vs. the South African Rand. The Rand was and became legal tender in the late 50’s to early 60’s for South Africa, Swaziland, Lesotho and Namibia after moving away from the Pound. After the apartheid era sanctions the Rand experienced a great deal of volatility and depreciation.
Related currencies

USDZAR-NEUTRAL SELL strategy 3 hourly chart Reg. ChannelI am cautiously SELL since the trend is not strong, but likely it feels seeing lower levels. We need to retest 17.60s - 17.55s before it may become oversold short-term. GOD is firmer and this helps to support this theory for now.
Strategy SELL @ 17.7500-17.7850 and take profit near 17.6000.

USDZAR Long trading opportunity(swing-trading) 4I expect a swing of about 50cents-75cents all the way up to R18.10+- per dollar, expecting the ZAR to weaken in the short term within a month to a few months(maybe more than a month not more than 3 months) to 18.10+-
I am risking money.

USDZAR-SELL strategy 3 hourly chart Reg.ChannelThe pair does not show a clear direction at current levels, but considering Ichimoku cloud resistance, which is important for direction, we still have downside pressure short-term.
The key resistance lies around 17.9000-17.9300.
Strategy SELL @ 17.8250-17.8650 area and tak profit near 17.6350.

USD/ZAR accumulation zone approachingZAR strength on the back of a very weak Dollar. Potential accumulation zone approaching for those looking to take advantage of the situation.

USDZARSince USD is bearish and ZAR is bullish,
The USD/ZAR pair has a downward bias.
Traders are betting against the U.S. Dollar and in favor of the South African Rand so USD/ZAR may move lower (ZAR appreciation).

USDZAR-BUY strategy 3 hourly chart Reg., ChannelIt feels we are in a slight buying mode today. The indicators are somewhat positive, and we have made some ground before.
Strategy BY @ 17.5875-17.6350 and take profit near 17.7875

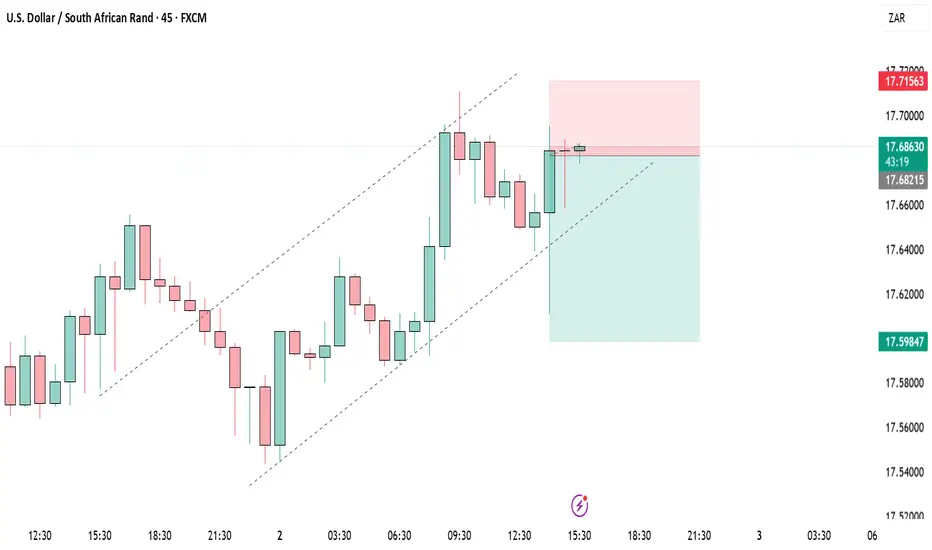
SELL USDZARUSDZAR to short to nearest pivot just below the fresh low at 17,60. New York session closed negative and price will revisit that low. Enter now and when the channel breaks
USDZARCOT Report: Shows net shorts on the USD, indicating a bearish bias for USD/ZAR as institutional traders expect the ZAR to strengthen. Bias: The bearish bias

USDZARMy pov for USDZAR pair is that we should be expecting further gradual drops, not sure if this will be a sharp drop or consolidated one , however should we get a solid break off the support in red line, then we should be looking forth to more sellers dominating this market. Whats your view? What do y

See all ideas
Summarizing what the indicators are suggesting.
Oscillators
Neutral
SellBuy
Strong sellStrong buy
Strong sellSellNeutralBuyStrong buy
Oscillators
Neutral
SellBuy
Strong sellStrong buy
Strong sellSellNeutralBuyStrong buy
Summary
Neutral
SellBuy
Strong sellStrong buy
Strong sellSellNeutralBuyStrong buy
Summary
Neutral
SellBuy
Strong sellStrong buy
Strong sellSellNeutralBuyStrong buy
Summary
Neutral
SellBuy
Strong sellStrong buy
Strong sellSellNeutralBuyStrong buy
Moving Averages
Neutral
SellBuy
Strong sellStrong buy
Strong sellSellNeutralBuyStrong buy
Moving Averages
Neutral
SellBuy
Strong sellStrong buy
Strong sellSellNeutralBuyStrong buy
Displays a symbol's price movements over previous years to identify recurring trends.
Frequently Asked Questions
The current rate of USDZAR is 17.56242 ZAR — it has decreased by −0.07% in the past 24 hours. See more of USDZAR rate dynamics on the detailed chart.
The value of the USDZAR pair is quoted as 1 USD per x ZAR. For example, if the pair is trading at 1.50, it means it takes 1.5 ZAR to buy 1 USD.
The term volatility describes the risk related to the changes in an asset's value. USDZAR has the volatility rating of 0.84%. Track all currencies' changes with our live Forex Heatmap and prepare for markets volatility.
The USDZAR showed a −0.90% fall over the past week, the month change is a −2.12% fall, and over the last year it has decreased by −4.34%. Track live rate changes on the USDZAR chart.
Learn how you can make money on rate changes in numerous trading ideas created by our community.
Learn how you can make money on rate changes in numerous trading ideas created by our community.
Currencies are usually traded through forex brokers — choose the one that suits your needs and go ahead. You can trade USDZAR right from TradingView charts — just log in to you broker account. Check out the list of our integrated brokers and find the best one for your needs and strategy.
When deciding to buy or sell currency one should keep in mind many factors including current geopolitical situation, interest rates, and other. But before plunging into a deep research, you can start with USDZAR technical analysis. The technical rating for the pair is strong sell today, but don't forget that markets can be very unstable, so don't stop here. According to our 1 week rating the USDZAR shows the sell signal, and 1 month rating is sell. See more of USDZAR technicals for a more comprehensive analysis.