Why Traders Freeze: The Psychology Behind Not Cutting LossesFirst up: let’s address the elephant in the room. Loss aversion — that great human flaw. From the moment your ancient ancestor decided to poke a saber-toothed tiger to see what happens, the brain has been hard-coded to avoid pain at all costs.
Loss aversion is literally in your DNA — studies show

Biggest What-Ifs in Stocks (or How Investors Live with Regret)You think you’ve got regrets because you didn’t buy Nvidia NASDAQ:NVDA at $50 or sold Tesla NASDAQ:TSLA at $420? Join the club.
The stock market’s history is littered with “almost” trades, missed deals, and facepalm-worthy decisions that turned out to be trillion-dollar pivots.
This is the ha

Let’s talk about technical analysis & stops.Technical analysis is not your decision-making process — it’s a tool to help you structure better trading decisions by studying past price movements to anticipate likely future moves.
👉 Every time you look at a chart, you should decide:
✅ Do I want to trade at all?
✅ What’s my entry?
✅ Where’s my st

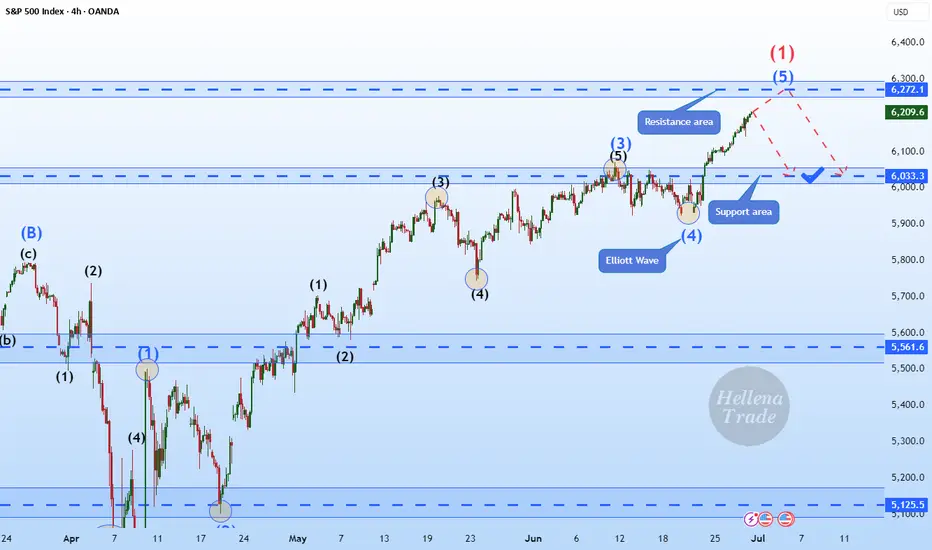
Hellena | SPX500 (4H): SHORT to support area of 6033.Colleagues, I assume that wave “1” completes the upward movement and somewhere around here a major correction ‘2’ should begin, which will consist of waves “ABC” and may continue to the level of 5700. But for now, I think we need to focus on the nearest targets.
I see the support area of 6033 as the
S&P500 Strong Buy Signal flashed for the 3rd time in 2 years!The S&500 index (SPX) is comfortably trading above its previous All Time High (ATH) and shows no signs of stopping here. Coming off a 1D MA50/ 100 Bullish Cross, we expect the 1D MA50 (blue trend-line) to turn now into the first long-term Support going towards the end of the year.
The last 1D MA50/

$100 to $1k to $10k to $100k: TRADING MASTERCLASSHow I approach trading:
Trading is a mostly psychological endeavor
You will not WIN LONGTERM in trading until you WIN YOURSELF (i.e. master your emotions)
I use Technical Analysis to help me determine overall Market Direction and Entry/Exit points
I do not use ANY fundamental analysis in my t

SPX Expansion with Historical DataGood morning everyone!
This week I wanted to elaborate more on my previous idea of SPX with the historical data that led to this analysis. This is almost all fundamental analysis adding in the retracement percentages which can also be evaluated through some technical instruments.
Unemployment rat

X1: SPX500/US500 Short Trade Risking 1% to make 1.35%FOREXCOM:SPX500 / CAPITALCOM:US500 Short for week, with my back testing of this strategy, it hits multiple possible take profits, manage your position accordingly.
Risking 1% to make 1.35%
Note: Manage your risk yourself, its risky trade, see how much your can risk yourself on this trade.
TP-1

S&P500: Once it breaks the 1W MA50, it doesn't look back.S&P500 has turned overbought on its 1D technical outlook (RSI = 75.570, MACD = 96.940, ADX = 23.950) and rightly so as it is extending the rally after crossing above the 1W MA50. The Channel Up since late 2011 shows that when the index crosses above its 1W MA50, it tends to spend a notable time over

SP500 Bullish Momentum Amid Trade DevelopmentsThe US stock index continues to trade higher as overall market sentiment remains bullish, driven by optimism despite Donald Trump's aggressive tariff stance and ongoing global trade negotiations.
Currently, the index is consolidating within a narrow range around 6260. A confirmed breakout from this

See all ideas
Displays a symbol's price movements over previous years to identify recurring trends.
Frequently Asked Questions
US SP 500 CFD reached its highest quote on Jul 2, 2025 — 6,229.7 USD. See more data on the US SP 500 CFD chart.
The lowest ever quote of US SP 500 CFD is 1,737.6 USD. It was reached on Feb 5, 2014. See more data on the US SP 500 CFD chart.
US SP 500 CFD is just a number that lets you track performance of the instruments comprising the index, so you can't invest in it directly. But you can buy US SP 500 CFD futures or funds or invest in its components.