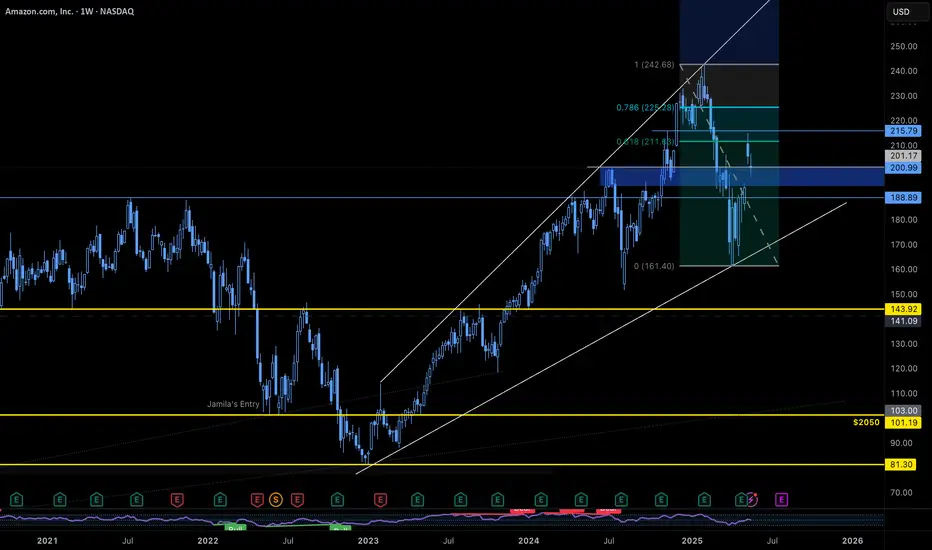
AMAZON Resistance Ahead! Sell!
Hello,Traders!
AMAZON keeps gaining
Bullish momentum so we
Are bullish biased mid-term
However it will soon hit a
Horizontal resistance of 219.00$
From where we will be expecting
A local bearish correction
Sell!
Comment and subscribe to help us grow!
Check out other forecasts below too!
Key facts today
Next report date
—
Report period
—
EPS estimate
—
Revenue estimate
—
5.78 EUR
57.23 B EUR
616.25 B EUR
9.49 B
About Amazon.com
Sector
Industry
CEO
Andrew R. Jassy
Website
Headquarters
Seattle
Founded
1994
FIGI
BBG00GQ6RYZ0
Amazon.com, Inc. engages in the provision of online retail shopping services. It operates through the following business segments: North America, International, and Amazon Web Services (AWS). The North America segment includes retail sales of consumer products and subscriptions through North America-focused websites such as amazon.com and amazon.ca. The International segment offers retail sales of consumer products and subscriptions through internationally-focused websites. The Amazon Web Services segment involves in the global sales of compute, storage, database, and AWS service offerings for start-ups, enterprises, government agencies, and academic institutions. The company was founded by Jeffrey P. Bezos in July 1994 and is headquartered in Seattle, WA.

AMAZON eyes $255 on the 3rd such buy signal in 18 months!AMAZON Inc. (AMZN) has been trading within a 18-month Bullish Megaphone pattern whose latest bottom was on the April 07 2025 Low. Since then, the pattern has started its new Bullish Leg, which has been confirmed by the break-out above its 1D MA50 (blue trend-line) and the 1W RSI's above its MA.
The

AMAZONAMZN is getting ready for another push towards 230 level.
Disclosure: We are part of Trade Nation's Influencer program and receive a monthly fee for using their TradingView charts in our analysis.

Amazon UpdatePrice has re-entered the target box. I mentioned last week that price could still try to target the 1.618 @ $220.01. Judging by the ES, I think it is highly likely that is what is going on. We're still currently trading on hidden bearish divergence which doesn't bode well for a sustained move higher

AMZN BUYBUY AMZN at 182.00 to 173.00, riding it back up to 240.00 to 255.00 as Profit Targets, Stop Loss is at 161.00!
If anyone likes mumbo jumbo long useless analysis,
than this is NOT for you.
Also, if you are afraid of risk, failure, and want only a 100% sure thing, than...
run as fast as you can from

AMZN Stuck Between GEX Walls – Breakout or Breakdown Coming? 6/2🧠 GEX Daily Outlook (Options Sentiment Setup)
Amazon ( NASDAQ:AMZN ) closed around $205, sitting almost flat right below the HVL (High Volume Level) and the critical 202.5–208 gamma resistance cluster. This week's setup is tricky — you're right between big put support and call resistance.
GEX Flow

AMZN | Long | Strong Earnings Momentum | (May 28, 2025)AMZN | Long | Strong Earnings Momentum + Structural Breakout | (May 28, 2025)
1️⃣ Quick Recap: We're in a long trade on Amazon (AMZN), and the setup is unfolding well. TP1 and TP2 have already been hit after flipping key resistance into support. The trend is intact, and we're now aiming for higher

Profit Raiders’ Guide to Conquering AMAZON Stock!Hello, Wealth Warriors! 🌟
Stock market adventurers, let’s embark on a thrilling quest to dominate AMAZON stock with our cunning Raider Trading Strategy! 🗡️📈 Fueled by razor-sharp technical analysis and robust fundamental insights, this plan targets high-reward zones while dodging market traps. Foll

$AMZN Weekly Setup – Watch the $193 GapHere's what we're seeing on the weekly chart:
Price recently hit the 61.8% fib retracement from the all-time high to the April 2025 low
Sitting on strong support from the July 2024 high
A gap at $193 is just below current levels
If the gap closes and holds, we could see a continuation of th
Steady Support at $200: Is It a Prime Opportunity to Go Long?
Targets:
- T1 = $209.00
- T2 = $215.00
Stop Levels:
- S1 = $198.00
- S2 = $193.00
**Wisdom of Professional Traders:**
This analysis synthesizes insights from thousands of professional traders and market experts, leveraging collective intelligence to identify high-probability trade setups. The w

See all ideas
Summarizing what the indicators are suggesting.
Neutral
SellBuy
Strong sellStrong buy
Strong sellSellNeutralBuyStrong buy
Neutral
SellBuy
Strong sellStrong buy
Strong sellSellNeutralBuyStrong buy
Neutral
SellBuy
Strong sellStrong buy
Strong sellSellNeutralBuyStrong buy
An aggregate view of professional's ratings.
Neutral
SellBuy
Strong sellStrong buy
Strong sellSellNeutralBuyStrong buy
Neutral
SellBuy
Strong sellStrong buy
Strong sellSellNeutralBuyStrong buy
Neutral
SellBuy
Strong sellStrong buy
Strong sellSellNeutralBuyStrong buy
Displays a symbol's price movements over previous years to identify recurring trends.
Curated watchlists where AMZN is featured.


Related stocks
Frequently Asked Questions
The current price of AMZN is 187.30 EUR — it has decreased by −0.10% in the past 24 hours. Watch AMAZON.COM INC stock price performance more closely on the chart.
Depending on the exchange, the stock ticker may vary. For instance, on VIE exchange AMAZON.COM INC stocks are traded under the ticker AMZN.
AMZN stock has risen by 2.63% compared to the previous week, the month change is a 12.68% rise, over the last year AMAZON.COM INC has showed a 10.37% increase.
We've gathered analysts' opinions on AMAZON.COM INC future price: according to them, AMZN price has a max estimate of 254.97 EUR and a min estimate of 171.45 EUR. Watch AMZN chart and read a more detailed AMAZON.COM INC stock forecast: see what analysts think of AMAZON.COM INC and suggest that you do with its stocks.
AMZN reached its all-time high on Feb 4, 2025 with the price of 233.70 EUR, and its all-time low was 39.56 EUR and was reached on Aug 29, 2017. View more price dynamics on AMZN chart.
See other stocks reaching their highest and lowest prices.
See other stocks reaching their highest and lowest prices.
AMZN stock is 0.95% volatile and has beta coefficient of 1.35. Track AMAZON.COM INC stock price on the chart and check out the list of the most volatile stocks — is AMAZON.COM INC there?
Today AMAZON.COM INC has the market capitalization of 1.99 T, it has increased by 2.29% over the last week.
Yes, you can track AMAZON.COM INC financials in yearly and quarterly reports right on TradingView.
AMAZON.COM INC is going to release the next earnings report on Jul 31, 2025. Keep track of upcoming events with our Earnings Calendar.
AMZN earnings for the last quarter are 1.47 EUR per share, whereas the estimation was 1.26 EUR resulting in a 16.38% surprise. The estimated earnings for the next quarter are 1.15 EUR per share. See more details about AMAZON.COM INC earnings.
AMAZON.COM INC revenue for the last quarter amounts to 143.89 B EUR, despite the estimated figure of 143.41 B EUR. In the next quarter, revenue is expected to reach 142.07 B EUR.
AMZN net income for the last quarter is 15.83 B EUR, while the quarter before that showed 19.32 B EUR of net income which accounts for −18.07% change. Track more AMAZON.COM INC financial stats to get the full picture.
No, AMZN doesn't pay any dividends to its shareholders. But don't worry, we've prepared a list of high-dividend stocks for you.
As of Jun 9, 2025, the company has 1.56 M employees. See our rating of the largest employees — is AMAZON.COM INC on this list?
EBITDA measures a company's operating performance, its growth signifies an improvement in the efficiency of a company. AMAZON.COM INC EBITDA is 118.23 B EUR, and current EBITDA margin is 19.15%. See more stats in AMAZON.COM INC financial statements.
Like other stocks, AMZN shares are traded on stock exchanges, e.g. Nasdaq, Nyse, Euronext, and the easiest way to buy them is through an online stock broker. To do this, you need to open an account and follow a broker's procedures, then start trading. You can trade AMAZON.COM INC stock right from TradingView charts — choose your broker and connect to your account.
Investing in stocks requires a comprehensive research: you should carefully study all the available data, e.g. company's financials, related news, and its technical analysis. So AMAZON.COM INC technincal analysis shows the buy rating today, and its 1 week rating is buy. Since market conditions are prone to changes, it's worth looking a bit further into the future — according to the 1 month rating AMAZON.COM INC stock shows the buy signal. See more of AMAZON.COM INC technicals for a more comprehensive analysis.
If you're still not sure, try looking for inspiration in our curated watchlists.
If you're still not sure, try looking for inspiration in our curated watchlists.