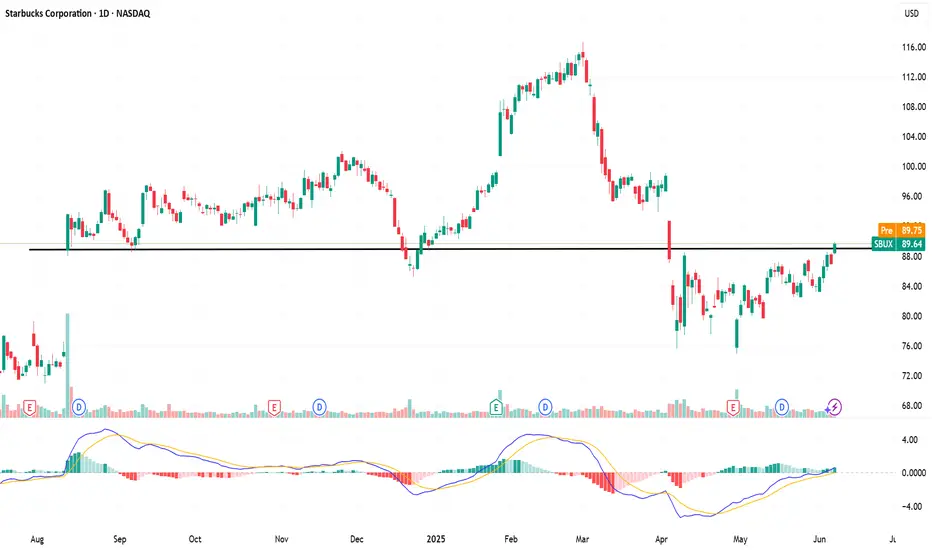
Cup and Handle with a shot of espresso: A bullish blendSince March, Starbucks ( NASDAQ:SBUX ) has been in a sustained downtrend, gradually rounding out a base. Now, the chart is showing early signs of a trend reversal.
Yesterday, price broke out of a bull flag formation on the daily chart and is now testing the $95.50 zone — a critical neckline level o
Key facts today
Next report date
—
Report period
—
EPS estimate
—
Revenue estimate
—
2.55 EUR
3.38 B EUR
32.47 B EUR
1.13 B
About Starbucks Corporation
Sector
Industry
CEO
Brian R. Niccol
Website
Headquarters
Seattle
Founded
1985
FIGI
BBG00GQ6S984
Starbucks Corp engages in the production, marketing, and retailing of specialty coffee. It operates through the following segments: North America; International; and Channel Development. The North America and International segments sells coffee and other beverages, complementary food, packaged coffees, single-serve coffee products, and a focused selection of merchandise through company-oriented stores, and licensed stores. The Channel Development segment include sales of packaged coffee, tea, and ready-to-drink beverages to customers outside of its company-operated and licensed stores. The firm's brands include Seattle’s Best Coffee, Evolution Fresh, Ethos, Starbucks Reserve and Princi. The company was founded by Jerry Baldwin and Howard D. Schultz on November 4, 1985 and is headquartered in Seattle, WA.
Related stocks

PDF-RDF-LDT-BBA perceived fibonacci pattern was fulfilled when SB stock was at 117USD, seeing a drop that could have given us liquidation in a matter of a month, reaching a trend line waiting for a price change fulfilling a fibonacci retracement when the price reached 76USD, giving us liquidation to buy for two m

Consumers sentiments changing direction in ChinaFor quite some years, it was the novelty, foreign and luxury brands that sits well with many Chinese who aspires a different kind of lifestyle, thanks to the western social media influence.
Fast forward years later, with the continuing depressed property market, tepid job market and deflationary en

Starbucks Breakout: Bullish Triangle Targets $94.90" 🚀📈"
📝 Caption/Description:
✅ Long Trade Setup on SBUX (30-min Chart)
🔹 Entry: $91.45
🔹 Stop Loss: $90.26
🔹 Target: $94.90
🔹 R:R Ratio: ~1:2.8
🔸 Breakout from symmetrical triangle with bullish momentum
🔸 Watch resistance around $93.10 for partial profits
📊 Strategy: Breakout + Trend Continuation
🦅

Starbucks (SBUX) Breaks Resistance Starbucks (SBUX) has just broken above the key resistance level around $89.50, which previously acted as a strong support-turned-resistance zone.
SBUX ASCENDING TRIANGLEPretty clear ascending triangle forming for SBUX, still a bit early by the book especially with trumps ability to move markets. Absolutely something to keep an eye on

Sbux to $100Sbux sitting in a strong support level. I believe it will come back up $100 in the next month or two. I am not an expert just sharing my thoughts.
I did open some long term call options . Exp: 3/2026.
Starbucks Stock Chart Fibonacci Analysis 051225Trading Idea
1) Find a FIBO slingshot
2) Check FIBO 61.80% level
3) Entry Point > 85/61.80%
Chart time frame: D
A) 15 min(1W-3M)
B) 1 hr(3M-6M)
C) 4 hr(6M-1year)
D) 1 day(1-3years)
Stock progress: A
A) Keep rising over 61.80% resistance
B) 61.80% resistance
C) 61.80% support
D) Hit the bottom
E

Swing short for StarbucksExpecting this triangular price channel to hold. If a successful breakout were to occur, I'll look for a new long position.

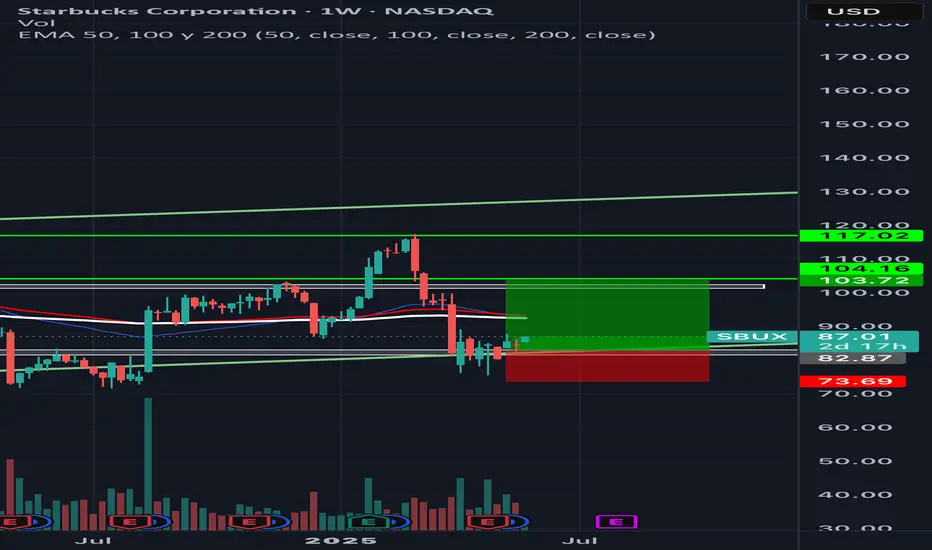
Bullish on SBUXCurrently sitting on a strong support area these past few weeks. It can move upward in the next few weeks, back up to around 104. *This is not trading advise just my opinion.

See all ideas
Summarizing what the indicators are suggesting.
Neutral
SellBuy
Strong sellStrong buy
Strong sellSellNeutralBuyStrong buy
Neutral
SellBuy
Strong sellStrong buy
Strong sellSellNeutralBuyStrong buy
Neutral
SellBuy
Strong sellStrong buy
Strong sellSellNeutralBuyStrong buy
An aggregate view of professional's ratings.
Neutral
SellBuy
Strong sellStrong buy
Strong sellSellNeutralBuyStrong buy
Neutral
SellBuy
Strong sellStrong buy
Strong sellSellNeutralBuyStrong buy
Neutral
SellBuy
Strong sellStrong buy
Strong sellSellNeutralBuyStrong buy
Displays a symbol's price movements over previous years to identify recurring trends.
US855244AX7
STARBUCKS 20/50Yield to maturity
6.92%
Maturity date
Mar 12, 2050
US855244BA6
STARBUCKS 20/50Yield to maturity
6.75%
Maturity date
Nov 15, 2050
US855244AM1
STARBUCKS 17/47Yield to maturity
6.74%
Maturity date
Dec 1, 2047
SRBC
STARBUCKS 15/45Yield to maturity
6.52%
Maturity date
Jun 15, 2045
SBUX4665314
Starbucks Corporation 4.5% 15-NOV-2048Yield to maturity
6.40%
Maturity date
Nov 15, 2048
US855244AU3
STARBUCKS 19/49Yield to maturity
6.37%
Maturity date
Aug 15, 2049
SBUX6071258
Starbucks Corporation 5.4% 15-MAY-2035Yield to maturity
5.12%
Maturity date
May 15, 2035
SBUX5359418
Starbucks Corporation 3.0% 14-FEB-2032Yield to maturity
4.99%
Maturity date
Feb 14, 2032
SBUX5748270
Starbucks Corporation 5.0% 15-FEB-2034Yield to maturity
4.87%
Maturity date
Feb 15, 2034
US855244AZ2
STARBUCKS 20/30Yield to maturity
4.82%
Maturity date
Nov 15, 2030
SBUX5538332
Starbucks Corporation 4.8% 15-FEB-2033Yield to maturity
4.81%
Maturity date
Feb 15, 2033
See all SBUX bonds
Curated watchlists where SBUX is featured.


Frequently Asked Questions
The current price of SBUX is 80.25 EUR — it has decreased by −0.63% in the past 24 hours. Watch STARBUCKS CORP stock price performance more closely on the chart.
Depending on the exchange, the stock ticker may vary. For instance, on VIE exchange STARBUCKS CORP stocks are traded under the ticker SBUX.
SBUX stock has risen by 1.39% compared to the previous week, the month change is a 8.75% rise, over the last year STARBUCKS CORP has showed a 11.49% increase.
We've gathered analysts' opinions on STARBUCKS CORP future price: according to them, SBUX price has a max estimate of 91.51 EUR and a min estimate of 58.47 EUR. Watch SBUX chart and read a more detailed STARBUCKS CORP stock forecast: see what analysts think of STARBUCKS CORP and suggest that you do with its stocks.
SBUX reached its all-time high on Mar 3, 2025 with the price of 111.26 EUR, and its all-time low was 41.49 EUR and was reached on Jul 5, 2018. View more price dynamics on SBUX chart.
See other stocks reaching their highest and lowest prices.
See other stocks reaching their highest and lowest prices.
SBUX stock is 1.06% volatile and has beta coefficient of 1.23. Track STARBUCKS CORP stock price on the chart and check out the list of the most volatile stocks — is STARBUCKS CORP there?
Today STARBUCKS CORP has the market capitalization of 91.47 B, it has increased by 0.21% over the last week.
Yes, you can track STARBUCKS CORP financials in yearly and quarterly reports right on TradingView.
STARBUCKS CORP is going to release the next earnings report on Aug 5, 2025. Keep track of upcoming events with our Earnings Calendar.
SBUX earnings for the last quarter are 0.38 EUR per share, whereas the estimation was 0.45 EUR resulting in a −15.60% surprise. The estimated earnings for the next quarter are 0.56 EUR per share. See more details about STARBUCKS CORP earnings.
STARBUCKS CORP revenue for the last quarter amounts to 8.10 B EUR, despite the estimated figure of 8.16 B EUR. In the next quarter, revenue is expected to reach 7.89 B EUR.
SBUX net income for the last quarter is 355.13 M EUR, while the quarter before that showed 754.24 M EUR of net income which accounts for −52.91% change. Track more STARBUCKS CORP financial stats to get the full picture.
Yes, SBUX dividends are paid quarterly. The last dividend per share was 0.55 EUR. As of today, Dividend Yield (TTM)% is 2.53%. Tracking STARBUCKS CORP dividends might help you take more informed decisions.
STARBUCKS CORP dividend yield was 2.34% in 2024, and payout ratio reached 68.95%. The year before the numbers were 2.32% and 59.18% correspondingly. See high-dividend stocks and find more opportunities for your portfolio.
As of Jul 3, 2025, the company has 361 K employees. See our rating of the largest employees — is STARBUCKS CORP on this list?
EBITDA measures a company's operating performance, its growth signifies an improvement in the efficiency of a company. STARBUCKS CORP EBITDA is 5.53 B EUR, and current EBITDA margin is 18.61%. See more stats in STARBUCKS CORP financial statements.
Like other stocks, SBUX shares are traded on stock exchanges, e.g. Nasdaq, Nyse, Euronext, and the easiest way to buy them is through an online stock broker. To do this, you need to open an account and follow a broker's procedures, then start trading. You can trade STARBUCKS CORP stock right from TradingView charts — choose your broker and connect to your account.
Investing in stocks requires a comprehensive research: you should carefully study all the available data, e.g. company's financials, related news, and its technical analysis. So STARBUCKS CORP technincal analysis shows the buy rating today, and its 1 week rating is sell. Since market conditions are prone to changes, it's worth looking a bit further into the future — according to the 1 month rating STARBUCKS CORP stock shows the sell signal. See more of STARBUCKS CORP technicals for a more comprehensive analysis.
If you're still not sure, try looking for inspiration in our curated watchlists.
If you're still not sure, try looking for inspiration in our curated watchlists.