XNG/USD.1H chart pattern..I'm planning a *short trade (SELL)* on the *XNG/USD* (Natural Gas vs. US Dollar) pair, with a resistance level at *3.720* and a selling target at *3.340*.
### *Trade Plan Summary:*
- *Entry Zone:* Near *3.720* (resistance)
- *Sell Target (Take Profit):* *3.340*
- *Potential Drop:* ~10.2% from

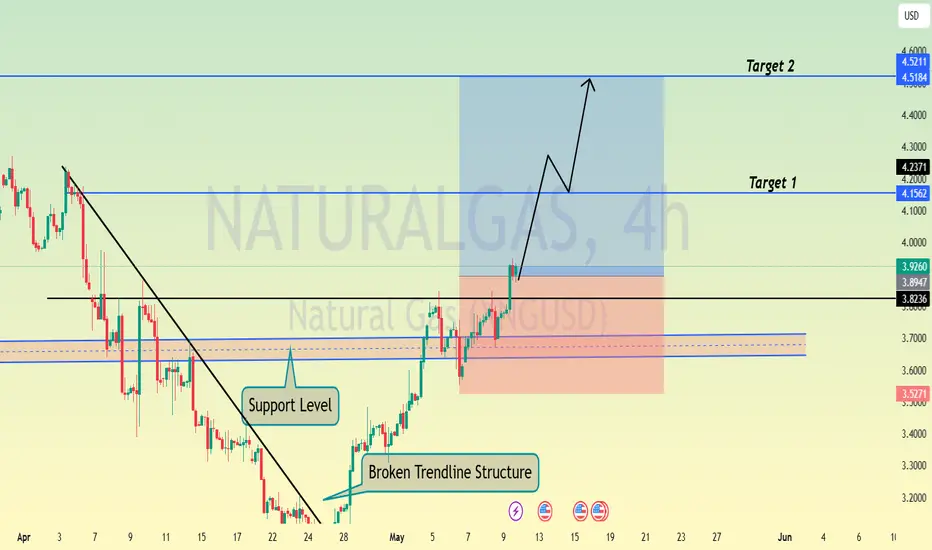
Natural Gas: Bullish Triangle PatternNatural Gas: Bullish Triangle Pattern
Natural Gas (XNGUSD) appears to be forming a Bullish Triangle Pattern, suggesting potential upward movement. The price is currently around 3.9900 USD, and the analysis highlights two key targets:
The breakout from the triangle pattern indicates possible price

NATGAS - NEW BREAKDOWN !Hello Traders !
The Naturalgas price failed to create a new higher high!
The higher low is broken (change of character).
So, I expect a bearish move📉
_____________
TARGET: 3.0950🎯

XNG/USD Natural Gas Heist: Thief Style Long Entry Plan!🌍 Greetings, global treasure hunters! Ciao! Salaam! Salut! Hola! 🌍
Attention, wealth snatchers and market bandits! 💸🦹♂️
Crafted with the slick Thief Trading Style—a blend of sharp technicals and cunning fundamentals—here’s our blueprint to raid the XNG/USD Natural Gas Energy Market. Follow the c

Natural Gas - Are you buying the dip?Natural gas is going through some distribution and it looks like its going lower.
However there is a very strong base around $3 that can be a good risk to reward buy zone.
Remember this is one of the most volatile asset classes amd can overshoot key levels. Size accordingly and leave yourself ma

SHORT NATURAL GAS ON M30Price entered a Resistance+ a Supply zone on D1, it got rejected making a lower high and now it closed on M30 below previous low.My TP zone it aligns perfectly with a weekly demand zone around 3.38 + 0.618 FIB from previous low at 2.9990, however I am closely watching few H4 Demand levels along the
Natural Gas is in the Buying DirectionHello Traders
In This Chart NATGAS HOURLY Forex Forecast By FOREX PLANET
today NATGAS analysis 👆
🟢This Chart includes_ (NATGAS market update)
🟢What is The Next Opportunity on NATGAS Market
🟢how to Enter to the Valid Entry With Assurance Profit
This CHART is For Trader's that Want to Improve Their Te

Natural Gas Wave Analysis – 19 May 2025
- Natural Gas broke support zone
- Likely to fall to support level 240.00
Natural Gas recently broke the support zone between the support level 3.600 (which stopped the previous wave B) and the 50% Fibonacci correction of the previous ABC correction (B) from April.
The breakout of this support

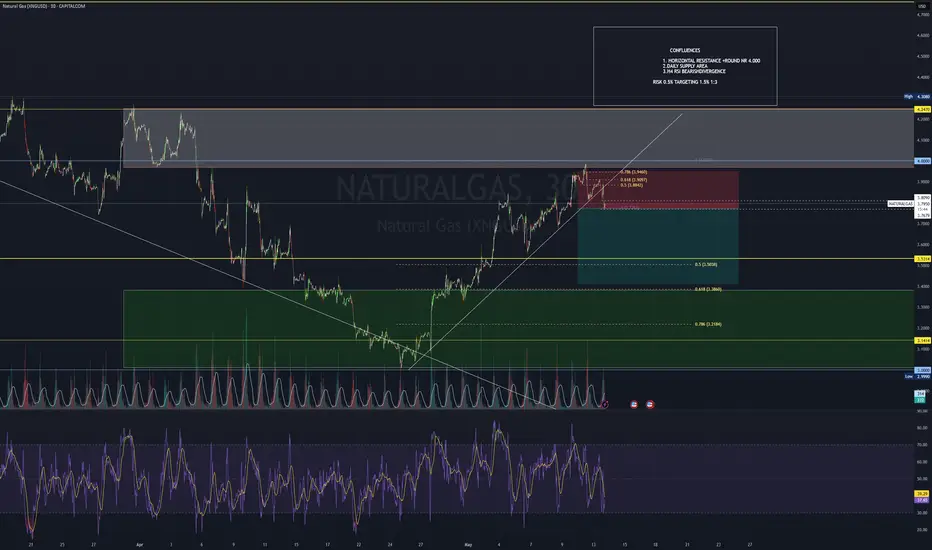
Natural Gas: Bearish Setup with Cautious PositioningFurther upward movement in natural gas is limited. The trend remains bearish.
The only thing that holds me back from opening a short position is the need for a wide stop above the 3.85 high, which is nearly 4.5%. The downside target is at least the $3 level, potentially down to $2.60.
Everything l

Natural Gas is in the Buying Direction After Trendline Breakout Hello Traders
In This Chart NATGAS HOURLY Forex Forecast By FOREX PLANET
today NATGAS analysis 👆
🟢This Chart includes_ (NATGAS market update)
🟢What is The Next Opportunity on NATGAS Market
🟢how to Enter to the Valid Entry With Assurance Profit
This CHART is For Trader's that Want to Improve Their Te
See all ideas
Displays a symbol's price movements over previous years to identify recurring trends.