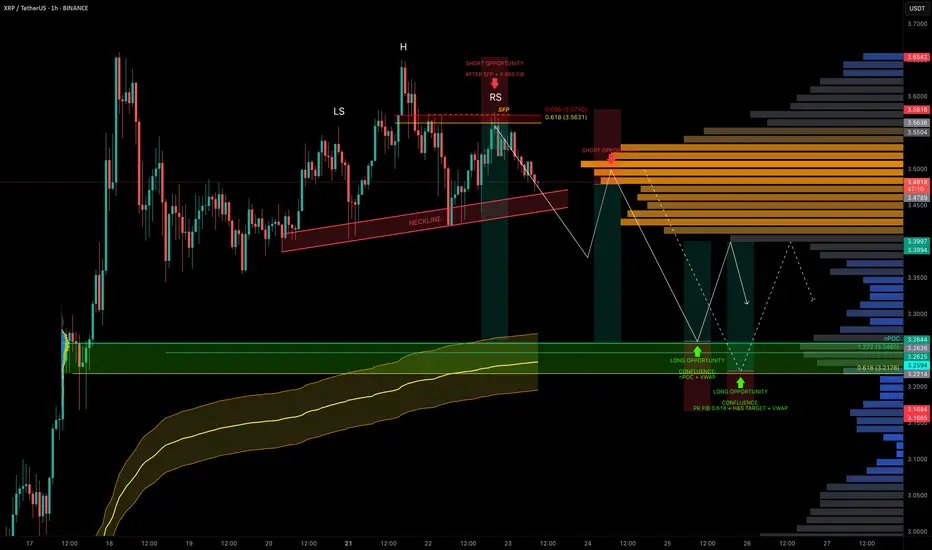
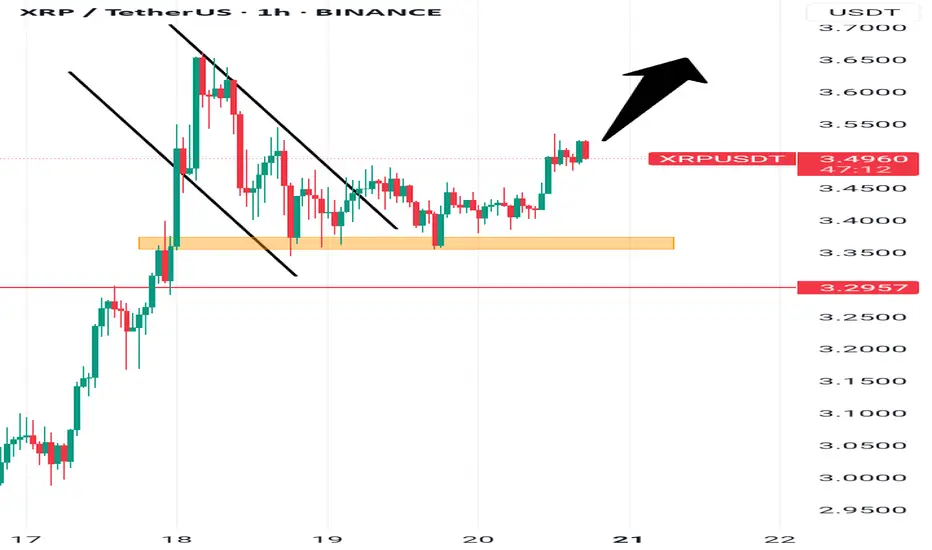
XRP Coiled in Range — Liquidity Below, Trade Setups AheadXRP has been stuck in a trading range around $3.50 for the past 5 days, offering multiple trade opportunities within the chop.
A notable short was triggered after a swing failure pattern (SFP) at the 0.666 fib retracement level near $3.563.
Now, with liquidity building to the downside, we’re watching closely for the next high-conviction setups.
🧩 Current Structure & Short Setup
🔴 Short Opportunity (Triggered):
SFP + 0.666 fib retracement at $3.563 led to rejection.
Market now shows a head & shoulders pattern forming.
Target: $3.2176 (0.618 fib retracement).
Trigger: Watch for a neckline break + retest for short confirmation.
Stop-loss: Above the right shoulder.
🟢 Long Setup:
Watching for a high-probability long around:
$3.26 → nPOC + 1.272 TBFE
$3.23 → anchored VWAP bands
This zone offers strong confluence and could act as the next launchpad.
Long Trade Plan:
Entry Zone: potential entries between $3.26–$3.22, price action needed for confirmation
Stop-loss: Below swing low at $3.1675
Target (TP): ~$3.40
✍️ Plan: Set alerts near the lows and react to price action at the zone — don’t front-run, let structure confirm.
💡 Pro Tip: Trade the Confluence, Not the Emotion
High-probability trades come from confluence, not guessing.
This setup combines nPOC, TBFE, VWAP, fib levels, and classical market structure (H&S) to map precise zones for both longs and shorts.
Let price come to you and wait for confirmation — especially in a rangebound environment where liquidity hunts are frequent.
Final Thoughts
We’re still rangebound, but liquidity is building below.
Keep an eye on the $3.26–$3.22 support zone for long entries and the H&S neckline for short breakdown confirmation.
_________________________________
💬 If you found this helpful, drop a like and comment!
Want breakdowns of other charts? Leave your requests below.
XRPUSDT trade ideas
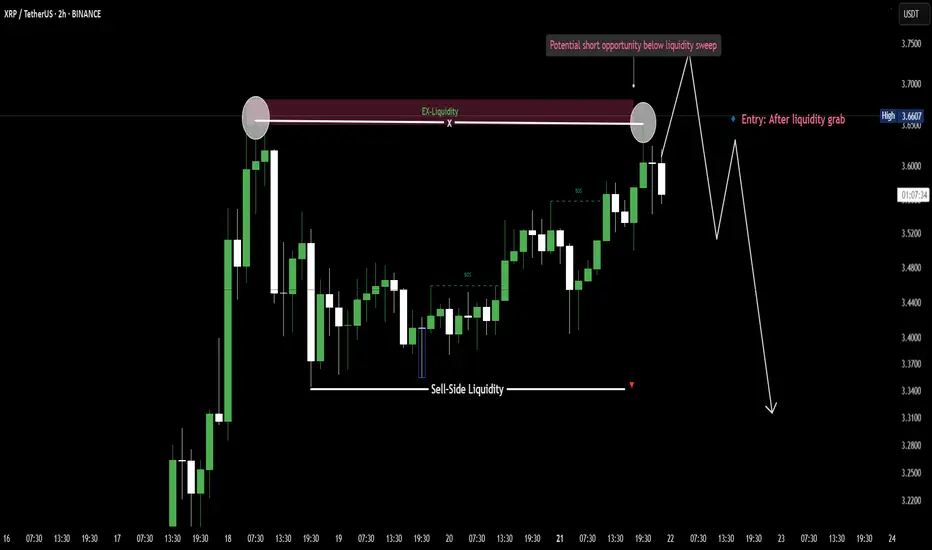
Double Top = liquidity trap?XRP formed a clear double top, tapping into external liquidity.
Price swept the highs, triggering stop hunts above resistance.
A Break of Structure (BOS) confirms bearish intent.
Expecting a sell-off toward the $$ liquidity zone below. 📉
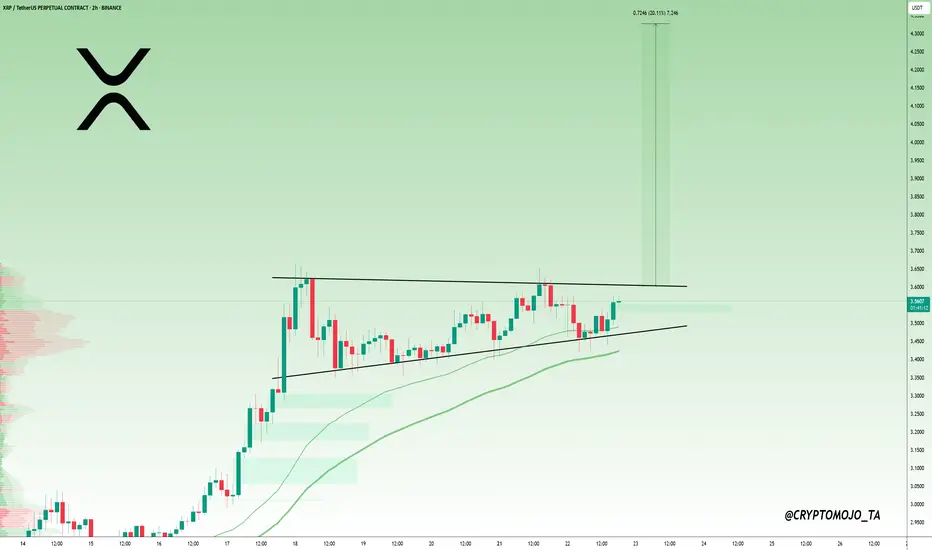
$XRP Breakout Loading, Watch That Triangle! XRP is forming a bullish ascending triangle
The price is holding higher lows while facing resistance around $3.60. This is a typical sign of buyers stepping in. If XRP breaks above this resistance with strong volume, a sharp move toward $4.30–$4.40 could follow. Until then, it’s building pressure inside the triangle. Breakout confirmation is key for the next leg up.
Sell setup if the sell trigger gets activated.Due to a weak trend and a rejection from the all-time high, we’ve seen a strong rejection, suggesting that the price may drop further. If the sell trigger gets activated, it could be a good opportunity to open a sell position.

Bullish XRP Setup: $7, $9, and $13 Main Price TargetsHello✌
Let’s analyze Ripple’s upcoming price potential 📈.
BINANCE:XRPUSDT , I expect a long-term upward bullish trend.
There are three main targets in this analysis: $7, $9, and a final target of $13, which could be reached within 2 to 6 years.
The price may form parallel channels at times, which are shown on the chart. I also expect the current bullish channel to remain valid and continue upward. Additionally, there is a strong trendline guiding the movement.
✨We put love into every post!
Your support inspires us 💛 Drop a comment we’d love to hear from you! Thanks , Mad Whale🐋
🐋Many of the points and levels shown on the chart are based on personal experience, feeling, and over 7 years of research and daily study of crypto charts.
Some of the lines, channels, and price zones are drawn to make the chart easier to understand and to help imagine possible future price movements.
I’ve also included one very big drop in price even bigger than the others because in the crypto market, it’s common for prices to suddenly fall hard and push out small investors and traders with positions.
The targets on the chart are not guaranteed; they might be reached, or they might not.📚
📜Please make sure to do your own research before investing, and review the disclaimer provided at the end of each post.

XRP | Trade-setup📌 Now that the target region has been reached, XRP is now allowed to approach its full correction level.
Trademanagement:
- I'm placing long orders at each level and SL right before the next level. (If the price continues climbing, I’ll adjust the trend reversal level (orange) accordingly and update my limit orders.)
- Once the trade reaches a 2 R/R, I’ll move the stop-loss to break-even.
- From a 3 R/R onward, I’ll start locking in profits.
✅ I welcome every correction from here on —
but I won’t enter any new positions at these top levels.

XRP : Long term analysisHello friends🙌
🔊Considering the great growth that the price has had and has set a new ceiling, be careful because we are at the ceiling and when we are at the price ceiling, we should always expect a price correction...
⚠Now, given the strong upward trend we have, you can buy with risk and capital management, but our suggestion is lower prices for the possibility of a correction and the possibility of a reversal pattern.
So we have identified important support levels for you and we have also identified price targets.
🔥Follow us for more signals🔥
*Trade safely with us*

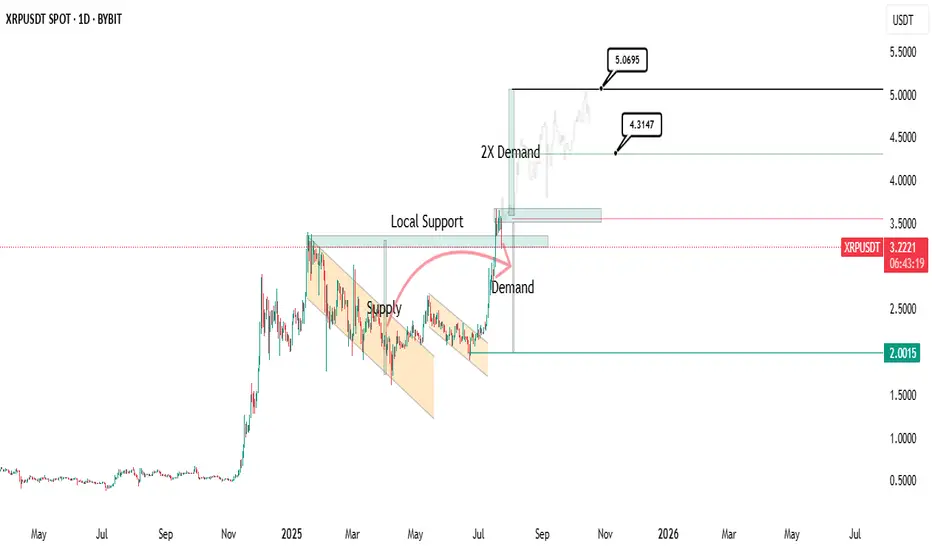
Reversal started?
it can easily 2x its demand and potentially reach $5.5 to $6 within a few weeks.
Read more at: www.cointrust.com
Can Ripple hit $3.40 with 15% upside soon?Hello✌
let’s dive into a full analysis of the upcoming price potential for Ripple📈.
BINANCE:XRPUSDT is poised to challenge the $3.40 level soon, supported by a notable increase in market volume 📊. This price zone also coincides with a key support area aligned with sharp Fibonacci levels, offering a strong base for potential upward movement 🔥.
✨ Need a little love!
We pour love into every post your support keeps us inspired! 💛 Don’t be shy, we’d love to hear from you on comments. Big thanks , Mad Whale 🐋

Is this a Bull Flag forming on the XRP daily timeframe?Although sentiment for XRP is strong and recent trend has been sharply upwards. I'm wondering if this is a bear flag forming on the daily?
Given the sharp rise it could be and may not be a negative signal as it could give the opportunity for a healthy pull back before rising again to new all time highs.
Let's watch how it progresses over the next few days. I will not be jumping into a trade until it confirms.

DeGRAM | XRPUSD above the support level📊 Technical Analysis
● Price is now building above the former 3.39 resistance after the purple multi-month trend-cap break; three higher closes there confirm the zone as fresh support and signal a “run-away” gap.
● July’s 0.85 USDT impulse flags to the rising-channel crest and round-number offer at 4.00, reinforced by the 1.618 Fib projection of the June-July base while the parabolic guide-line of higher lows remains intact.
💡 Fundamental Analysis
● Santiment reports the ten largest wallets added >30 M XRP this week amid media chatter of constructive SEC–Ripple status talks, underlining continued dip absorption.
✨ Summary
Long 3.40-3.50; sustained trade above 3.39 targets 3.80 → 4.00. Bias void on a 16 h close below 2.95.
-------------------
Share your opinion in the comments and support the idea with a like. Thanks for your support!

Bullish movemmentXrp passed its previous highest high denoted with a red line(resistance level), continued moving upward and created a pull back.
On the H1, there is a clear w formation as the bigger structure and a small range followed by a continuous move upwards.
The move will continue complete the W formation.
The More You Believe You Know The More You LoseThe moment you see your first green position something changes Suddenly your brain convinces you you’ve got this But the market doesn’t punish bad traders it punishes the ones who think they’re too good to lose
You don’t lose because you’re unskilled
You lose because you believe you’ve mastered the game
Hello✌️
Spend 3 minutes ⏰ reading this educational material.
🎯 Analytical Insight on Ripple:
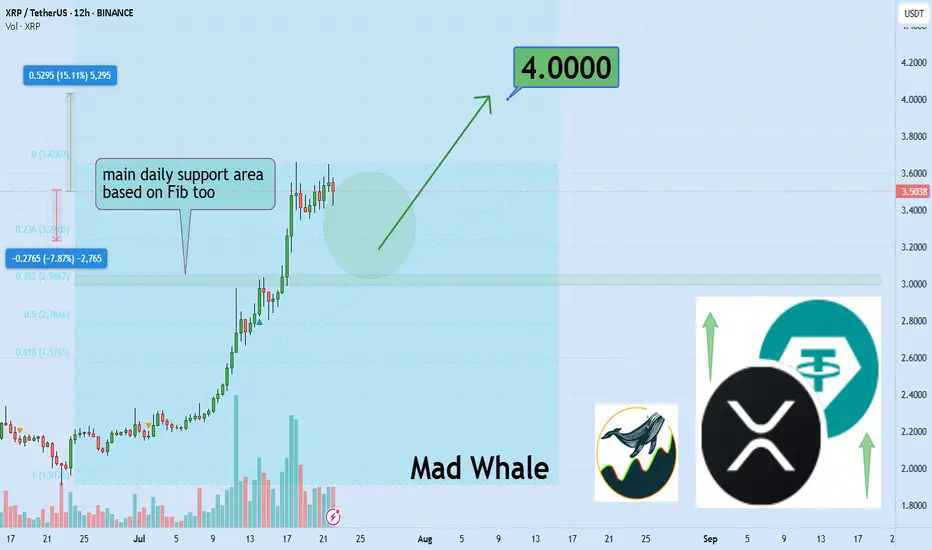
BINANCE:XRPUSDT remains undervalued at current levels, showing strong volume near a key daily support zone that aligns closely with a major Fibonacci retracement. This confluence suggests a potential shift in momentum. If buyers hold this level, a move toward the $4 area is on the table, representing an estimated 15% upside. 📈 Watch for confirmation through sustained volume and price reaction at support. ⚡
Now , let's dive into the educational section,
🎯 The Confidence Trap
One of the most dangerous mental states for a trader is early victory That moment after a couple of green trades when you start feeling like you’ve figured the market out That’s when the market does to you what you used to do to clueless beginners
From that point forward your decisions aren’t based on analysis they’re based on this thought
I already know how this works.
🧠 How Your Mind Tricks You
You win once Your brain says “Told you you’re good”
You win again It says “Go heavier now”
You lose It says “Fix it now You’ve done it before”
This cycle leads to overtrading and emotional revenge You’re no longer trading the market you’re defending the version of yourself you believe you’ve become
🔄 The Market Doesn’t Send Signals It Sends Lessons
When the market moves against you it’s doing the right thing It’s breaking down your ego so you can finally start seeing the chart for what it is not what your confidence wants it to be
🧱 Experience Can Kill Learning
Many failed traders are not beginners they’re the ones with years of bias built up At some point they stop learning Every chart starts looking the same That’s when their final trade shows up
🕳 The Ego Pitfall
If your mind tells you “I know this” it’s time to be extra cautious That means you’re trading with a rigid mindset And in crypto markets the rigid get destroyed
📉 High Leverage = High Confidence = High Risk
Nobody gets reckless on 2x leverage But once you start feeling pro you go 20x 50x or more And when the market flips the same ego that won you your first big gain is the one that wipes out your entire account.
📊 How TradingView Tools Can Save You
In this mental trap three tools from TradingView can seriously help
Replay Bar Tool
Go back in time and relive previous market conditions This tool shows you exactly where your bias failed and where your overconfidence blinded you It helps kill that false feeling of mastery
OBV (On Balance Volume)
A simple yet powerful volume indicator If price rises but OBV is falling the uptrend is fake If price drops but OBV is climbing sellers are weak and a reversal might be near This gives volume context beyond candles
Volume Spike
Watch out for sudden surges in volume If volume explodes but price barely moves someone big is moving in silence It’s often the prelude to fakeouts traps or major directional shifts These spikes scream pay attention
Risk-to-Reward Tool
Don’t let your “confidence” make you forget basic math This tool gives you the true ratio of what you’re risking versus what you’re chasing It doesn’t care how good you feel it shows you if the trade makes sense
🧊 Humility Is the Only Edge That Lasts
Humility means accepting you might always be wrong It means checking yourself with objective tools It means saying “maybe” instead of “definitely”
It means lasting longer than the rest
🔚 Final Words
If you’re sure you’ve mastered the market pause The best traders second-guess themselves often not because they’re weak but because they know confidence fades but risk never does
✨ Need a little love!
We pour love into every post your support keeps us inspired! 💛 Don’t be shy, we’d love to hear from you on comments. Big thanks , Mad Whale 🐋
📜Please make sure to do your own research before investing, and review the disclaimer provided at the end of each post.
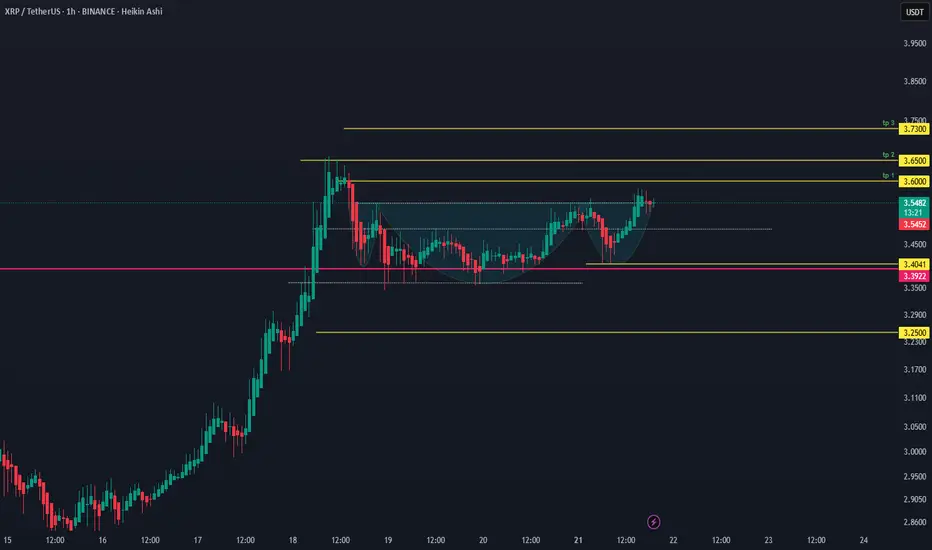
xrpusdt 1hr time frame bullish iH&S patternactivated bullish patter on top of prev. ATh level. targets are 3.60, 3.65 and 3.73
invalidation: a close below 3.40
XRP 1hr Inverse head & shoulder formingXRP 1 hr chart inverse head and shoulders forming.
If it breaks the neckline it could break out for a 5% rise to the next resistance.
Watching this closely over the next few hours for confirmation.

XRPEarly Pullback Potential:
Given the overbought RSI (76.45-89.52) and recent 3% price swings, a slight pullback early in the day is plausible, especially during lower-volume pre-market hours before the New York open (8:00 AM EDT). Key support levels to watch are $3.05 (immediate support) and $2.95 (20-day EMA). A drop to $2.90-$2.95 is possible if profit-taking intensifies, as suggested by declining volume and bearish MACD signals.
Pump on New York Open : The New York market open often brings increased liquidity and institutional activity, which could trigger a price pump. XRP’s recent correlation with bullish market sentiment (Fear & Greed Index at 74, Greed) and high futures open interest ($9.25B) supports potential upside. A breakout above $3.25 could target $3.30-$3.50

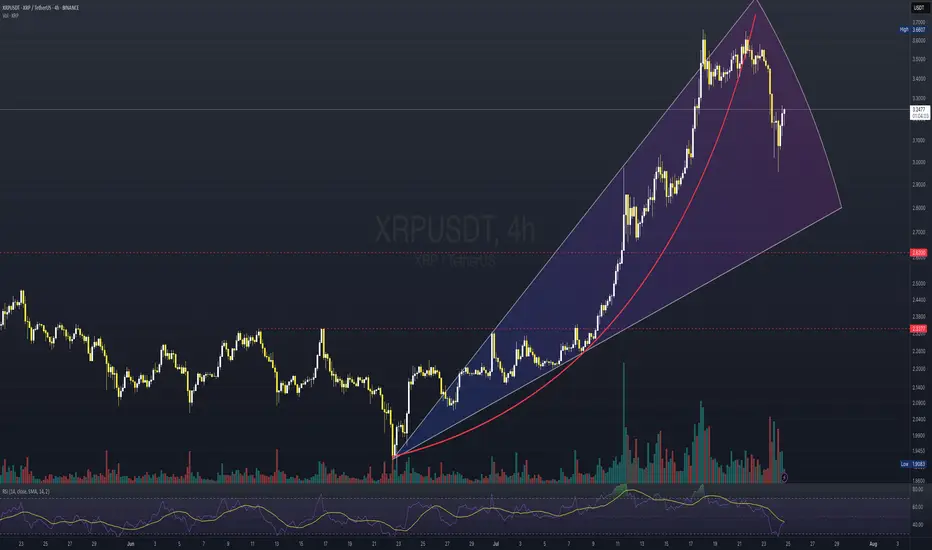
XRP - in the future is room for pastThe chart of XRP/USDT on the 4-hour timeframe reveals a classic example of a parabolic rise within a well-defined ascending channel, which has recently been broken to the downside. The price rallied strongly, forming higher highs and higher lows, supported consistently by the curved trajectory of a long-term trendline and multiple short-term moving averages. However, the steepness of the ascent, culminating in a local high around 3.66, appears to have exhausted momentum.
Following the peak, a sharp correction has taken place, breaching both the dynamic support and the lower boundary of the rising wedge structure. This breakdown signals a potential shift in market sentiment. The recent rebound seems more like a temporary relief or dead-cat bounce rather than a decisive reversal.
From a broader perspective, this move appears to be part of a larger cyclical retracement—where price may revisit and test previous high levels (now flipped into potential support) around the 2.62 and 2.33 zones. These levels are historically significant and could serve as key areas for demand reaccumulation in a longer-term bullish continuation, assuming macro conditions remain favorable.
In essence, while the immediate trend shows weakness, the larger structure still supports a healthy market correction. A return to prior resistance-turned-support would not only be expected but potentially constructive for sustainable future growth.
XRP - take LONG after range SL huntXRP - take LONG after range SL hunt
trend is up
price is above previous HIGH
big chance for trend to go on

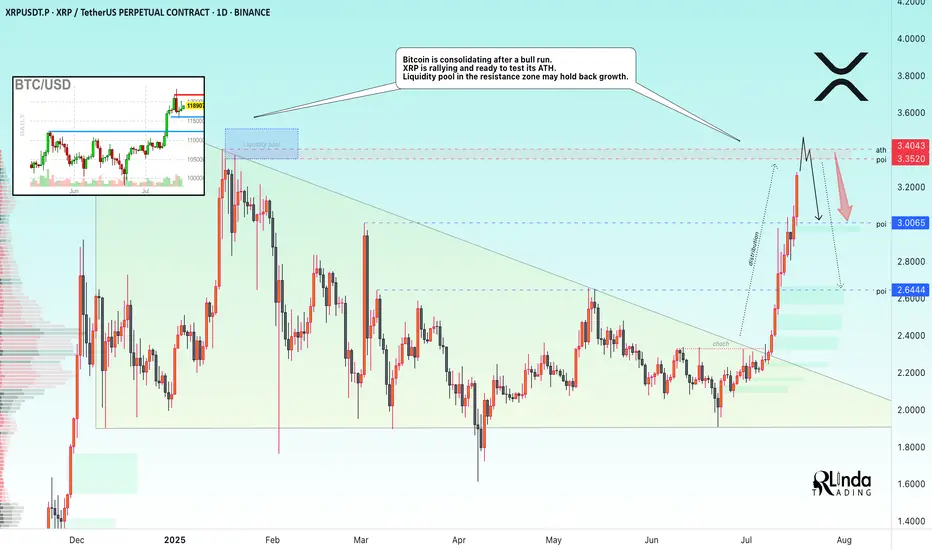
XRP → ATH retest. Reversal or continued growth?BINANCE:XRPUSDT.P is rallying and ready to test the resistance zone - ATH. Against this backdrop, Bitcoin is consolidating after a bull run. The liquidity pool may hold back growth.
Fundamentally, there is excitement across the entire cryptocurrency market. Altcoins are rallying after Bitcoin hit a new high and entered consolidation. The BTC.D index is declining, which generally provides a good opportunity for altcoins to grow. However, the index is approaching technical support, which may affect market sentiment overall...
As for XRP, there is a fairly strong liquidity pool ahead — the ATH resistance zone. The price is in a distribution phase after a change in character and a breakout of the downtrend resistance in the 2.33 zone. The momentum may exhaust its potential to break through the 3.35-3.34 zone, and growth may be halted for correction or reversal (in correlation with Bitcoin's dominance in the market).
Resistance levels: 3.35-3.40
Support levels: 3.0, 2.64
A breakout of resistance without the possibility of further growth, a return of the price below the level (i.e., inside the global flat) will confirm the fact of a false breakout of resistance, which may trigger a correction or even a reversal.
Best regards, R. Linda!
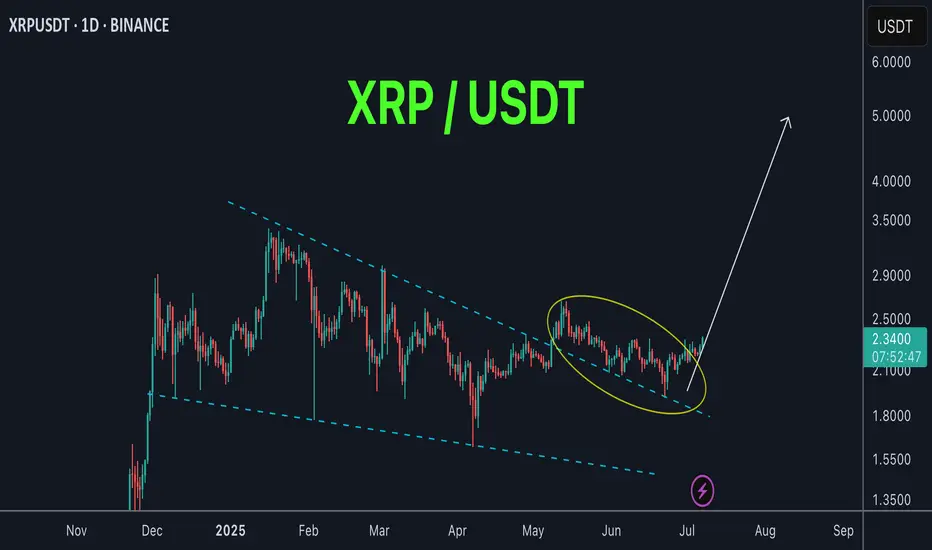
XRP new movement soon !XRP / USDT
XRP is on a long retest after breakout of accumulation zone weeks ago
successful retest here will result in strong bullish rally !
Keep an eye on it in the coming days 👀
XRP is heading toward $4 ┆ HolderStatBYBIT:XRPUSDT is testing $3.40 for the third time. A breakout targets $3.60, but rejection risks $3.10 fallback.

XRP - One More Wave Soon!Hello TradingView Family / Fellow Traders. This is Richard, also known as theSignalyst.
📈XRP has been overall bullish trading within the rising wedge pattern in blue.
However, it is approaching its all-time high at $3.4.
🏹 The highlighted blue circle is a strong area to look for buy setups as it is the intersection of the orange demand zone and lower blue trendline acting as a non-horizontal support.
📚 As per my trading style:
As #XRP retests the blue circle zone, I will be looking for bullish reversal setups (like a double bottom pattern, trendline break , and so on...)
📚 Always follow your trading plan regarding entry, risk management, and trade management.
Good luck!
All Strategies Are Good; If Managed Properly!
~Rich

Comprehensive Analysis: SHORT Signal on XRPUSDT1. News Analysis (Market Sentiment)
The news actually reflects a strongly positive sentiment for XRP’s long-term fundamentals:
"Brazil's VERT Debuts Tokenized Credit Platform on XRP Ledger With $130M Issuance" : This is a very bullish piece of news. It highlights real-world adoption of the XRP Ledger (XRPL) for high-value transactions.
"VERT Launches Blockchain Platform on XRPL for $130M Deal" : This is the same news reported by a different source, confirming the significance of this adoption.
Bridging the Analysis:
Here lies the crucial difference between investors and traders. As long-term investors, this kind of news would motivate us to buy and hold XRP. But as day traders, we understand the common market behavior of “Buy the Rumor, Sell the News.”
The massive price rally before this announcement might indicate the market already anticipated this news. Now that the news is official, early buyers may begin taking profits, triggering selling pressure.
Sentiment Conclusion:
While the news is fundamentally positive, it could strengthen the case for a SHORT position in the short term. This “sell on good news” reaction is a common phenomenon in trading.
2. Technical Analysis (Chart Structure)
The daily chart of XRPUSDT supports a SHORT position even more convincingly:
Climactic Top Rejection : A sharp price rally ends with a long upper wick candle around the $3.60 area. This is a classic sign of buyer exhaustion and aggressive seller entry.
Short-Term Bearish Structure : A large red candle formed after the top, signaling that sellers have taken control. The current price is trading well below that top, confirming the rejection was valid.
Room for Correction : Below the current price, there’s a clear “gap” or market inefficiency. The first logical target for a correction is around $2.80 - $2.90, where the 50 EMA meets the upper edge of the Fair Value Gap (green box). This gives us a clean profit target.
Combined Conclusion:
Yes, based on a combination of “Sell the News” sentiment and clear bearish technical structure, the argument for a SHORT position on XRPUSDT is very valid. We are going against the positive headlines, but following price action signals.
Trading Plan: SHORT Operation on XRPUSDT
Position: SHORT
Asset: XRPUSDT (Perpetual Contract)
Current Status: ENTRY
Entry Reason:
We’re entering based on short-term bearish momentum after a strong rejection from the supply zone, expecting the price to fill the inefficiency below.
Entry Type: Market Order
Why: The bearish move is in progress. We want to catch it now before the price drops further and skips our limit order. We'll execute at the current market price (~$3.01).
Stop Loss (SL): $3.62
Why: Placed slightly above the previous swing high. If price breaks this level, our SHORT thesis is invalid, and we exit to prevent further losses.
Take Profit (TP) Targets & Risk/Reward:
We'll scale out profits in phases to lock in gains.
TP1: $2.85
Why: Confluence of 50 EMA and top of Fair Value Gap
Risk/Reward: ~1:2.8 (Risking $0.61 to gain $1.75 — very healthy ratio)
TP2: $2.55
Why: Mid-point of the Fair Value Gap — a common magnet for price
TP3: $2.25
Why: Full gap fill + retest of prior support/resistance area
TP4: $1.85
Why: Ambitious target — filling the second, deeper Fair Value Gap. Possible in a panic-driven selloff.
Position Management:
Once TP1 is hit:
Move SL to Entry ($3.01) to secure a risk-free trade on the remaining position.
We’ll continue to monitor the price and adjust the trailing stop loss as each TP level is reached.
