Oil Short: Ending Diagonal and Rising WedgeI propose that Oil is a good short candidate because of what I am seeing:
1. Rising Wedge
2. Ending Diagonal within the Rising Wedge
I propose 3 entry points for shorting but mention that if you are shorting at the top of the trendline, to cater for false breakout, meaning more allowance in your st

USOIL ABOUT TO SELL MASSIVELY Price has dropped over 1.59% today! It currently trade at $61.01 per barrel. A sell opportunity is envisaged once price drops lower to $59.9 our target profit is $56

USOIL - Bearish Double TOPHello Traders !
The USOIL price formed a double top pattern.
Currently, The neckline is broken !
So, I expect a bearish move📉
________________
TARGET: 59.410🎯

Oil : April Could Be the Worst Month in Three and a Half YearsOil Prices: April Could Be the Worst Month in Three and a Half Years
As the XTI/USD chart shows:
→ at the beginning of April, WTI crude was trading above $71 per barrel;
→ this morning, on the last day of the month, the price has fallen below $60.
The overall decline may reach 16% — the worst

USOIL Potential UpsidesHey Traders, in today's trading session we are monitoring USOIL for a buying opportunity around 60.80 zone, USOIL is trading in an uptrend and currently is in a correction phase in which it is approaching the trend at 60.80 support and resistance area.
Trade safe, Joe.

SHORT OIL | IMPULSE CORRECTON STRATEGY Direction: Trending downwards
Moving Average: Blue < Red
Pattern Impulse: Impulse correction
Fib Retracement: 38.2
MACD < 0
1st Target = 55.15
2nd Target = 52.53

Heading into Fibonacci confluence?WTI Oil (XTI/USD) is rising towards the pivot and could reverse to the 1st support which acts as and overlap support.
Pivot: 65.19
1st Support: 61.85
1st Resistance: 67.84
Risk Warning:
Trading Forex and CFDs carries a high level of risk to your capital and you should only trade with money you c

WTI Trade Plan 28/04/2025(+1000 pips)Dear Traders,
i expect some correction to below 60 $ and continue uptrend to 68-70 $
If you enjoyed this forecast, please show your support with a like and comment. Your feedback is what drives me to keep creating valuable content."
Regards,
Alireza

WTI CRUDE OIL: Buy signal at the bottom of the Channel Up.WTI Crude Oil turned bearish on its 1D technical outlook (RSI = 42.387, MACD = -1.000, ADX = 27.186) as it crossed under the 4H MA50. Still, it hit and is so far contained at the bottom of the Channel Up, which makes it a strong short term buy opportunity. Aim for the 4H MA200 (TP = 65.00).
## If

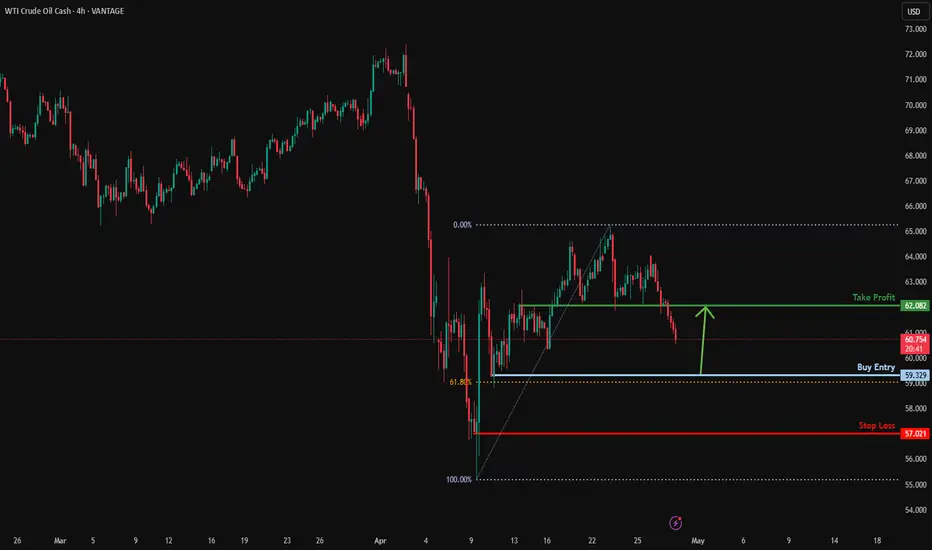
Could the price bounce from here?USO/USD is falling towards the support level which is a pullback support that lines up with the 61.8% Fibonacci retracement and could bounce from this level to our take profit.
Entry: 59.32
Why we like it:
There is a pullback support level that lines up with the 61.8% Fibonacci retracement.
Stop l
See all ideas
Displays a symbol's price movements over previous years to identify recurring trends.