XTZ/USDT Ready for a Massive Breakout After Prolonged Downtrend!Technical Analysis (1D Timeframe):
The XTZ/USDT pair is forming a well-defined descending triangle pattern, with sustained selling pressure since late 2024. However, the price action is now signaling a potential breakout as it approaches the apex of the triangle, supported by a strong accumulation

Tezos short to $0.5362Stop: $0.5605
Tp: $0.54-0.5362
3.8RR
DTT setup
Market looks likely to fall lower before continuation back to the upside

XTZ/USDT A Pattern of Strength in Market Weakness📍 The chart is forming a Livermore-style expanding wedge —
a structure where each price swing grows wider, and volatility increases.
📌 The current zone may be a key turning point for the trend.

XTZUSDT | Key Resistance Zones IdentifiedXTZUSDT is currently testing critical resistance areas—specifically, the blue boxes are proving to be strong resistance levels. This isn’t happenstance; these zones have been carefully identified and have historically served as barriers where sellers dominate.
Key Observations
• Strong Resistance:

XTZUSDT 1D AnalysisXTZ ~ 1D Analysis
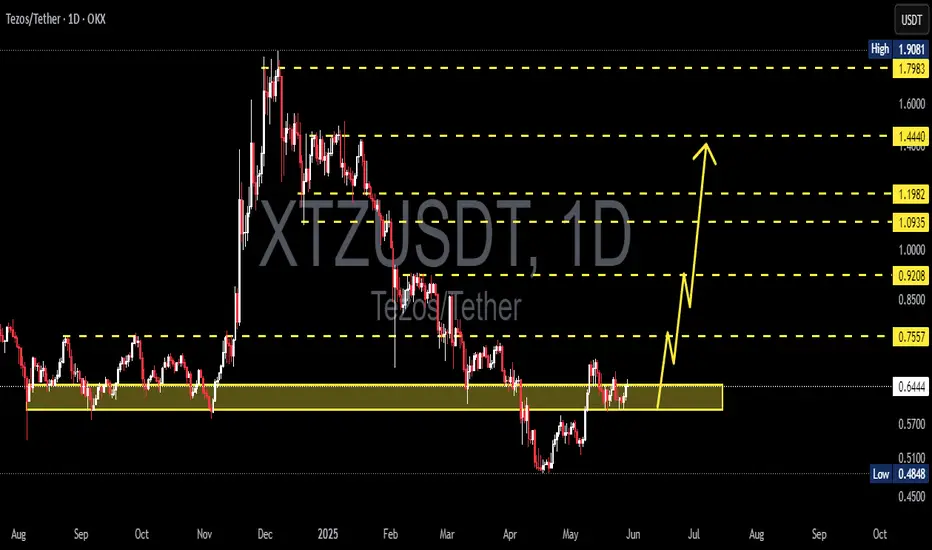
#XTZ Buy gradually from here if you still have confidence in this coin with a short term target of at least 10%+ and long term $2+
tezos short to $0.5859Just now opened a short trade on tezos. Targeting $0.5859
Anticipating a big sell off soon . If am correct the potential bottom should be around prior weekly resistance at $0.586 area.
Stop: $0.6384 or higher

Tezos short to $0.5855Just now opened a short position on tezos. The market looks likely to continue its downtrend. Likely towards $0.5855 potential demand zone.
Stop: $0.6152
target: $0.5855
Roughly 2RR
Time sensitive

Be careful with XTZ !!!So if you pay attention to the XTZ chart you can see that the price has formed a Ascending FLAG or wedge which means it is expected to price move as equal as the measured price movement.( AB=CD )
NOTE: wait for break of the FLAG .
Give me some energy !!
✨We spend hours finding potential opportunit

XTZUSDT 1D#XTZ has broken above the descending channel on the daily chart but was rejected at the daily EMA100. In case of a successful retest of the channel and a breakout above the EMA100, the targets are:
🎯 $0.733
🎯 $0.824
🎯 $0.939
🎯 $1.031
🎯 $1.199
🎯 $1.367
🎯 $1.605
⚠️ Use a tight stop-loss.

Is #XTZ Ready For a Major Breakout or Another Trap Ahead?Yello Paradisers! Are you prepared for what might be one of the sneakiest reversals brewing quietly on #XTZUSDT? Let's see the current setup of #Tezos:
💎#XTZ is trying to break out of a descending broadening wedge formation, a setup that typically signals the end of a corrective structure and the p

See all ideas
Summarizing what the indicators are suggesting.
Oscillators
Neutral
SellBuy
Strong sellStrong buy
Strong sellSellNeutralBuyStrong buy
Oscillators
Neutral
SellBuy
Strong sellStrong buy
Strong sellSellNeutralBuyStrong buy
Summary
Neutral
SellBuy
Strong sellStrong buy
Strong sellSellNeutralBuyStrong buy
Summary
Neutral
SellBuy
Strong sellStrong buy
Strong sellSellNeutralBuyStrong buy
Summary
Neutral
SellBuy
Strong sellStrong buy
Strong sellSellNeutralBuyStrong buy
Moving Averages
Neutral
SellBuy
Strong sellStrong buy
Strong sellSellNeutralBuyStrong buy
Moving Averages
Neutral
SellBuy
Strong sellStrong buy
Strong sellSellNeutralBuyStrong buy
Displays a symbol's price movements over previous years to identify recurring trends.