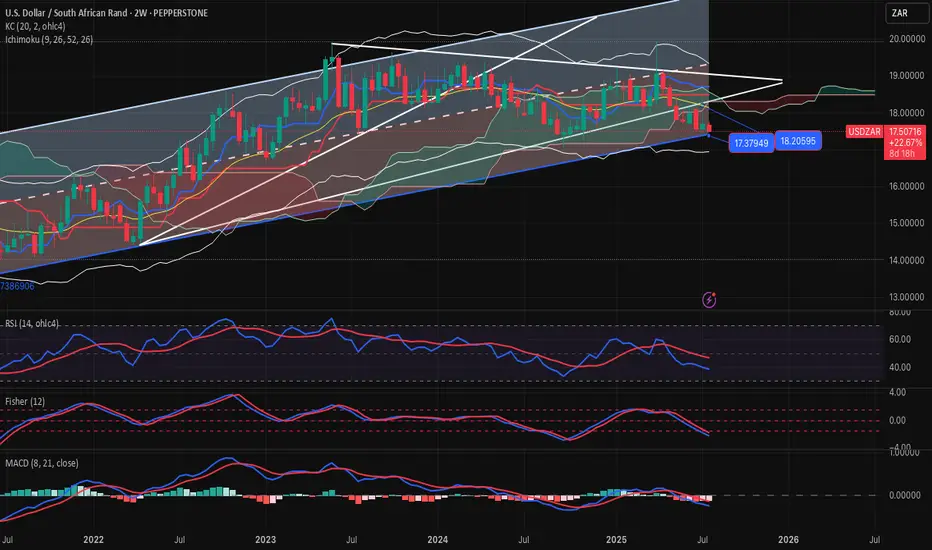
USDZAR-BUY strategy 2-weekly chart Reg. ChannelThe pair is overall on negative mode long-term basis. However, judging the bottom of the channel 17.3700 area or slightly below, BUY entry might look interesting for a recovery medium-term.
Gold is under pressure4 again and medium-term is is overbought, considering that, the pair may find benefit m
Related currencies
buy then sell!Hello all. I had a time to check some other pairs as USDZAR. I don't trade this pair but for who wants to trade, I think there is a very good OPP. to go buy and sell one after another. be happy(wink)

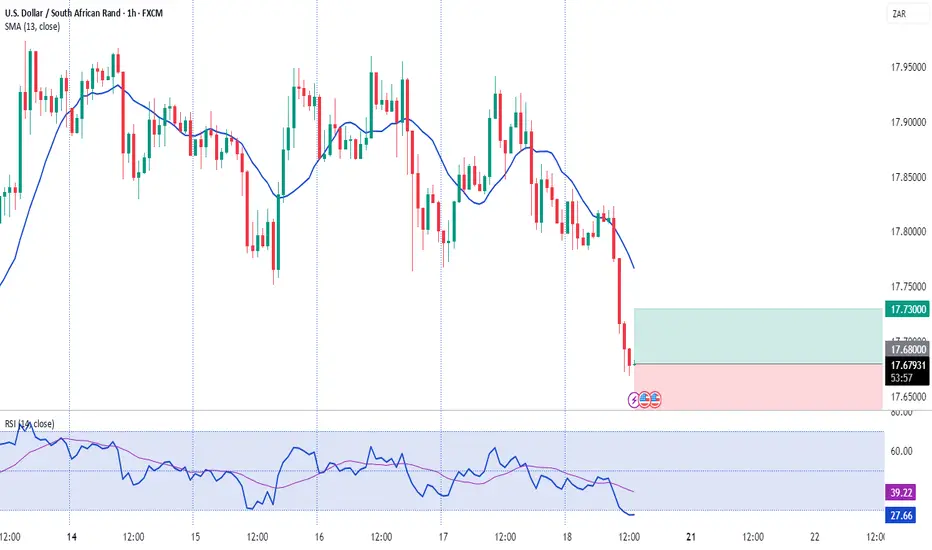
USDZAR-BUY strategy 9 hourly chart The pair is remaining to be within a larger trading band. We are in negative mode, but slightly becoming oversold. Based on the ranges we have seen, one could attempt to be in BUYING mode, but careful as always. gold is strong, but am still having the view to see recovery. Other assets(if we wish to

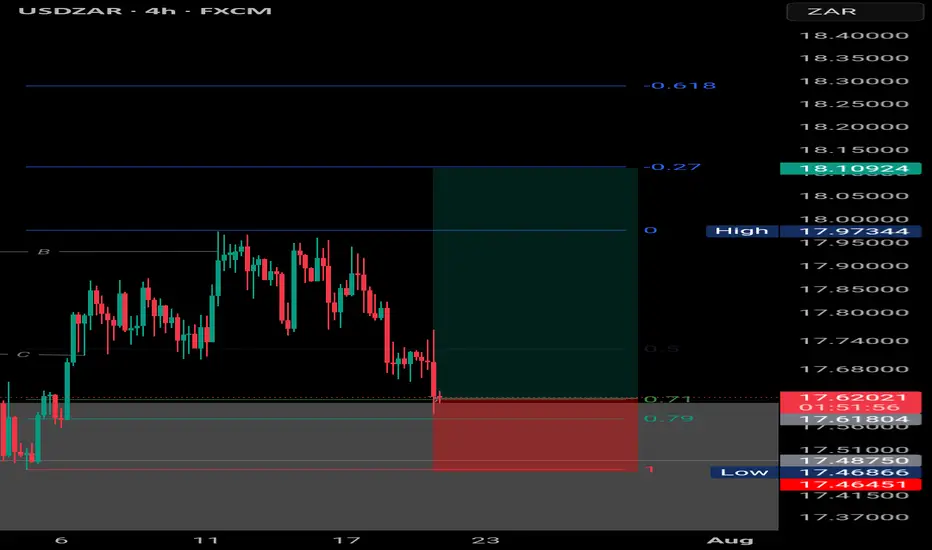
UsdZar-Buy Scenario123 Levels, Inverse Head and Shoulders, Trendline Breakout and retest, Bullish Pennant Formation

A bullish reversal , price broke structure to the upside Price is currently at premium price on a bigger TF and on H4 we see bearish trend violated and retraced back to premium price range

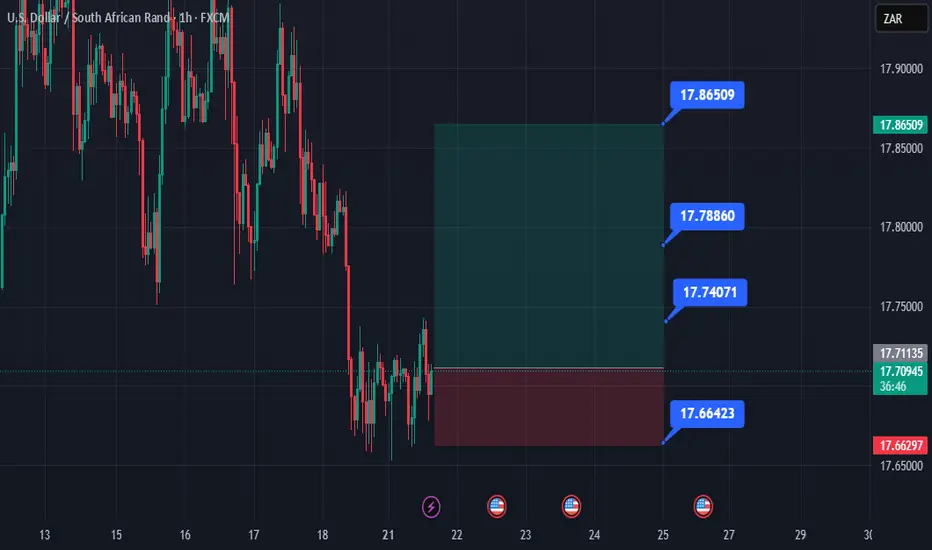
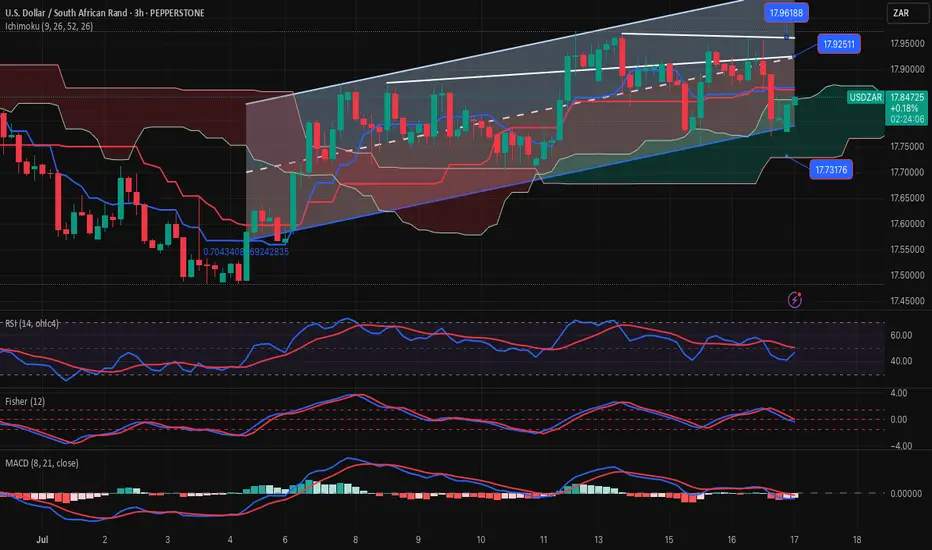
USDZAR-BUY strategy - RANGE 3 hourly chartThe pair is still within a wider range, and it feels we may remain so for a little longer. The direction feels moving higher again with cloud suport 17.7300 area, and i mproving indicators.
Strategy BUY @ 17.7875-17.8350 and take profit near 17.9875 for now.
USDZAR Bullish ideaAs we can see this is our USDZAR quarterly shift idea were we are anticipating price to rally to the upside toward our draw on liquidity objectives. We had a weekly volume imbalance and monthly mean threshold order block show us support after we took out major liquidity points. We also showed more s

See all ideas
Summarizing what the indicators are suggesting.
Oscillators
Neutral
SellBuy
Strong sellStrong buy
Strong sellSellNeutralBuyStrong buy
Oscillators
Neutral
SellBuy
Strong sellStrong buy
Strong sellSellNeutralBuyStrong buy
Summary
Neutral
SellBuy
Strong sellStrong buy
Strong sellSellNeutralBuyStrong buy
Summary
Neutral
SellBuy
Strong sellStrong buy
Strong sellSellNeutralBuyStrong buy
Summary
Neutral
SellBuy
Strong sellStrong buy
Strong sellSellNeutralBuyStrong buy
Moving Averages
Neutral
SellBuy
Strong sellStrong buy
Strong sellSellNeutralBuyStrong buy
Moving Averages
Neutral
SellBuy
Strong sellStrong buy
Strong sellSellNeutralBuyStrong buy
Displays a symbol's price movements over previous years to identify recurring trends.
Frequently Asked Questions
The current rate of ZARUSD is 0.0559 USD — it has decreased by −0.89% in the past 24 hours. See more of ZARUSD rate dynamics on the detailed chart.
The value of the ZARUSD pair is quoted as 1 ZAR per x USD. For example, if the pair is trading at 1.50, it means it takes 1.5 USD to buy 1 ZAR.
The term volatility describes the risk related to the changes in an asset's value. ZARUSD has the volatility rating of 1.43%. Track all currencies' changes with our live Forex Heatmap and prepare for markets volatility.
ZARUSD rate hasn't changed in a week, the last month showed zero change in price, and over the last year it has increased by 3.52%. Track live rate changes on the ZARUSD chart.
Learn how you can make money on rate changes in numerous trading ideas created by our community.
Learn how you can make money on rate changes in numerous trading ideas created by our community.
Currencies are usually traded through forex brokers — choose the one that suits your needs and go ahead. You can trade ZARUSD right from TradingView charts — just log in to you broker account. Check out the list of our integrated brokers and find the best one for your needs and strategy.
When deciding to buy or sell currency one should keep in mind many factors including current geopolitical situation, interest rates, and other. But before plunging into a deep research, you can start with ZARUSD technical analysis. The technical rating for the pair is neutral today, but don't forget that markets can be very unstable, so don't stop here. According to our 1 week rating the ZARUSD shows the buy signal, and 1 month rating is neutral. See more of ZARUSD technicals for a more comprehensive analysis.