Neutral because a descending triangle can go either way. We will have to see the price action at 30K to confirm whether it's bullish or bearish.
This is why i think Link outperformed everything in the crypto market. Look how beautiful this chart is, look how much respect to the Fibonacci retracement. This is your best asset to learn technical analysis on my opinion.
Green line to complete the right shoulder. Red line the measure move in case it plays out. Yellow line in case the pattern fails we could have a throw down.
Keep in mind that : - The overall trend is bearish - The Pattern is almost valid because the second top (EVE) taking a long time to form. - Bearish divergence on both MacD and RSI. - The Measure move to the downside will give class A bullish divergence for a long.
Bearish divergence on H4 and possible bullish Shark pattern, targets for short are B (for now to be safe).
I absolutely love this asset because i find it most enjoyable to chart. Here are some arguments for what you're seeing : 1- From the lowest low (dec18) to high (jun19) we just hit 50% retrace and made a bullish harmonic pattern, think about it. 2- Clear sellers exhaustion 3- Rounding action on higher time frames
Too much coinciding variables that indicate a long opportunity; first the hidden bullish divergence then the bullish butterfly. Good luck.
You can see i have two patterns in development, the little one is bullish and the big one is bearish, weirdly enough these two coincide a lot, because if the bullish gartley plays out we'd have a buy opportunity at 9.6K, then the price would normally go as far to 1.618 fib node which happens to be the pcz of the big bearish shark, but as you may know the shark can...
Bullish Gartley pattern (pcz was hit) + hidden bullish divergence. Targets are A and C.
Bearish shark pattern already hit the first target, coming up 174 then 172.
Potential bullish shark, pattern completion zone highlighted in green. Will give target if it plays out.
Bearish Divergence about to play out : higher highs on price + lower highs on RSI.
Notes included. Less is more, do your own measure moves. Happy trading.
Same adam and eve pattern as bitcoin, also a lot of other alts show the same pattern so measure move after breakout confirmation are the 1.272 and 1.618 fibs.
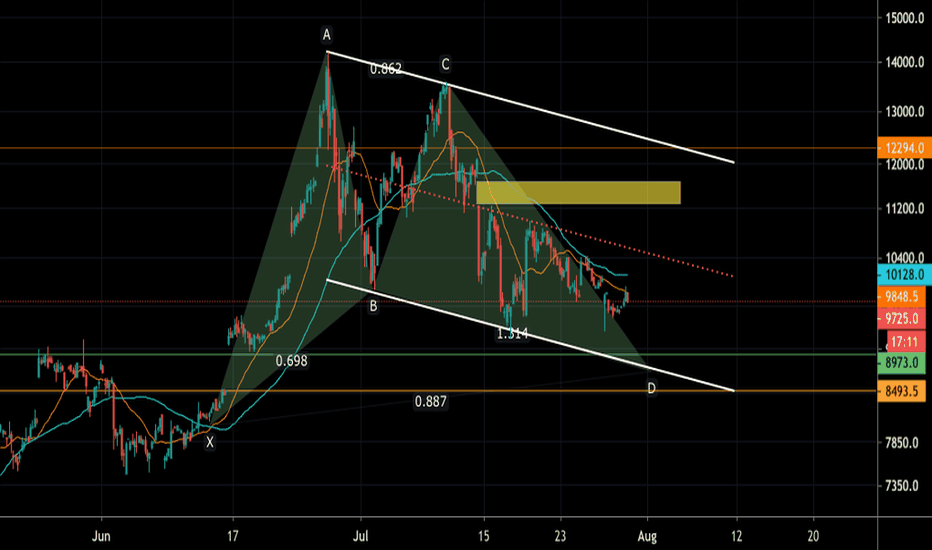
Notice the yellow box up 11K area is a gap that wasn't filled and since everyone is talking about the one at 8.2K i wanted to give this the attention that it needs. So first scénario is a rally up to close the gap then dump again to 8.2k before continuing the bull market. Second scénario is closing the 8.2k gap first then rally up and close the other one on the...


