Could Bitcoin Crash 60%—But Only 20% of Traders Lose?Analyzing the current BTC/USDT chart, we see that Bitcoin is hanging just above a critical support zone—what many traders recognize as “the most important support level” from a volume perspective on Binance. The chart illustrates a potential 60.37% drop, which would pull BTC down nearly $49,000, back toward the high-volume range near $30K.
This sounds catastrophic, right? But here’s the twist...
🔍 Why Only 20% of Traders Might Actually Lose
According to Binance's volume profile data:
The majority of buying activity and position accumulation happened below $35,000.
Most long-term holders and smart money entered during the 2022-2023 accumulation range.
The Volume Profile Visible Range (VPVR) shows significant support below the current price, with minimal trading volume at higher levels.
💡 That means only a minority (approx. 20%) of traders bought BTC during its late-stage bull run above $70K. These are the traders most at risk if a drop occurs.
In contrast, the majority are still sitting in profit—or near break-even—even if Bitcoin retraces back to its base.
📊 So while the price could drop 60%, 80% of holders might remain safe, having entered at lower levels.
🧠 What This Means for You:
If you're a late bull, it’s time to assess risk.
If you're a smart accumulator, the pullback could offer another golden entry.
If you're a bear, this chart supports your thesis—but don't forget the whales are watching this zone closely.
Stay sharp. Stay informed.
Bitcoinprice

Probabilistic thinking. Using Technical logic to get odds.Markets are simple if you think about it.
moderate and long range resistance -- is the best odds for rally.
"horizontal" or 50-50 supports -- risky.
steep supports mean high demand, strong trends. Buying at such supports, at worst it bounces to the upside. (High market with strong trend can mean reversals)
rule: break outs always must coincide with 200dma rallies.
Bonus.
High market, strong trend -- best odds for reversal .
50-50 resistance, with weak support --> trickster market. (trap)
strong trend but no flying 200dma --> trap.
50-50 resistance with strong trend, high market, but weak 200dma ---> good odds for reversal.
keeping it simple.
P.S. this method shows why odds favor BTC reversal . Or why 110/120k had to be peak point. for now.

Bitcoin: Don't be blind to the world (Trump inauguration)Regular readers will know that we avoid fundamental analysis In these reports - we stick to the price.
But that doesn’t mean being blind to the world around us.
On Monday January 20, Donald Trump will be inaugurated as US President.
I’m sure many of you have your political views about Trump - but just keep those away from your trade ideas!
The crypto market - and Bitcoin especially - has been on a huge rally since Trump spoke at a Bitcoin conference in favour of cryptocurrencies last year.
There’s a chance President Trump could mention Bitcoin in his inaugural speech but even if he doesn’t, the prospect of favourable regulation is broadly positive for Bitcoin - or if we’re more honest - the idea of better regulation could be enough justification to keep the crypto bull run going for now.
Bitcoin
On the weekly chart, we can see Bitcoin (BTC/USD) has been trading sideways around the $100,000 level - with roughly $90,000 as support.
But bigger picture it’s a huge uptrend and we want to trade in line with the trend (as always)
Importantly - it just closed the week back over the critical $100K mark - and it did so with a bullish engulfing candlestick that engulfed the previous 3 weeks.
As a reminder - where the week closed is more important than the high or low of the week - and a weekly close is more significant than a daily close. You can think of the closing price as the price that everybody agreed was the right price for that period.
The final missing piece to the bullish breakout is a weekly close at a new record high.
On the daily chart we are watching the broken trendline as well as the $100k level as support that needs to hold if the breakout is going to happen soon.
But while the price trendline is not especially reliable with only two ‘touches’ or swing points the broken RSI trendline is much more significant and shows a big pickup in momentum that will be needed if the price is to break out.
If the breakout does happen, the first barrier that needs to break is $110,000 but after that $120k then even $130k could come quite quickly given Trump’s inauguration this week.
But - as always - that’s just how my team and I are seeing things, what do you think?
Share your ideas with us - OR - send us a request!
Send us an email or message us on social media.
cheers!
Jasper

Recency Bias: Your Brain’s Worst Trade Idea Ever!Let’s face it: your brain is out to sabotage your trading, and recency bias is its weapon of choice. This sneaky psychological gremlin convinces you that your last few trades—good or bad—are all that matter. But spoiler alert: they’re not.
🎲 What is Recency Bias?
Recency bias is your brain’s tendency to overvalue recent events and ignore the bigger picture. Three wins in a row? You’re invincible, right? WRONG. Three losses? Time to ditch your strategy? ALSO WRONG. The market doesn’t care about your streak—it plays the long game, and so should you.
💀 How It Destroys You
1️⃣ Winning Streak Confidence: After a few wins, you start upping your risk like you’re Warren Buffet. Then BAM—one loss wipes you out.
2️⃣ Losing Streak Paralysis: A few losses, and suddenly you’re too scared to pull the trigger, even on solid setups.
3️⃣ Revenge Trading: The currency pair that burned you? Oh, you’ll “get it back,” right? Nope. You’ll just lose more.
🛡️ How to Beat It
1️⃣ Reset Daily: Clear your head before every session. Meditate, walk, scream into a pillow—whatever works.
2️⃣ Stick to Your Plan: Your strategy works because it’s tested, not because your emotions say so.
3️⃣ Journal Everything: Spot your patterns before they wreck you.
4️⃣ Manage Risk: Winning or losing streaks shouldn’t change your position size. Period.
5️⃣ Check Your Ego: The market isn’t out to get you. It doesn’t even know you exist.
🧠 Final Words
Recency bias is a sneaky little troll, but with self-awareness and discipline, you can shut it down. Remember: your last trade doesn’t define you—your consistency does.
Now stop letting your brain gaslight you and go trade like the pro you were meant to be. 🚀

Understanding Moving Averages (MA): A Beginner’s GuideMoving Averages (MA) are among the most fundamental and widely used tools in technical analysis. They smooth out price data to create a trend-following indicator, helping traders identify the direction of an asset’s trend over a specific period.
What is a Moving Average?
A Moving Average calculates the average price of an asset over a set number of periods. By doing so, it reduces the impact of random price fluctuations, providing a clearer picture of the trend.
There are two main types of moving averages:
Simple Moving Average (SMA):
The SMA is the arithmetic mean of prices over a specified number of periods.
Formula:
Exponential Moving Average (EMA):
The EMA gives more weight to recent prices, making it more responsive to price changes.
Formula:
Smoothing factor:
How to Use Moving Averages
Trend Identification:
Rising MA: Indicates an uptrend.
Falling MA: Indicates a downtrend.
Flat MA: Suggests a sideways or range-bound market.
Crossover Signals:
Golden Cross: When a short-term MA (e.g., 50-day) crosses above a long-term MA (e.g., 200-day), signaling a potential uptrend.
Death Cross: When a short-term MA crosses below a long-term MA, signaling a potential downtrend.
Dynamic Support and Resistance:
Moving averages often act as support in uptrends and resistance in downtrends. Prices tend to bounce off the MA during retracements.
Combination with Other Indicators:
Moving averages can be paired with RSI, MACD, or Bollinger Bands for better signal confirmation.
Strengths of Moving Averages
Simplicity: Easy to calculate and understand.
Trend Focused: Effective in identifying and confirming trends.
Versatility: Applicable to various timeframes and markets.
Limitations of Moving Averages
Lagging Nature: Moving averages are based on past prices, which can delay signals.
Less Effective in Sideways Markets: May produce false signals in range-bound conditions.
Best Practices for Using Moving Averages
Choose the Right Period:
Shorter periods (e.g., 10, 20) make the MA more sensitive to price changes, suitable for short-term trading.
Longer periods (e.g., 50, 200) provide a smoother line, ideal for long-term trend analysis.
Combine with Multiple MAs:
Use a combination of short-term, medium-term, and long-term MAs to understand different trends.
Context Matters:
Understand market conditions. Moving averages work best in trending markets and are less reliable in choppy conditions.
Example of Moving Averages in Action
Imagine a stock is in a clear uptrend, with the price consistently trading above its 50-day SMA. When the price retraces and touches the 50-day SMA but bounces upward, this can act as a signal to enter a long position. If the price breaks below both the 50-day and 200-day SMAs, it may indicate a trend reversal.
Conclusion
Moving Averages are a foundational tool in technical analysis that helps traders identify trends, dynamic support and resistance levels, and potential entry or exit points. While they are simple to use, their effectiveness improves when combined with other indicators and a solid understanding of market dynamics. As always, backtest your strategies and adapt your moving average settings to your specific trading style and market conditions.

Year to date Bitcoin vs Gold vs NASDAQThere has been a lot of Gold Bugs posting how well Gold has been doing vs the market. But as you can see nothing comes close to Bitcoin the more you zoom out. Just Year to Date Bitcoin is still the king!

Insider Knowledge: Exploiting the House Money EffectIntroduction
In trading and investing, psychological biases significantly influence decision-making. One such bias is the "House Money Effect." Understanding this effect can help traders avoid common pitfalls and take advantage of this phenomenon.
What is the House Money Effect?
The House Money Effect is a psychological phenomenon where individuals are more likely to take risks with money they have won rather than their initial capital. In trading, this means traders become more risk-tolerant after experiencing gains, treating profits as "house money" and taking on higher risks than they would with their own capital.
Why Does It Happen?
The House Money Effect occurs due to several psychological factors:
Mental Accounting : People tend to treat money differently based on its source. Profits are often seen as less valuable than initial capital.
Overconfidence : After a winning streak, traders may become overconfident in their abilities, leading to riskier trades.
Loss Aversion : Gains are perceived as a buffer, reducing the fear of losses and encouraging riskier behavior.
Example of the House Money Effect on Crypto
In the 2021 Crypto Bull Market, we saw Bitcoin soar to all time highs. This subsequently caused many altcoins to rally really hard resulting in some 100-500x and numerous 2-3x tokens. If you observed at what point in the timeline this happened, this happened towards the end of the bull run, when everyone already knew about crypto and everybody was seemingly getting rich by buying cryptocurrencies. This was the peak of retail activity, which includes newcomers as well as those who got rich from holding tokens earlier.
This is a perfect example of the phenomenon with several key characteristics
Was after a period of extreme gains
Was causing risk assets to outperform, suggesting a higher risk tolerance in the market
Immediately after the markets tanked, clearly indicating this was a massive retail loss
By understanding and spotting the House Money Effect, traders can better manage their emotions and make more rational trading decisions. Recognizing this bias is the first step toward mitigating its impact and maintaining a disciplined trading strategy. We hope you enjoyed reading this idea.

UNI wave reversal case studyCase study for UNI/USDT chart.
see how the MTF Wave down started at the correction. up to the entry there were no fakedowns. The first Fakedown have a clear long entry similar to the ideal MTF Wave illustrated on the right...

Divergence - asset price directionDivergence is the discrepancy between the direction of an asset's price and the readings of an indicator. There are three types of divergences: classical, extended, and hidden. The first two can be used to gauge market sentiment and to trade in the opposite direction. Hidden divergence, however, is more significant and can serve as a powerful supplementary factor in determining the price direction and opening positions.
The use of extended divergence is not necessary, as it rarely occurs and forms at equal highs or lows. In such cases, an indicator is not needed to gauge market sentiment; the chart itself will suffice.
Classical Divergence
Classical divergence indicates a potential trend reversal or the beginning of a correction. Bullish classical divergence is identified when a lower low (LL) forms on the chart while a higher low (HL) appears on the indicator.
The masses buy when classical bullish divergence appears, anticipating significant growth. An upward price movement may begin, but after short-term liquidity for buying is exhausted and the price rebalances, a reversal will occur, and the decline will continue. Long positions opened during the correction will become unprofitable. In a bear market, classical bullish divergence typically appears before the start of a correction.
Bearish classical divergence is identified when a higher high (HH) forms on the chart while a lower high (LH) appears on the indicator.
The masses sell when classical bearish divergence appears, expecting a significant decline. A downward price movement may begin, but after short-term liquidity for selling is exhausted and the price rebalances, a reversal will occur, and the growth will continue. Short positions opened during the correction will become unprofitable. In a bull market, classical bearish divergence typically appears before the start of a correction.
The formation of multiple divergences is common. The masses will seize every opportunity to open their positions, leading to unprofitable outcomes. The number of divergences before the start of a correction is not limited. It is recommended to wait for the price to react after reaching the resistance zone. In the example above, the correction began after partially filling the imbalance on the 1D timeframe within the imbalance on the 1W timeframe.
Hidden Divergence
Hidden divergence serves as a confirmation of trend continuation.
Bullish hidden divergence is identified when a higher low (HL) forms on the chart and a lower low (LL) appears on the indicator.
In an uptrend, hidden bullish divergence may form before the continuation of growth, acting as a strong supplementary factor in determining the future price direction and considering positions.
Bearish hidden divergence is identified when a lower high (LH) forms on the chart and a higher high (HH) appears on the indicator.
In a downtrend, hidden bearish divergence may form before the continuation of the decline, acting as a strong supplementary factor in determining the future price direction and considering positions.
Notes
- The RSI (Relative Strength Index) indicator is used to identify divergences.
- RSI is plotted without considering candle shadows.
- Divergence should be viewed as an additional factor to your analysis, not a standalone tool.
- Divergence below the chart will always be bullish, while divergence above the chart will always be bearish.

Has the Bitcoin Market Become More Manipulated After ETFs? The long-awaited approval of a Bitcoin exchange-traded fund (ETF) in late 2023 undoubtedly marked a turning point for the cryptocurrency. However, with this institutional influx, concerns regarding increased market manipulation have also surfaced. Let's delve into whether these concerns hold water and what the future might hold for Bitcoin's volatility.
Pre-ETF Era: A Wild West of Wash Trading
Market manipulation in Bitcoin wasn't exactly a new phenomenon before ETFs. Wash trading, a tactic where investors buy and sell the same asset repeatedly to inflate its trading volume, was a prevalent concern. This created an illusion of high demand, enticing others to invest and driving prices up artificially. Mark Cuban, a prominent crypto investor, even predicted wash trading as the "next possible implosion" for the industry in early 2023 .
The Double-Edged Sword of Institutional Investors
The arrival of big players with the ETF has undeniably brought more regulation and scrutiny to the market. This, in theory, should deter blatant manipulation tactics. However, the sheer volume these institutions trade with can also influence prices significantly. The question isn't whether they manipulate, but rather how their trading strategies might unintentionally impact market behavior.
A Glimpse into the Recent Controversy
A recent Wall Street Journal report alleging that Binance, a major cryptocurrency exchange, fired an investigator uncovering market manipulation by a VIP client reignited concerns . This incident highlights the potential conflicts that can arise when profit margins clash with regulatory compliance.
So, Has Manipulation Increased?
The answer is complex. While blatant wash trading might be less prevalent, the impact of institutional trading volume and potential conflicts within exchanges are new considerations. It's likely that the nature of manipulation has evolved, becoming more subtle and potentially harder to detect.
A Future of Stability or Stagnation?
The influx of institutional investors could indeed lead to a more stable Bitcoin market, mirroring traditional stock indices. This would be a far cry from the explosive, volatile growth Bitcoin has seen in the past. However, this stability might also come at the cost of reduced returns for investors hoping for another Bitcoin boom.
The Long Hodler's Perspective
As a large language model, I can't claim to be a "hodler" (long-term Bitcoin holder). However, historical data suggests that Bitcoin has weathered similar periods of regulation and scrutiny before. The key takeaway is that despite potential manipulation, Bitcoin's underlying technology and its core value proposition as a decentralized currency still hold significant appeal.
The Road Ahead
The future of Bitcoin manipulation hinges on two key factors:
1. Regulatory Strength: Stronger regulations with clear guidelines and robust enforcement mechanisms are crucial to deter future manipulation attempts.
2. Transparency on Exchanges: Exchanges need to be more transparent about their trading practices and address potential conflicts of interest.
Conclusion
Whether Bitcoin morphs into a stable, institutionalized asset or maintains its volatile character remains to be seen. However, the fight against manipulation, regardless of its form, will be critical in ensuring a fair and healthy Bitcoin market for all participants.

Google search trend for BTCWorldwide, 90days, search trend in Google for bitcoin (red arrows). Orange arrows represent " bitcoin use case ", ie the educated investor?
It shows you the mainstream peak euphoria, enthusiasm or fear , usually at market extremes?
Highest search volume coincides with trade volume.
Other indicator for "hype" would be bitcoin hashtag in twitter/X. According to theory - during enthusiasm people would ignore the bad news or events, and only see everything as positive.
This is a contrarian style, which is often the opposite of T.A., ie strong trend can be longterm bad.
Pessimistic or skeptical sentiment is usually good (opposite of mainstream view or mood), or usually it means more money is left at sidelines.

The whole truth about trading - playing against fateIt is apparent that your interest in trading stems from a desire to transcend the conventional 9 to 6 work regimen or to establish an additional revenue stream for enhanced financial stability. Regardless of the impetus, trading imbues one with a sense of hope—a hope for attaining financial autonomy and catering to the exigencies of one's familial responsibilities.
Nevertheless, hope unaccompanied by acumen proves inadequate in the realm of trading.
Are you prepared to delve into the intricacies of trading in its entirety?
Can you harness the mechanisms of trading to your advantage and prosper therein?
Trading is a means of slow enrichment
For many, the following assertion may not be warmly received, yet it warrants acknowledgment: Trading serves as a gradual enrichment scheme.
While anecdotes exist of traders who commenced with modest capital and ascended to seven-figure balances, such instances are rare. The reality is stark: the odds of such success are exceedingly slim. The allure of amassing substantial wealth swiftly is tempting, but it often necessitates assuming excessive risk. Only those blessed with exceptional luck may realize significant gains in short order.
Conversely, the vast majority—99.99%—who pursue this path find themselves depleting their initial investment. Merely a fortunate minority attain even modest profits, and their success is often attributed more to chance than skill.
Consider the perspective of Warren Buffett, whose wealth is renowned:
"My wealth is a product of American residency, fortuitous genetics, and the power of compound interest."
The crux lies in compound interest—the gradual accumulation of profits over time. Buffett's ascent to becoming the world's wealthiest investor spanned decades, not mere weeks or months.
Hence, if one views trading as a shortcut to affluence, disillusionment is inevitable.
You need money to make money from trading
One of the most pervasive trading fallacies is the belief that possessing a profitable trading strategy guarantees the potential to amass millions in the market—a notion that has ensnared many traders.
While it is feasible to develop a lucrative strategy, its profitability alone does not guarantee the attainment of vast wealth. Why? Because the magnitude of your initial deposit plays a pivotal role.
Consider this scenario: Suppose you possess a trading strategy yielding a 20% annual return.
With an account balance of $1,000, your potential earnings amount to $200 per year.
With $10,000, your potential earnings escalate to $2,000 annually.
Scaling up further, with a $1 million account, potential earnings soar to $200,000 per year.
This illustrates that while a trading strategy is undeniably significant, it represents only one facet of the equation. Equally crucial is the size of your trading account.
This elucidates why hedge funds attract vast sums—often in the millions, if not billions of dollars—since substantial capital is indispensable for maximizing returns from trading endeavors.
Trading is one of the worst ways to earn a regular income
Trading is often sought out by individuals seeking an alternative income stream, aiming to liberate themselves from the confines of a conventional 9 to 6 job in pursuit of pursuing their passions. However, it is crucial to confront a sobering reality: trading stands as one of the least reliable avenues for securing a consistent income.
Why? The dynamics of financial markets are inherently mercurial. A strategy that yields profits one week may falter the next. This isn't to suggest that such strategies become entirely obsolete, but rather that market conditions necessitate adaptability. Realigning a strategy to suit evolving market dynamics demands time—a commodity not readily available in the fast-paced world of trading. This adjustment period could extend over several weeks or even months.
Consequently, anticipating profits on a daily, weekly, or even monthly basis proves unrealistic. Success in trading hinges upon one's ability to capitalize on market opportunities as they arise, accepting the yields bestowed by the market, and refraining from unrealistic expectations of consistent returns.
You're always studying the markets
Continuous learning is indispensable for success in trading. Reflecting on my own journey, I initially gravitated towards indicators and price action trading, convinced that these tools alone would suffice for profitability. However, this mindset hindered my progress, as I neglected broader market perspectives.
Recognizing the limitations of my approach, I embarked on a journey of exploration. I delved into the practices of accomplished traders, discovering diverse strategies such as trend trading, system trading, and mean reversion trading.
Today, my repertoire encompasses multiple trading strategies across various markets. This diversified approach has engendered a more consistent capital curve, enhancing my overall returns.
The pivotal lesson gleaned from this experience is clear: achieving profitability in trading does not signify the culmination of one's learning curve. On the contrary, ongoing education and exploration of the markets remain imperative for sustained success.
How do you become a successful trader when all the odds are against you?
Embrace Existing Solutions:
Attempting to forge your own path in trading can prove both time-consuming and costly. Instead, seek out established trading algorithms equipped with tested and proven trading rules. Consider investing in algorithms like mine, which come backed by historical testing results.
Maintain Financial Stability:
Relying solely on trading for income places undue psychological pressure on yourself. The imperative to generate monthly income often leads to hasty and ill-advised trading decisions. Many seasoned traders, therefore, diversify their income streams. For instance, some engage in mentorship or operate hedge funds that levy management fees irrespective of market performance. By securing a stable income through alternate means, you can focus on trading without financial anxiety.
Harness the Power of Compound Growth:
Albert Einstein hailed compound interest as the eighth wonder of the world. Yet, I propose introducing you to the ninth wonder: the regular infusion of funds to augment profits. Consider this scenario: with an initial $5,000 investment earning an average annual return of 20%, you would amass $191,688 over 20 years. However, by adding an additional $5,000 to your account annually and compounding profits, your total would skyrocket to $1,311,816 over the same period. Witness the transformative potential of consistent contributions and compounding gains.

Bubble theory 🫧 BTC minersThere are two type of bubbles and they burst for different reasons? A bubble is when too many people hold something and what has driven prices up, now as a force works against them.
There's a saying. Buy things when everyone is a skeptic. Sell when a taxi driver starts talking about investing. There are no more buyers left on top.
First bubble is when volume dries up as the price hits extremes.
Second is when peoples attitudes or sentiment, or opinions change to bearish. And that can happen over night, like a switch. It's interesting and finance is a social science.
Some bubbles can burst due to external events, like start of wars or some financial crisis.
There can be strong bull markets and most of times, these external events would just be noise?
> Was btc miners in bubble? And what type of bubble?
I think Yes and No? Whenever there's a risk free trade, supported by factors a bubble emerges? The price of Mara was rallying hard, trend was strong. You could argue people got over optimistic, knowing the ETF decision was a risk event. -> therefor (the burst) was sentiment driven. But also predictable?
Bubble is when too many people hold asset and there re no buyers left. Similar how a taxi driver is hype about investing.
Technical analysis gives you perspective and context. In 1st instance, impulse was too high and volume indicates crowding? It's tricky because it looks so bullish.
In 2nd instance, impulse was too low. Price action looked bullish? bubbles happen when too many people hold the shares and expect them to rise.
If 1st instance was sentiment switch driven, then 2nd time, the bubble must burst due to exhaustion (or no people left to buy... at these prices.. similar how taxi driver hops in the trade at the wrong time).
Factors and thesis can be bullish - and bubble still bursts.
Is NVDA and SMCI a bubble?
I think there is difference between NVDA, SMCI investors and their time horizon? It could be. I think people believe their investment is supported by the tech drivers. Every dip should be bought out by smart investors and these are the best assets to own in next 5-10 years.
It doesnt mean there cant be external events and risks.
again- bubble is when too many people are in investment. So bubble can burst either by them changing their sentiment or beliefs (maybe fundamentals must change?). Or if price is just so ridiculously high or there is no money left at sidelines, that trend can't be sustainable.
When markets rally - everyone only reads good news and ignores bad news. And vice versa. #HowardMarks #MarketCycle
---> The Risk-Reward buying at these tops just isn't great. That's why they burst. Accompanied by sentiment risks, that hide behind the hood.

Can Bitcoin Hedge Against a Falling Dollar?Global inflation often signifies a weakening of global currencies. The question of whether Bitcoin can serve as a hedge against a depreciating dollar has gained significant interest among investors.
Or should it still be the Gold?
In this study, we will analyse the top 8 cryptocurrencies to determine which one is a more reliable currency hedge.
Bitcoin & Its Minimum Fluctuation
$5.00 per bitcoin = $25.00
BTIC: $1.00 per bitcoin = $5.00
Code: BTC
Micro Bitcoin & Its Minimum Fluctuation
$5.00 per bitcoin = $0.50
BTIC: $1.00 per bitcoin = $0.10
Code: MBT
Disclaimer:
• What presented here is not a recommendation, please consult your licensed broker.
• Our mission is to create lateral thinking skills for every investor and trader, knowing when to take a calculated risk with market uncertainty and a bolder risk when opportunity arises.
CME Real-time Market Data help identify trading set-ups in real-time and express my market views. If you have futures in your trading portfolio, you can check out on CME Group data plans available that suit your trading needs www.tradingview.com

An optimal distribution of cryptocurrency holdings - Educational
Welcome to our video where we talk about the best way to spread out your crypto investments. We'll break down the key ideas and important things to think about when deciding where to put your money in the ever-changing world of cryptocurrencies.
If you have any questions Feel Free to reach out!

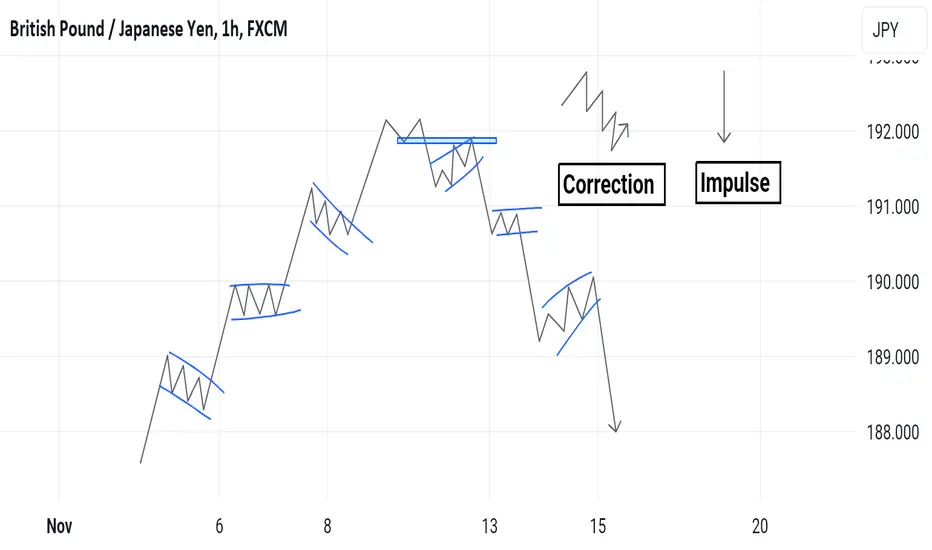
NATURE OF PRICE The market price moves in phases (Nature). Understanding the nature of how the price /market move would help elevate your skills.
The price moves in 2 phases viz:
1. Correction: When the price moves against the main direction of the trend with very low momentum candles
2. Impulse: When price moves same direction as the main trend with very high momentum candle.
Price moved in 1-2-3 formation, impulse - correction - impulse........ In the next post I'll add position to show you how to place trade.
AI-Assisted Channel Patterns: Visuals for Precision TradingTypes of Channel Pattern
In this educational post, we won't take a trading position, but rather equip you with valuable insights. Today, we delve into the world of channel chart patterns. Channels come in two primary forms: bullish and bearish. Understanding these patterns is essential. A bullish channel appears as a descending pattern, resembling a falling rectangle, while a bearish channel manifests as an ascending pattern within rising rectangles.
Technicals of Channel Patterns
But why are these channels so important? Bullish channels often precede a shift from a bearish trend to a bullish one, signaling a shift from a pessimistic to an optimistic market outlook. Conversely, bearish channels frequently herald a move from a bullish trend to a bearish one, indicating a transition from an optimistic to a pessimistic market sentiment.
Application of Channel Patterns
Channels serve various purposes, from brokers illustrating their expectations to traders preparing for upcoming trends. They also offer an excellent opportunity for automation, as modern AI systems can detect channels with remarkable precision, often exceeding 70%.
Our Notes to Channel Patterns
However, it's worth noting that channel patterns are seldom used in isolation. To make the most of them, traders often combine AI-assisted channel detection systems with volume analysis. When analyzing BTC-USD markets across nine exchanges and over five years, we found that volume frequently aligns with precisely defined channel patterns.
By incorporating volume as a technical indicator and leveraging AI-generated channels, you can enhance your trading strategies and increase your chances of success in the cryptocurrency markets. Best of luck in your trading endeavors!
Best regards,
ELI

Bitcoin's Unstoppable Rise Against the US Dollar and GoldAs we all know, Bitcoin has been the talk of the town since its inception. Its meteoric rise has left traditional investment avenues in awe, and today, I am here to shed light on an astonishing fact that will leave you even more astounded. Brace yourself for the revelation!
Since 2014, the US Dollar has only managed to make a minuscule move of 0.00006% against Bitcoin. Yes, you read that right! While the traditional financial markets have been grappling with volatility and lackluster returns, Bitcoin has been silently revolutionizing the way we perceive wealth accumulation. This remarkable statistic speaks volumes about the unparalleled strength and stability of our beloved cryptocurrency.
But that's not all! Let's compare Bitcoin's performance against another popular investment asset: gold. While gold has been considered a safe haven for centuries, it has failed to keep up with the incredible growth of Bitcoin. The precious metal has witnessed a decline in value over the same period, making it a less attractive option for investors seeking substantial returns.
Now, you might be wondering, "What does this mean for me as an investor?" Well, my dear friends, it means that the time to seize this opportunity is now! Bitcoin has proven its resilience time and time again, making it a force to be reckoned with in the investment world. Its potential for exponential growth is unparalleled, and the numbers speak for themselves.
So, I encourage each and every one of you to continue investing in Bitcoin, ride the wave of its unstoppable rise, and reap the rewards of your foresight. Don't let this chance slip through your fingers; embrace the future of finance and join the ranks of those who have already profited immensely from this digital revolution.
If you haven't already done so, consider allocating a portion of your investment portfolio to Bitcoin. It's time to diversify, explore new horizons, and embrace the possibilities that lie ahead. The world of cryptocurrencies is evolving at an unprecedented pace, and being a part of this transformative journey is an opportunity you simply cannot afford to miss.
Remember, fortune favors the bold. Take action today, and let Bitcoin be your gateway to financial prosperity. Stay ahead of the curve, and together, let's shape a future where the possibilities are limitless.
Wishing you boundless success and thrilling adventures in the world of Bitcoin!

How does the interest rate affect the markets?How does the interest rate affect the markets?
We often hear in the news that the market is rising or falling after decisions or some statements by the Fed. We also often talk about the dollar index, so let's use simple words and with a cheat sheet at the end of the video, I'll show you how it works SP:SPX BITSTAMP:BTCUSD
What is the FED
The Federal Reserve is a network of financial institutions that together make up the central bank of the United States of America.
Why is the Fed cutting rates?
When the economy is not doing well, the FOMC can make interest rates lower, encouraging people to take out loans and stimulate economic activity.
What happens when interest rates rise
Central banks raise rates when there is a high risk of recession and stagflation (high inflation, very low GDP growth)
The higher the rate, the more expensive money is for banks and, as a result, loans become more expensive for the entire economy.
A rate cut means a reduction in the cost of loans.
Bitcoin, due to its large capitalization, has become highly correlated with traditional markets
A change in the rate affects the entire money markets. An increase in discount rates leads to a decrease in the cost of bonds and an increase in yields across the entire class of fixed income instruments. Bank deposit rates go up, and bond yields go up for investors. And vice versa.
Use this cheat list like visualisation of potential market upcoming moves

Channel tradingHow to trade channels after sharp moves, where there is a valid money flow in the market.
During this short video I just described one of very common and useful techniques that is applied for channel trading, which is for this video scalping, but it applies to all time frames.
Here you need to get confirmation and be patient for pull back, it is important to put your stop loss precisely and of course be loyal to it (please do not move it)
Put the stop loss under that shadow but with enough space for breathing

Full 2 month Review Of Yokub_Umedovich analysisSee Full video and enjoy how is real Trading analysis
BINANCE:BTCUSDT.P BINANCE:COMPUSDT.P BINANCE:KNCUSDT.P BINANCE:LTCUSD.P BINANCE:DOGEUSDT.P

Blueprint to Success: How to Master Trading Sessions & Planning👑 Pre-Trading Sessions & Planning:
🔥 Key Details + Concepts
--------------------------------------
(Psychological, Technical & Concepts):
🟠 Psychological:
- Don’t trade if your emotions aren’t aligning with what is on the screen.
- If you’re not super happy about entering, and you don’t fully accept the loss, don’t take the trade.
- Don’t ‘force’ something to work because it won’t.
- Trade as if you are looking for buys and sells in your markup. This removes mental bias, and effectively emotion in trading.
🟠 Technical:
- Cause is the most important factor in trading – find what caused the injection of volume (‘follow the money’). Did it get effectively mitigated? Did it leave imbalance? … Find that block of orders and don’t get liquidated
- The more inducement respected, the more liquidity to take out, the bigger the move
- Zones to trade from must have resting orders to mitigate. Make sure they have inducement above/below (or create it), and they are the cause of structural breaks, demand/supply fails etc
- Start analysing on the daily first! Find the intention of price and follow it
- Mark out S/R – (support becomes resistance levels vice versa) as that level will be liquidated to usually meet our orderblock above/below it
- Previous daily/weekly highs/lows can act as strong structural inducement points
- Price needs reason to move to certain levels – imbalance
- Often when we have a low Phase 2 inducement, we will sweep it’s orderblock as a SMT because of the zone’s large imbalance = lack of inducement
- If you don’t spot the buyers/sellers who got swept before entering, you’ll become liquidated
- Mark out pullback zones too
- If we break our LPOD/S, we are effectively going to run through all mitigated price until the next valid orderblock
- Ensure you wait for your respective time-frame reaction (e.g., don’t look for a 1m reversal from a 4h zone)
- If price taps the outside of a zone but doesn’t enter it, it can still be used as inducement
- We don’t recommend stacking countertrend trades
- A mitigation can be confirmed when price sweeps into its previous range over another small-range inducement.
🟠 Concepts
- The demand/supply that took out the Phase 1 inducement then gets broken confirms a shift in market structure. If it is respected, we can trade a continuation.
- A ‘slight mitigation’ is when price sweeps liquidity into a range, but doesn’t properly mitigate the orderblock where the high-volume orders lie. Even though we may react from there, we can come back to this orderblock and properly mitigate it, using the ‘slight mitigation’ level as a point of inducement.
- It is important for the AR (automatic rally) to ‘fail’ in a reversal range after the B/SC (Buyers/sellers climax) as it often grabs the LPOD/S (the last point of demand & supply), so it is successfully mitigated
- News candles can be targeted high/lows as they don’t have inducement
- Price works with momentum. You will never see something shoot up or down randomly
- Refine zones by excluding the inducement it swept before it
– draw a line through the orderblock from the inducement it swept. This will refine your orderblock to the pure manipulation *has exceptions*
- If an inducement phase isn’t very clean or only sweeps a small range, there will be another opportunity as more manipulation is needed to fuel a larger move
- Weak highs and lows are determined after a leg has been properly mitigated; the 5-15m TF is best to determine an active zone
- A high/low is likely to be targeted when it wicks the other side’s high/low (to sweep) instead of having a candle closing over (BoS)
- The first part of a ChoCh is often formed from Phase 1 inducement getting swept, creating a slight pullback, then breaking it again to hit the refinement
Used Word Definitions:
- LPOD/S – Last point of demand/supply
- ChoCh – Change of character (a sweep of liquidity then a break of structure)
- BoS – Break of structure (a failure of supply or demand creating a price leg break)
- OB – Orderblock (a valid zone to trade from)
- FVG – Fair value gap (a form of inefficiency/price gaps in the market)
- IMB – Imbalance (a form of inefficiency/price gaps in the market)
- IPA – Inefficient price action (imbalance)
- S&D – Supply and demand (the levels of buying and selling)
- IFC – Institutionally funded candle (a candle created by institutions to push price to a certain area)
- IPB – Inducement Pullback (The level where price pullbacks before a continuation)
- PA – Price action (how price is moving)
- B2S – Buy to sell (often seen as a wick to mitigate or sweep)
- S2B – Sell to buy (often seen as a wick to mitigate or sweep)
- AOI – Area of interest (an area of price that is reactive or tradable)
- POI – Point of interest (a specific point where price is reactive or tradable)
- IND – Inducement (placement of liquidity that is used to manipulate traders)
- EQH/L’s – Equal highs/lows
- SMT – Smart money trap (a zone that doesn’t have liquidity under/above it, and gets run, trapping SMC traders)
- MSS - Market Structure Shift (a confirmed shift in the markets direction towards the next reversal zone)
- Vectors – Large-bodied, impulsive candles that are to push price to its purposeful target
- V-SR – V-Shaped Recovery (quick movement of price to enter and exit a zone)
- TF – Time frame
- FR – Failed Reaction (Internal supply/demand failure)
- OF – Order-flow (the movement of money through the market)
- True Zone – The actual orderblock that will be used which holds the high volume or orders
- PDH/PWH or PDL/PWL – Previous daily/weekly high/low
🟠 Colour Codes:
🟠 Time and Price (Times in AEST):
ASIA > FRANKFURT > LONDON > NEW YORK
- Asia: – Asia is important to analyse as it can create the model for New York and London its purpose is to create liquidity above and below its session. Mark the bottom and top to create a range, as well as the midline. Often, price will aim to take a high/low or both (AWS) starting with Frankfurt + London Open. If Asia takes a form of liquidity and is impulsive, a continuation trade can be played.
- Frankfurt: - Frankfurt often prepares London for its main movement of the day. It often does this by taking out the high or low of Asia to create an orderblock mitigation for London, creates more Phase 1 inducement for London to take out, or helps to move price to an already-made valid orderblock.
- London: - When London opens, there is a volatility spike in price. London’s purpose is to attack the liquidity created during Asia. Often, London creates a continuation mitigation after 1.5 hours, but can also contribute to a larger liquidity build-up for New York. Entries that induce + mitigate can be taken at the open (sometimes +30). After 2 hours of opening, we often see a shift in direction.
- Pre-NY: - Before New York opens, we often see an impulsive move that directly contributes to the New York session. Sometimes, we can create a valid zone for New York to play from by mitigating high-volume orders. Most often, we see an impulse in price to move into a higher timeframe orderblock to then become targeted liquidity, or we create more low timeframe reversal inducement to then be swept.
- New York: –We open with a volatile shift of momentum. New York’s purpose is to attack the liquidity created during the London session, or to create a continuation from London. The New York trap usually starts 1 hour after opening and reverses. After 1.5 hours of opening (MMM), we often see a clean mitigation of the ‘correct’ orderblock and liquidate the opening move. Sometimes, New York Open can mitigate the high-volume orders and continue in the correct direction of the day.
- London Close – mitigates the peak of NY open / Reversal for a continuation in NY open direction. Sometimes there is a mitigation-inducement before London Close.
- Magic Minute Mitigations (MMM) - refer to high probability trading times that mitigate active continuation orderblocks. We can best see these 1.5 hours after London and New York Opens – rarely, we can see these 3.5 hours after these opens instead.
In the next post I will continue with my 8-step daily markup process and my Asian session manipulation formulas.
If you found this article helpful, please share it with your friends and leave a comment!
Cheers!

Wyckoff Distribution Pattern in BitcoinMy friends
In my previous Bitcoin post, I suggested that Bitcoin is in a Wyckoff distribution pattern.
IMO, Wyckoff accumulation and distribution patterns are common in Bitcoin’s PA. I want to highlight similar distribution schematics I noticed in the last bear market.
I also provided a glossary of the terms used by Wyckoff traders. I used two books as sources (citations at the bottom), but the words and phrasing are mine.
I posted this TV idea as educational content. Nevertheless, I do not presume to “educate” you. Consider this as a suggestion by a fellow trader looking for your thoughts and feedback. So, what do you think? Are we on to something here? Yes, or no?
Bitcoin Distribution Pattern June14th– July 24th, 2023:
Bitcoin Redistribution June 18th – August 19th, 2022
Bitcoin Redistribution Pattern January19th – May 3rd, 2022:
Bitcoin Distribution October 6th – December 1st, 2021:
Glossary:
Automatic Reaction (AR): With the buying pressure exhausted, the price moves down sharply. This is called an Automatic Reaction. The low of this sell-off is the range low.
Buying Climax (BC): The point at which buying pressure reaches a climax. By this stage, institutional players (whales) and informed traders sold their allotted stocks to uninformed traders. From this point on, institutional traders begin to suppress the asset's price, preventing it from surpassing a set threshold.
Last point of Supply (LPSY): After breaking below resistance, the Price tries to rally above the former support, now flipped to resistance. Volume may be light or heavy, showing weak demand or substantial supply. At LPSYs, the last waves of distribution are being unloaded before markdown is to begin. LPSYs are good places to initiate a short position or to add to already existing short positions.
Preliminary Supply (PSY): The term describes a stage in an uptrend in which selling pressure creates noticeable resistance after a move up.
Secondary Test (ST): The price moves to the vicinity of the range high to test the supply and demand balance at this price level. If this is really the range-high, supply will outweigh demand, and volume and spread should be diminished as the price moves closer to the resistance area of the range high.
Sign of weakness (SoW): A Sign of Weakness is evidence that Supply is stronger than demand. A breakdown below a support level within the range (such as the mid-range) provides evidence that the MM favors lower prices. A failure to get back above support provides additional confluence to the bearish bias.
Upthrust (UT): An upthrust is a false breakout also called a “bull trap.” The MM initiates a break above the range high to trap breakout traders to go long. The upthrust also shakes out weak hands that already took a short position. The liquidity provided by the breakout traders and from triggering the sell stops of the weak-handed traders gives the MM the liquidity he requires to fill his short positions to trigger the downtrend.
Upthrust After Distribution (UTAD): This is the final shakeout. The basics of the UTAD are the same as the regular UT. Sometimes the UTAD reaches a higher price point than the previous UT actions.
Bibliography
Chaves, R. V. (2022). The Wyckoff Methodology in Depth.
Pruden, H. (2007). The Three Skills of Top Trading. New Jersey: John Wiley & Sons.
