Understanding Risk/Reward through Bitcoin's CME Futures GapsIf you like this analysis, please make sure to like the post!
I would also appreciate it if you could leave a comment below with some original insight.
In this post, I will be explaining the concept of the Risk/Reward Ratio, also known as the RRR, and the significance of this idea when it comes to trading.
I will also be explaining how this can be applied to Bitcoin's CME Futures Chart on the daily, in regards to gaps.
Analysis
- To begin with, Bitcoin's CME Futures chart shows a huge gap leading down to 9.6k
- Unfortunately, this gap is yet to be filled.
- Given that 99% of gaps that have been created get filled some time in the future, it's likely that this gap will fill as well
- However, solely approaching the chart from the perspective of gaps has its limitations
- For instance, the gap at 11.4k took almost a year to fill.
- As such, gaps don't provide us with a specified time frame as a reference
- Should we fill the gap right now, and bounce at gap support, that would be a 7% move downwards from the current price
- Should we see a stronger bearish price movement that extends below the price gap, we could see a 15% move downwards based on support levels
- The gap support at 8.8k converges with the descending trend line support on the weekly, as well as the 0.5 Fibonacci retracement support (refer to our previous analysis)
- As such, it's reasonable to conclude that a bearish price movement over 15% is less probable.
- On the bright side, it's also important to note that there are some gaps above the current price, indicating potentiality for bullishness
- There is a wide gap at 10.5k levels, and another one at 11.4k
- Given this information, we can estimate our risk/reward when entering a position at current levels
- Splitting our entries into three different levels, we can:
1. Enter at the current price of 10.2k
2. Dollar Cost Average (DCA) at the 0.382 Fibonacci retracement support at 9.4k
3. Enter at gap support around 8.8k
- This way, we know that our risk is limited, and that the upside remains huge, due to the overall trend being bullish.
- Based on significant support and resistance levels, a trader would then calculate his stop loss target and take profit targets according to his risk appetite.
Conclusion
The trend is your friend. While the short term trend may appear bullish, it could be said that the overall trend for the long term remains bullish. As such, it would be better to look for spot/long entries near support.
Don't predict the market. Take it by levels, and play by probabilities.
- Michael Wang-
Bitcoinprice

Crypto Untapped Educational Series EP. 2: Drawing S/R LevelsIn today's episode, we review support and resistance as levels. We explain why price action moves the way it does via buyers and sellers and how to enter/exit based off liquidity in the markets. Enjoy!
DISCLAIMER: Investing into cryptocurrency comes with inherent risk including technical risk, human error, platform failure and more. Invest at your own risk. None of our content is to be construed as financial advice, we are a cryptocurrency education platform.

BITCOIN Retest of $8,000 - WYCKOFF DISTRIBUTION Tutorial Now, I wanted to take a look at something here. I am new to using the Wyckoff Method for the distribution phase of a chart's characteristics, So this for me is a lesson in time, I want to see how well our charting and recognition here actually come true.
In this area, there are Phases A-E
A fantastic write up here about this type of charting pattern. medium.com
Quoted Misconceptions
There are a lot of misconceptions around distribution but not quite as many as with accumulation. I imagine this is because people are naturally more bullish than they are bearish. The major misconception usually occurs with assumption that an asset that has been in a strong uptrend will automatically enter a period of distribution at its “top.”
A little like accumulation (when a coin has bottomed) the first instinct should be to look for the Wyckoffian concept that supports the continuation of the trend. You should be looking first and foremost for signs of reaccumulation with a check on distribution.
This is one of the primary reasons I enjoy charting with Wyckoff so much. It allows me to follow the trend and chart accordingly, but at the same time it forces me to check my bias and prepare for an option that may cause the end of the trend in the short, medium or long term.

1ST LESSON FOR CRYPTO TRADING BEGINNERSJourney begins today with this 1st lesson for beginners. Jumping on the quick and profitable trading strategies is secondary. Primary objective of Cryptocians account is to provide ground level basic knowledge for beginners right from what are candle sticks and how do the perform, to how to plot strategies and trend lines.
Of course in couple of months you will see our ideas for making call for action profitable strategies.


Continuation patterns - Bitcoin forming a Bear FLAGA trader can spot trend extensions with the help of bullish or bearish continuation patterns, which occur in a variety of easily identifiable shapes, some of the most popular of which are known as bull and bear flags.
A bull flag is appropriately spotted in an uptrend when the price is likely to continue upward, while the bear flag is conversely spotted in a downtrend when the price is likely to sink further.
(While the implication of the pattern is far more important than its name, the “flag” terminology derives from its visual similarity to the fabric you’d see hanging outside a government building.)
Each flag pattern consists of two main components: the pole and flag.
The “pole” represents a strong impulsive move (higher/lower) and is backed by a surge in trading volume and the subsequent pause or consolidation the “flag,” which looks like a falling or rising channel.
The flag pattern can be invaluable for a trader in that there are clear points of success and failure to profit or mitigate risk from. If resistance breaks in a bull flag, the trader can be confident price will continue upwards roughly the length of the pole (popularly known as measured height method).
If support of the bull flag is breached, the trader knows the pattern is invalid and continuation is unlikely. The exact opposite is the case for a bear flag.
Is this method 100% safe?
Bull flags and bear flags can be a trader’s friend in strongly trending markets, but they do not always perform as advertised. In some cases, the pattern can present a trap known as a “false breakout” when price breaches the boundary of the flag and quickly retraces.
Waiting for a candlestick to close outside of the flag tends to add credence to the breakout, and can help the trader mitigate risk.
As a trader, you would want to avoid betting or punting on an asset price if the bull flag breakout of bear flag breakout is not backed by strong volumes. A low volume move usually ends up trapping investors on the wrong side of the market.
Further, using indicators like the Relative Strength Index (RSI) to gauge scope for a rally following a breakout can help boost traders’ success rates.
If you like it, please support it liking and following!
Thanks!

Debate 'Safe Heaven' Bitcoins- Skyrocket Coronavirus nCoVid2019Hello my dear traders and friends,
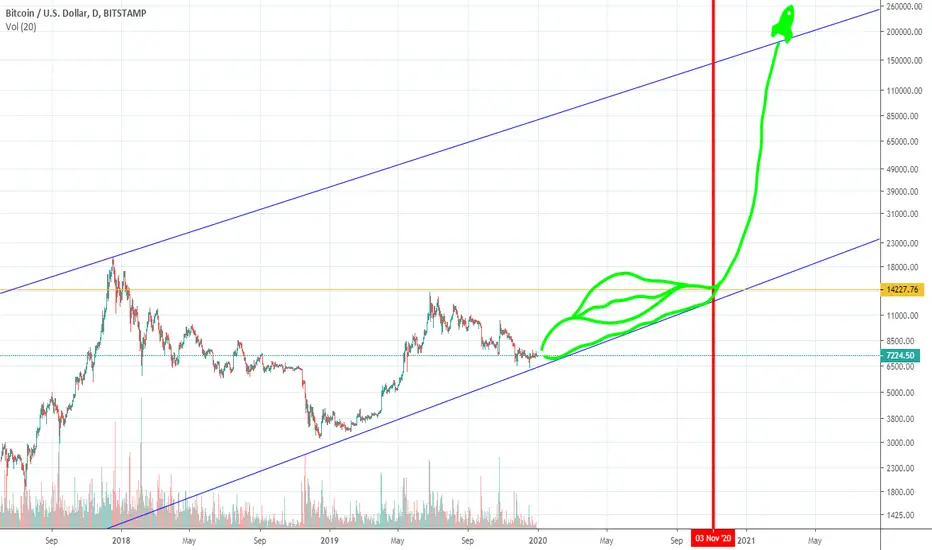
As you can see the Bitcoins chart, the value has skyrocket in 2 months after the first major outbreak pandemic coronavirus on January 2020. People start to buy the bitcoins and the value increase towards the sentiment.
They thinking this bitcoins will be the safe heaven towards this pandemic. For the reason, if you move towards to other countries you can sell it online anytime.
This is their perspective which cause this element to bullish. For most people, they tend to see bitcoins can be really the safe heaven money.
In my opinions, the bitcoins is just only worth the credit and it against the fiat currencies towards the major Dollar. While Dollar also has decreased its value as what we can see the central bank trying to adjust so many times the interest rate and clearly they do not know what their doing.
It is a bitcoins that digital currencies which the value that something you do not own. It is just a value and with not many countries accepting the change towards the bitcoins currency. For the I put it bitcoins is a new currencies which we do not own physically but it is still a fiat currency that non-physical.
I just want to records this as my journal and put my ideas towards this currencies. Yes of course I do trade bitcoins but to the somepoint which I do not agree where this digital currencies is be in the sentiment that people look as describe the 'safe heaven' currencies. As what like we saw on the historical and let the history of the Dollar speak for itself.
For the past of bitcoins history, BTC also has got some major crash long time ago and this also happen on the fiat currencies as well.
WIll people purchase the BTC as long this pandemic coronavirus in the background ? Or is it just a sentiment only ? Will Bitcoins drop when all the sentiment towards the virus disappear?
As what I can conclude, this is just a trend. When the trend is over, people will less demand towards it. The price will drop and more event in the future caused it to be skyrocket as well. It is just a pattern.
By Zezu Zaza

W bottom BTCUSD SHORT We have yet another W bottom; certainly a common theme in the hundred and dozen or so publications I’ve done this far.
Frustratingly trying to deal with this glitch that’s slicing my publications and rap as well as followers and all that stuff into two different accounts also preventing me from intraday trading on my pro account ironically so while they get sorted out (Check my chainl link publication for more info - Case anyone wondering why I feel the need to mention this is strictly due to the four or five people that actually read my publicationsCase anyone wondering why I feel the need to mention this is strictly due to the four or five people that actually read my publications so I did not want them to feel like I have been in them so rest easy loyal friends —- did not want them to feel like I have abandoned them, more like a temporary sabbatical while I sort this issue out.
In the meantime I would implore you to check my Twitter/Linkdeln for any updates.
I take it in this matter will be resolved within the week.
W bottom signaling parabolic movement and time frame shows the short position I would take for anyone looking to dump before retracement and as always read horizontal represents the stop loss which is the figure you should always go for— Regardless of how bullish you believe the market is.
Trade safely have a wonderful day and DM me if you have any questions or concerns.
Happy birthday to my brother/best friend, Adam!
Ll
Peace & Love
-@a1mTarabichi
Disclaimer
Market is extremely volatile so please keep that in mind do not FOMO or FUD and this is not financial advice.
- Note: My main account just like all my other handles I. E. Twitter/ Linkdeln (among others) Is
– a1MTARABICHI
The glitch/duplicate account is identical just minus the M & 1 so “atarabichi” And so just pay attention to the same one that I’ve always been posting on there and that is the main one (Also the only one with the pro green badge) Hopefully does not cause too much confusion and will be fixed sooner rather than later
Have a great evening once again
-mT

Only one day will matter.fake volume will continue, until after the election.
you dont pay the space force with paper.
pray for eace
Wake me up when Bitcoin reaches 318kSometimes I think bitcoin's perfect price progression is not by accident. Let's see what happens in 2020.

Possible bitcoin Wave Count still VALIDIf yu have Questions reading trading plan from chart, plzzz ASK Me!!!
Cheers,
bitATX

BTC/USD MOMENT OF DECISION - COMPLETE BEGINNER'S WALKTHROUGH10 minute read, you have been warned.
This will be a detailed walkthrough comprised of key points for both the bulls and the bears. Technical analysis will be done at a beginner-intermediate level. Readers are encouraged to look up vocabulary they do not understand, because hey, it's almost 2020, everyone can use Google and TradingView has their own wiki.
We will begin with fundamental analysis.
Why is crypto worth anything? Why are there trillions of dollars in this relatively new financial space? Is it a castle in the sky? Is it actually a valuable asset? Why does this weird mathematical abstract thing have value? Why?
To answer questions in order to support a fundamental long or short stance on any asset or stock .. screw it, anything that you can attach a price to that may change over time: you have to dig pretty deep into the woo-woo of what's really going on in this world. Just stick with me for a bit.
Why does anything have value at all?
Do we value a material or abstract good for the ownership of the object itself?
No, of course not. We want things for their services. Scarcity of these services drives price gain. Better services are also more expensive for a single unit.
Lets compare crypto to fiat in terms of their services:
Oh also, we will examine the
C - Confidentiality
I - Integrity
A - Availability
of the asset. These are the three core pillars of web security, and can easily be extended to judge the overall security of a digital asset. I pulled this straight from my college senior level Computer Security textbook, by the way. Really dense read, but worth every word if you want to truly do fundamental analysis on blockchain assets. It's pathetic how quickly some of these fintech guys will fall apart as soon as you start to poke holes in their whitepapers over their security. Also yeah, let me call one of them out: IOTA. Are you guys serious? Do you think you have Google-level ability to hire swarms of CS Security PhDs for 200k a year in order to make sure not a single self-driving car, or heck, even a toaster gets hacked? I mean, you guys are seriously trying, I see that, but making the leap from blockchain to DAG right now is totally not okay. In theory, yes, it is that much faster, but you're basically trading the 51% attack for a whole new host of bigger issues. A bigger institution needs to take on this task. I'm looking at you Amazon: this is the big takeover chance for you guys. If Amazon ever drops a DAG crypto, buy it to the moon, because it would just fundamentally revolutionize capitalism itself.
Anyways, crypto vs fiat:
Crypto:
Anonymous in most cases - High Confidentiality
Public/private key cryptography allows for public read access of the blockchain for Integrity purposes
Very secure, mathematically sound (Take it from a Silicon Valley fintech wiz: I have personally done basic CBC-blockchain encryption. It works. I've done frequency analysis on byte-code output, tried to calculate mathematical brute force solutions against blockchain type encryption. Totally solid, and verified by mathematicians worldwide. It'll be fine until quantum computers.) - Top Integrity
Cannot be counterfeited or forged - Top Integrity
Cannot be robbed in most cases, especially cold-storage hardware wallets - High Integrity
Low-transaction fees and fast send times for modern blockchain (ERC-20 and better) - Good Availability
Huge liquidity in terms of market cap of stablecoins and volume between core assets like BTC/ETH/stablecoins, accessible from any $100+ smartphone - High Availability
Limited supply of key assets forces scarcity - Bad for long-term availability of symbolic and valuable precious digital assets, ie. BTC/ETH/LTC
Good store of value - long term view for crypto will never hyper-inflate
Fiat:
Used for person to person transactions in (usually) small quantities
Circulated heavily through banks and tied to government identification - No Confidentiality
Bills are tracked by government, leaving a paper trail regardless - No Confidentiality
Can be counterfeited, forged, and stolen in some cases - Low Integrity
Available everywhere, except tied to nations. USD is not true international currency, and you're better off with an international travel credit card with no transaction fees than actually try to carry tons of fiat to the country you're visiting and eating arbiter fees, especially if you need to be all over the place. - Neutral Availability
USD is loaned out to US by China. Federal bank increases the interest rate to cheat debt. Every US citizen and corporation holding fiat, even the government itself, loses value. USD is not backed by gold since 1970. Inflation rates have been triggering exponential growth indicators for the last 30 years: aka. run-away inflation risk is high. Saving for retirement in USD probably not the best call for young people today. Bad store of value.
I'm not slamming fiat. It's nice, it's not heavy, and that stuff is pretty. And tangible. But paper money has been out since the printing press, and you can look that date up yourself. It's old tech. Crypto is new tech, so of course it wipes the floor with fiat in every category of fundamental analysis, especially when it comes to security. We have reached the tipping point where crypto is hitting critical levels of AVAILABILITY. Anyone with a crappy 5 year old refurbished cellphone and decent 4G can start buying and using cryptocurrency to its full capacity. Do you know what that means?
1) People should be willing to pay a premium for crypto assets because they provide a better service than fiat.
2) Developing and third world countries now have access to crazy stuff like crypto backed credit lines that have more 3% interest on stablecoin collateral than APY ????!? (I'm looking at you Nexo) Are you telling me that the oppressed masses of the world now have access to financial firms that don't check your identity and give you rates SOLELY based on your FINANCIAL CREDIBILITY and NOTHING ELSE?
If you hate dealing with real world problems, skip number 3.
3) Look, this world is completely effed if nothing changes. If we don't fix greedy unchecked accumulating wealth exponential growth with no regard for sustainability capitalism right now, Mother Earth is going down and she's going to take us with her. Close out this article if you don't agree with me, you shouldn't be trading anyone's money. There is a theory that roots in classical economics about this: infinite growth theory. That if we accumulate wealth and invest it, the dividends of the future outweigh the damage we're doing now. That if we double down on technology, we can cheat the rules of this Earth. If the fish die, we find a substitute. Everything can be substituted, even the trees, we'll make plastic and artificial ones. When all the oil runs out, we'll just have better technology by then. Capitalism is already as good as it can be, and we should just laissez faire to the max and everything will be fine. Don't worry about it.
Okay, that theory is 60 years old. And based on ideas that are even older. When we were bootstrapping ourselves towards the stars as humans, firing the first steam engines and cranking the first pulley driven mills, we had no clue what was about to hit us in exactly 130 years. The internet? Computers? Artificial intelligence? Hello? Nothing was really abstract at the time. Everything was pretty human to human in the 1850s. This may as well be dystopia ... or utopia to a time traveler coming from the 1850s. We are at a tipping point, not only in crypto, but the financial flow of the world. Technology is about to hit that point of accumulation where it is ready to truly take off. I won't rant about AI singularity right now, but all I'm saying is we have the mathematical tools, theoretical ideas, and accumulated capital in the hands of a few visionaries to really take off technologically right now. But the thing is, the timing isn't right. What the heck are we using AI for these days? To turn the lights on and off for us when we cross the doorway of our home? To make really crappy celebrity memes? We could really help the world with this technology.
And blockchain currency is the gateway to that technological advance in a REAL direction. Because crypto will allow the oppressed of this world easy access to the ability of bootstrapping themselves. And when their voices are heard because they too move the waves of the great financial market, we will have to listen to them as a collective. Maybe we can all agree to double down and go long on sustainable, long-term growth as a world. That's my vision for crypto, and that's fundamentally why I will always be long.
CURRENT MARKET ANALYSIS:
Fundamentally, we are long on crypto for the aforementioned reasons.
We are looking at the long term trend, each bar representing a week of time.
We can peer back about a year and a half at this zoom level to see what we can find in terms of trends.
Purple dashes is the top of a long descending channel from the all-time high of the chart.
Magenta dashes (hard to see) is the bottom of the same channel.
Green dashes along the green ribbons is recent bullish pressure.
Recently, price broke below aggressive bullish trend. Currently price is cutting into some of the long term MMAR ribbons. As such, we can see the squeeze breaking downward. MACD is swinging back towards 0 as some of the long term supports provide brief reprieve. Sell volume is slowing down below average levels. We are seeing some consolidation and weariness in the market. The bottom MMAR ribbon is located around 7300. We have not broken below that support, which coincides with Kijun-sen of the Ichimoku Cloud. The cloud is represented by the greyed out area.
Critical things to watch for:
MACD signal line is about to go negative, amplifying future sell signals.
Squeeze accelerating downward and can break the market downward at any moment.
ADX possibly retracing upward as Stochastic MTF peaks and troughs at the 30%-70% levels means a breakout in either direction is possible, and will be very violent when it happens. I believe from the MA that the price will continue to fall. There is also a DI+/DI- crossover (DI+ green, DI- red, ADX blue lines on the second up from bottom chart). If these lines diverge in their current trajectory combined with a spike in ADX and volume we could see the price obliterated below all current "normal" psychological baselines. If we break below 7300, free-fall to 5k-6k levels are likely. If the price breaks the long-term conservative downward channel with enough momentum around 4800, which coincides with the Senkou B line, we might just be dead for awhile. Accumulation would have to begin around absolute baseline levels of 1k-3k. Depends on how greedy and willing to be patient the whales are. And if I know anything about whales, they are THE MOST GREEDY and PATIENT people. The next moonshot upward will test something like 11350 to be safe, but we could just slingshot lunar orbit and keep going if the bull run is epic enough. Nothing is set in stone. Nothing is destiny. At a certain point, this is just cooperative abstract modern performing arts with numbers and math and prices.
If you're not playing with margin, wait a few weeks for maybe new supports around 5k-6k or lower. Just wait to buy at the true bottom. If you are margin or future trading, play risk safe as shakeouts are always possible in an unsure market. Ultimately with the proper stop-losses and the right risk management, even a small short position can become hugely profitable in a free-falling condition. Just don't forget that eventually the momentum will always retrace into a long term buy-signal. Anything can happen at any time with a massive volume spike. Watch for that as final confirmation of opening a medium to long-term position.


BTCUSD Bullish momentum confirmationWhat a beauty move.
But be honest...who didn't saw that guys? Just need some manual draws on RSI(20).
RSI(20) breakout once, than confirmed twice.
Look what caused this on the candles chart:
What's next?
In the next 45 minutes (before the next 1H close) bitcoin will decide : which direction to keep before this weekend.
Be safe: it could be a big bulltrap before weekend - and whales could be tricky, thats why I'm preferred the a SHORT position soon near to 11k - hedging against current profitable LONG.
CONCLUSTION
* RSI(20) not only good for detecting divergences ( I've wrote a good article here ), but also good for finding the right momentum to entering a trade.
* Don't use '"trade and pray" strategy ... it's a noob's way. Better to entering into confirmed trend via the momentums.
If you have any technical analysis question - I will answering it today in the comment section!

Bitcoin 2022..!!#BTCUSD #BTC (Mission 2022)
1 BTC = $25000 In 2022
What Is Bitcoin ??
Bitcoin is the most secure and robust cryptocurrency in the world, currently finding its way across the world of business and finance. Bitcoin was thought of as Internet money in its early beginnings. Unlike fiat currencies Bitcoin is a decentralized currency. That means that a network of users control and verify transactions instead of a central authority like a bank or a government.
Up to this day, Bitcoin uninterruptedly works as money one person pays another person for goods and services. Once Bitcoin is exchanged, the record of the transaction is publicly recorded onto a ledger known as the blockchain, which other Bitcoin users, known as miners, verify by putting those transactions into a block and adding it to the blockchain after Proof of Work (PoW).
After a certain amount of transactions have been verified by a miner, they will receive newly minted bitcoins for their work and thus new bitcoins will be added into circulation, while the number of bitcoins in circulations are now in the multi-millions range, the maximum amount of bitcoins that can ever be created is capped at 21 million. The creation rate is automatically halved approximately every four years as more bitcoins are added into circulation, whilst this system is modeled after gold, mining difficulty is always increasing as hashrate increases and makes finding new bitcoins harder as the number of available bitcoins reaches the 21 million cap.
As bitcoin has matured as a cryptocurrency, there have been more companies warming to the idea of using various bitcoin exchange facilities to gain exposure to the volatile bitcoin price while a few websites such as reddit WordPress and overstock have begun accepting Bitcoin, most major retailers have yet to take the plunge into Bitcoin.
Satoshi Nakamoto Founder Of Bitcoin
Satoshi Nakamoto is the name used by the unknown person or people who developed bitcoin, authored the bitcoin white paper, and created and deployed bitcoin's original reference implementation. As part of the implementation, they also devised the first blockchain database.In the process, they were the first to solve the double-spending problem for digital currency using a peer-to-peer network. They were active in the development of bitcoin up until December 2010.
Hit Like On Idea For Our Support & Motivation..
Please Follow For More Interesting Ideas.
Thanks

Bitcoin -a brief history of the "confirmed" bull markets 2018-19Hi guys!
I have decided to create this diagram to show you, how majority of the crypto community has reacted to every single
counter trend rally (and "trendline break" ) from all time high to present.. I am almost sure that these series are not over and we will see a couple of more "definitely" confirmed bull markets all the way down to real capitulation.
All the best and, take care a stay patient!
-DP-

Bitcoin Next All Time High, Nov 2021 (?)Todays education is proudly brought to you by BestThingSinceSlicedSatoshi, the FREE and very profitable Buy and Sell indicator. Add it to your favorites at the link below.
Analysis based on my ACCURATE buy and sell indicator on the Bitcoin Monthly chart, Heikin Ashi candles.
My script (Blue line) = Buy when it crosses zero from beneath, sell when it crosses zero from above.
Looking at the blue line, we see the last bottom in 2015. In Jan 2019, we hit the same value (approx) - could that be bottom ? Maybe. If it is, and price action is a mirror reflection of what it was from 2015, then we can expect to see the next ATH Nov 2021. Between now and then, ACCUMULATE.
Disclaimer: This is not investment advice. Feel free to not believe a thing and do your own homework.
Sincerely,
BestThingSinceSlicedSatoshi.
Pity they don't make Satoshi bread anymore.


BTC manipulation. Big boys game vs Bakkt delays. What's next?
Hi everyone, I am looking to Bitcoin from another perspektive.
Why this drop happens in this strong months?
Why Bakkt delays Bitcoin futures launch?
Why is drop start one day before Bakkt info public?
Big players play with us and with hodlers, they want to BTC cheap, Institutions buy bitcoin cheap for your futures interest.
Is Bitcoin for 3-4000usd cheap enough?
I think that this players after 20. November just accumulate Bitcoins, new wallets with big transactions open after drop, this can be last chance catch this price.
Wallets: bitinfocharts.com
Look at second wallets or another.
If you have some idea about this or futures for price BTC or another perspective please leave in comment.
Dont forget likes or follow :)
Thank you

Correlation continuesBitcoin and the stock market continues to correlate as news this morning started to cause markets to sell-off, which has resulted so far in a drop in Bitcoin shortly after.
We have to continue to keep an eye on this because they have been following each other closely.
Thanks guys

Bitcoin - Why Most Traders Lose In This Market - Sentiment CycleHello Traders,
In this educational, I want to point out why many traders lose in trading.
It does not really matter what instrument you are trading, whether it is cryptos, forex, indices, commodities etc. I did a lot of research and wanted to provide you some bullet points why YOU still not made it so far in trading or at least not satisfied of what you have thought trading would give you back.
First of all, let me start with a simple question. Why do we even start with trading? Most traders started trading for one reason. To make MONEY! If you look today, how simply you can access the financial markets it becomes kind of scary. You can access educational stuff on the internet about trading strategies and you simply have to open a trading account and implement the strategy which you found on the internet and we all become rich right?
Well, unfortunately, that is not that easy and we all know that. At least advanced traders. When money comes into play as a tool to make money, there is a very important factor: Trading Psychology.
The overall goal which we want from the crypto market is very clear. Making money in a fast way. What does that mean now? Well if you make money today there is always a loser on the other side. That is how it naturally works!
We as traders, will also deal with losses, again and again and again. We need to understand first, that it is how it is. We can’t win every trade. We can’t even win 95% of all our traders. If you are good you will win maybe 60-65%. So the other 35-40% we will lose our money. And that is the problem for new traders in my opinion! An unsuccessful trader or new retail trader can NOT and also don’t want to deal with losses! They get very emotional and try to face the loss with overtrading, trying to recover the loss on the same day with higher position sizes or risking more than initially thought. That is emotional trading and those traders won’t last for long. Believe it or not, that is a fact.
By losing money you have earned so hard maybe with your 9-5 job, you obviously become emotional when you start losing it in trading. I do understand this point. But the markets especially the crypto market dont care about you becoming emotional. It will just wipe out your whole account when you get emotional. When you start making money and your account starts to rise you will get excited, by thinking you beat the market. However, a falling account will put you in scary position, where you think twice whether the strategy is working or not.
If this applies to you, you need to learn to control your emotions and concentrate on the main thing: “Capital prevention” Why? Because when you can keep your capital in trading you will automatically make money. You are a money manager at the end of the day. You don’t want to lose your money rather you want to keep it and cumulate it to growth. This will bring you into an advantageous position.
Your risk and emotional behavior changes depending on profits or losses. For example, if you win 4 or 6 trades in a row without booking one lose and you risk maybe 3% with a risk to reward of let say 2. You made over of 24%-36% in profit. At this stage an unsuccessful trader starts to think that he is the hero and starts putting more risk into the upcoming trades. Guess what. Eventually, he will lose all his profits he may gain earlier. Because losing is a part of the game. And I even didn’t mention the drawn loss. If you can win 4 or 6 trades in a row. You can also lose 10 trades in a row after you won 6 trades in a row. You become impatient and in the end, you will also lose your objectivity because you lost a lot of money. The key is always to win more than you initial lose.
That is the key to success in trading. If you always risk 2% on each trade with a constant risk to reward of 2:1 you will be profitable in the long run. (Obviously, with the right trading strategy, risk management and right traders mindset of course)

Be Careful of Bull Traps Be careful of the bull traps in BTCUSD, we've seen plenty of them lately, don't enter long until price clearly breaks the daily trendline.

The Double Bottom Reversal is a bullish reversal pattern!The Double Bottom Reversal is a bullish reversal pattern typically found on bar charts, line charts, and candlestick charts. As its name implies, the pattern is made up of two consecutive troughs that are roughly equal, with a moderate peak in-between.
Although there can be variations, the classic Double Bottom Reversal usually marks an intermediate or long-term change in trend. Many potential Double Bottom Reversals can form along the way down, but until key resistance is broken, a reversal cannot be confirmed. To help clarify, we will look at the key points in the formation and then walk through an example.
Prior Trend: With any reversal pattern, there must be an existing trend to reverse. In the case of the Double Bottom Reversal, a significant downtrend of several months should be in place.
First Trough: The first trough should mark the lowest point of the current trend. As such, the first trough is fairly normal in appearance and the downtrend remains firmly in place.
Peak: After the first trough, an advance takes place that typically ranges from 10 to 20%. Volume on the advance from the first trough is usually inconsequential, but an increase could signal early accumulation. The high of the peak is sometimes rounded or drawn out a bit from the hesitation to go back down. This hesitation indicates that demand is increasing, but still not strong enough for a breakout.
Second Trough: The decline off of the reaction high usually occurs with low volume and meets support from the previous low. Support from the previous low should be expected. Even after establishing support, only the possibility of a Double Bottom Reversal exists, and it still needs to be confirmed. The time period between troughs can vary from a few weeks to many months, with the norm being 1-3 months. While exact troughs are preferable, there is some room to maneuver and usually, a trough within 3% of the previous is considered valid.
Advance from Trough: Volume is more important for the Double Bottom Reversal than the double top . There should clear evidence that volume and buying pressure are accelerating during the advance off of the second trough. An accelerated ascent, perhaps marked with a gap or two, also indicates a potential change in sentiment.
Resistance Break: Even after trading up to resistance, the double top and trend reversal are still not complete. Breaking resistance from the highest point between the troughs completes the Double Bottom Reversal. This too should occur with an increase in volume and/or an accelerated ascent.
Resistance Turned Support: Broken resistance becomes potential support and there is sometimes a test of this newfound support level with the first correction. Such a test can offer a second chance to close a short position or initiate a long.
Price Target: The distance from the resistance breakout to trough lows can be added on top of the resistance break to estimate a target. This would imply that the bigger the formation is, the larger the potential advance.
It is important to remember that the Double Bottom Reversal is an intermediate to long-term reversal pattern that will not form in a few days. Even though formation in a few weeks is possible, it is preferable to have at least 4 weeks between lows. Bottoms usually take longer than tops to form and patience can often be a virtue. Give the pattern time to develop and look for the proper clues. The advance off of the first trough should be 10-20%. The second trough should form a low within 3% of the previous low and volume on the ensuing advance should increase. Volume indicators such as Chaikin Money Flow , OBV and Accumulation/Distribution can be used to look for signs of buying pressure. Just as with the double top , it is paramount to wait for the resistance breakout. The formation is not complete until the previous reaction high is taken out.
