Anatomy of a Breakout: How to Spot It Before It Fakes You OutFew things in trading are as appealing as a breakout. The chart tightens, volume starts to stir, headlines align, your alerts start going off , and suddenly — boom! Price explodes above resistance. Your adrenaline spikes and you pop open that long.
But just as often, that breakout turns out to be nothing more than an expensive head fake. Price stalls. Sellers swoop in. Your stop gets clipped. And now you’re sitting there, blinking at your screen, “Welp… that was quick.”
Welcome to the bittersweet world of breakouts — where opportunity and deception dance like partners at a high-stakes poker table.
📢 What Is a Breakout, Really?
Let’s get the basics out of the way: A breakout happens when price pushes beyond a key support or resistance level that’s been holding for a while.
That level could be a previous high, a consolidation range, a trendline, or a psychological number that traders obsess over because humans love round numbers (did someone say Bitcoin BITSTAMP:BTCUSD at $120,000 ?).
The logic is simple: Once price clears a well-watched level, trapped shorts have to cover, new longs pile in, and momentum feeds on itself. That’s the dream scenario.
But markets aren’t always that generous. For every clean breakout, there are a few fakeouts lurking — luring in overeager traders with the promise of easy money before slamming the door shut.
⚠️ Why Breakouts May Fail
If breakouts were easy, we’d all be rich. The problem is that breakouts attract a special kind of crowd: late-to-the-party momentum chasers, breakout algorithm bots, and retail traders who read one blog post about technical analysis.
The moment price nudges above resistance, FOMO kicks in. Volume surges. But if the move isn’t backed by genuine institutional buying (you need lots of billions to move the needle nowadays), it quickly becomes what seasoned traders call a “liquidity vacuum” — thin air where the only participants are you, a few equally optimistic Reddit threads, and market makers more than happy to take the other side.
Sometimes breakouts fail because:
The move lacked volume confirmation.
Macro headlines shifted mid-breakout.
A key level was front-run, and the real buyers have already taken profit.
It was a deliberate trap set by larger players to hunt stops before reversing.
Or — more often — the market just needed an excuse to shake out weak hands before resuming the actual move later.
🍸 Volume: The Truth Serum
Let’s be very clear: Breakouts without volume are like dating profiles without photos — you should be suspicious.
When real breakouts occur, you’ll usually see strong accompanying volume. That’s your proof that big players — funds, institutions, serious money — are committing to the move. No volume? Maybe the summer vibes are already here .
Smart traders wait for confirmation:
Is volume above average relative to recent sessions?
Is price holding above the breakout level after the initial pop?
Are follow-through candles printing convincingly?
Are we seeing continuation across related sectors or instruments?
Without these signs, that breakout candle may just be a cruel joke.
🤯 Breakout Psychology
Breakouts prey on two of the most dangerous emotions in trading: greed and urgency. The market whispers, “If you don’t get in now, you’ll miss it.”
This is where breakout psychology becomes more dangerous than the chart itself. Once a breakout happens, most traders are no longer analyzing — they’re reacting. They buy late, set tight stops below the breakout level, and become easy prey for stop-hunting algorithms.
✨ Types of Breakouts
Not all breakouts are created equal. Here’s the lineup you should be watching for:
Clean Breakouts:
The rarest and most beautiful. Strong move, high volume, sustained momentum. You’ll know it when you see it — or after you’ve hesitated and missed it.
Fakeouts (a.k.a. False Breakouts):
Price nudges just past resistance, triggers breakout orders, then swiftly reverses. Designed to shake out breakout traders before resuming the original trend.
Break-and-Retest Setups:
Often the highest-probability trades. Price breaks out, then pulls back to retest the former resistance (now support). If buyers defend this retest, you’ve got confirmation.
News-Driven Breakouts:
Triggered by earnings, economic data, or political events. Volatile, fast, and often unsustainable unless backed by real fundamental shifts.
📈 The “Pre-Breakout Tell”: Reading the Tape
Good breakout traders aren’t just watching levels — they’re watching how price behaves near those levels in advance.
Tight consolidation? Lower volatility into resistance? Declining volume as price grinds higher? That often signals an impending breakout as supply dries up.
Conversely, choppy action with large wicks and erratic volume often signals indecision — ripe conditions for failed breakouts and fakeouts.
Tape-reading matters. The cleaner the structure before the breakout, the better your odds.
💰 Breakout Traders Need Thick Skin
Even with perfect analysis, breakout trading requires accepting that many will fail. That’s the game. Your job isn’t to nail every breakout — it’s to size your positions properly , keep losses small when faked out, and let the clean breakouts run when you catch one.
Stop-loss discipline is everything. Breakouts are binary events: you’re either right quickly, or you’re cutting the trade quickly. There’s no room for “maybe it’ll come back.”
The most painful breakouts are the ones that fake out, stop you, then continue in your original direction. Every breakout trader has lived that nightmare. Accept it. Build it into your risk plan.
👉 Takeaway: Prepare the Setup, Anticipate the Fakeout
Breakouts will always be part of every trader’s playbook. But they require discipline, experience, and an iron stomach. The market loves to tempt you with early signals — your job is to separate signal from noise.
Pro tip: Start your day by checking the Economic calendar and browsing the latest news — staying informed (and witty) helps you build better context for smarter decisions.
So before you chase that next breakout candle, ask yourself:
Is volume there?
Is the broader market supportive?
Have I managed my risk before clicking buy?
Because in trading, the only thing worse than missing a breakout… is getting faked out and blowing up your account chasing it.
Now over to you : Are you a breakout trader or a fakeout victim? Share your best (or worst) breakout stories — we’ve all been there.
Breakout

A Step-by-step Guide to One of the Chart Analysis MethodHello Friends,
Welcome to RK_Chaarts,
Today we're going to learn step-by-step guide to one of the chart analysis Method by analyzing a chart of " Varun Beverages Ltd. (VBL) " to identify a trend change opportunity.(Educational Post).
Let's get started!
Applying Elliott Wave Theory
First, we can see that the bottom formed in March 2025 is likely a Wave ((4)) in Black as a bottom, marked as such on the chart. From there, Wave 5 should move upwards. Looking at the daily timeframe, we can see that price gone up in five sub-divisions of Wave (1) in Blue of Wave ((5)) in Black have completed, marked as Red 1-2-3-4-5, that means blue intermediate Wave (1) has ended, and Wave (2) has begun, which is unfolded in corrective nature marked as WXY in Red of Wave (2) in Blue.
According to the wave principle, Wave (2) should not retrace more than 100% of Wave (1), which started from the 419.65 bottom. Therefore, 419.65 becomes our invalidation level. If the price moves below this level, it would invalidate our Wave (2) principle.
Assuming our wave counts are correct, the upward movement is in the five sub-divisions, and the downward movement is in the three sub-divisions. Definitely, the conviction is increasing that we have correctly identified Waves (1) and (2). Shown in chart image below
Tweezers at Bottom
Now, we can see that Wave 2 has retraced more than 70% and has formed a Tweezer candlestick pattern at the bottom. A bearish candle was followed by a bullish candle, both with a Tweezer-like shape, with the second candle being green. This could indicate a potential reversal. Moreover, the latest candle has also taken out the high of the previous two candles, showing follow-through. The price has also shown follow-through on the upside after that. So, this can be considered as the first sign that Wave 2 might be ending, marked by a significant Tweezer pattern at the bottom with a follow-through candle. Shown in chart image below
Significant Breakout Pending Yet
Secondly, from the top where Wave 1 ended, we've been considering the decline from around 560.50 as a resistance. We drew a resistance trend line, and if the price breaks out above it, we can say that the resistance trend line has been broken, indicating a breakout above the last fall's trend line, Which is not Broken yet. Shown in chart image below
Dow Theory
The Dow Theory states that when the price moves up, it forms a Higher High, Higher Low pattern, and when it moves down, it forms a Lower High, Lower Low pattern. Somehow, the Dow Theory also needs to change, as the last swing was forming a Lower High, Lower Low pattern. The last swing high was at 479, which we marked with a green arrow. If the price crosses above it, we can say that the price is now forming a Higher High pattern. This indicates that the Dow Theory is changing from a falling trend to a rising trend. Shown in chart image below
Stop Loss
Once the Dow Theory also changes, we can use the last swing low at 446.15 as our stop loss. However, this stop loss will only be valid after the Dow Theory changes; otherwise, the invalidation level will remain at 419. Shown in chart image below
Projected Target of Wave (3)
So, friends, we've applied the Elliott Wave principle, and there's been a significant retracement, all within the valid range, without violating any rules or triggering invalidation. There's limited room left on the downside, and then we have the Tweezer candlestick pattern, which is a significant sign. We're expecting a reversal from there, and the price has followed up with an upward move.
What's left now is the breakout above the resistance trend line and a change in the Dow Theory. Once these two conditions are confirmed, all parameters will match, and we can add a position to our portfolio using the last swing low as our stop loss, instead of the invalidation level.
This is how chart analysis is done for investment purposes. We've seen many signs in our favor, and yet we still use a stop loss to prevent significant losses in case the stock or market moves unexpectedly. This is what stop loss is all about - minimizing potential losses.
We've also discussed the target projection based on Wave theory, 161.8% level, which we explained through an image. So, friends, I hope you've understood the entire conclusion and learned how to analyze charts using different methods, one of which we shared with you today.
I am not Sebi registered analyst.
My studies are for educational purpose only.
Please Consult your financial advisor before trading or investing.
I am not responsible for any kinds of your profits and your losses.
Most investors treat trading as a hobby because they have a full-time job doing something else.
However, If you treat trading like a business, it will pay you like a business.
If you treat like a hobby, hobbies don't pay, they cost you...!
Hope this post is helpful to community
Thanks
RK💕
Disclaimer and Risk Warning.
The analysis and discussion provided on in.tradingview.com is intended for educational purposes only and should not be relied upon for trading decisions. RK_Chaarts is not an investment adviser and the information provided here should not be taken as professional investment advice. Before buying or selling any investments, securities, or precious metals, it is recommended that you conduct your own due diligence. RK_Chaarts does not share in your profits and will not take responsibility for any losses you may incur. So Please Consult your financial advisor before trading or investing.

OPEC Countdown: Inverted H&S Signals Potential Oil Price Rise🧭 Market Context – OPEC in Focus
As Crude Oil Futures (CL) grind in tight consolidation, the calendar reminds traders that the next OPEC meeting takes place on May 28, 2025. This is no ordinary headline event — OPEC decisions directly influence global oil supply. From quota adjustments to production cuts, their moves can rapidly shift price dynamics across energy markets. Every tick in crude oil reflects not just current flows but also positioning ahead of such announcements.
OPEC — the Organization of the Petroleum Exporting Countries — coordinates oil policy among major producers. Its impact reverberates through futures markets like CL and MCL (Micro Crude), where both institutional and retail traders align positions weeks in advance. This time, technicals are speaking loud and clear.
A compelling bottoming structure is taking shape. The Daily timeframe reveals an Inverted Head and Shoulders pattern coinciding with a bullish flag, compressing into a potential breakout zone. If momentum confirms, CL could burst into a trend move — just as OPEC makes its call.
📊 Technical Focus – Inverted H&S + Flag Pattern
Price action on the CL daily chart outlines a classic Inverted Head and Shoulders — a reversal structure that traders often monitor for high-conviction setups. The neckline sits at 64.19, and price is currently coiled just below it, forming a bullish flag that overlaps with the pattern’s right shoulder.
What makes this setup powerful is its precision. Not only does the flag compress volatility, but the symmetry of the shoulders, the clean neckline, and the breakout potential align with high-quality chart pattern criteria.
The confirmation of the breakout typically requires trading activity above 64.19, which would trigger the measured move projection. That target? Around 70.59, which is near a relevant UFO-based resistance level — a region where sellers historically stepped in with force (UnFilled Orders to Sell).
Importantly, this bullish thesis will fail if price drops below 60.02, the base of the flag. That invalidation would potentially flip sentiment and set up a bearish scenario with a target near the next UFO support at 53.58.
To properly visualize the dual scenario forming in Crude Oil, a multi-timeframe approach is often very useful as each timeframe adds clarity to structure, breakout logic, and entry/exit positioning:
Weekly Chart: Reveals two consecutive indecision candles, reflecting hesitation as the market awaits the OPEC outcome.
Daily chart: Presents a MACD bullish divergence, potentially adding strength to the reversal case.
Zoomed-in 4H chart: Further clarifies the boundaries of the bullish flag.
🎯 Trade Plan – CL and MCL Long/Short Scenarios
⏫ Bullish Trade Plan:
o Product: CL or MCL
o Entry: Break above 64.19
o Target: 70.59 (UFO resistance)
o Stop Options:
Option A: 60.02 (tight, under flag)
Option B: ATR-based trailing stop
o Ideal for momentum traders taking advantage of chart pattern combined with fundamental data coming out of an OPEC meeting
⏬ Bearish Trade Plan:
o Trigger: Break below 60.02
o Target: 53.58 (UFO support)
o Stop Options:
Option A: 64.19 (tight, above flag)
Option B: ATR-based trailing stop
o Ideal for momentum traders fading pattern failures
⚙️ Contract Specs – CL vs MCL
Crude Oil can be traded through two futures contracts on CME Group: the standard CL (WTI Crude Oil Futures) and the smaller-sized MCL (Micro WTI Crude Oil Futures). Both offer identical tick structures, making MCL a powerful instrument for traders needing more flexibility in position sizing.
CL represents 1,000 barrels of crude per contract. Each tick (0.01 move) is worth $10, and one full point of movement equals $1,000. The current estimated initial margin required to trade one CL contract is approximately $6,000 per contract, although this may vary based on market volatility and brokerage terms.
MCL, the micro version, represents 100 barrels per contract — exactly 1/10th the size of CL. Each 0.01 tick move is worth $1, with one point equaling $100. The estimated initial margin for MCL is around $600, offering traders access to the same technical setups at significantly reduced capital exposure.
These two contracts mirror each other tick-for-tick. MCL is ideal for:
Testing breakout trades with lower risk
Scaling in/out around events like OPEC
Implementing precise risk management strategies
Meanwhile, CL provides larger exposure and higher dollar returns but requires tighter control of risk and account drawdowns. Traders can choose either—or both—based on their strategy and account size.
🛡️ Risk Management – The Foundation of Survival
Technical setups don’t make traders profitable — risk management does.
Before the OPEC meeting, traders must be aware that volatility can spike, spreads may widen, and whipsaws can invalidate even the cleanest chart pattern.
That’s why stop losses aren’t optional — they’re mandatory. Whether you choose a near level, a deeper stop below the head, or an ATR-based trailing method, the key is clear: define risk before entry.
MCL helps mitigate capital exposure for those testing breakout confirmation. CL demands higher margin and greater drawdown flexibility — but offers bigger tick rewards.
Precision also applies to exits. Targets must be defined before entry to maintain reward-to-risk discipline. Avoid adding to losers or chasing breakouts post-event.
And most importantly — never hold a losing position into an event like OPEC, hoping for recovery. Risk is not a gamble. It’s a calculated variable. Treat it with respect.
When charting futures, the data provided could be delayed. Traders working with the ticker symbols discussed in this idea may prefer to use CME Group real-time data plan on TradingView: www.tradingview.com - This consideration is particularly important for shorter-term traders, whereas it may be less critical for those focused on longer-term trading strategies.
General Disclaimer:
The trade ideas presented herein are solely for illustrative purposes forming a part of a case study intended to demonstrate key principles in risk management within the context of the specific market scenarios discussed. These ideas are not to be interpreted as investment recommendations or financial advice. They do not endorse or promote any specific trading strategies, financial products, or services. The information provided is based on data believed to be reliable; however, its accuracy or completeness cannot be guaranteed. Trading in financial markets involves risks, including the potential loss of principal. Each individual should conduct their own research and consult with professional financial advisors before making any investment decisions. The author or publisher of this content bears no responsibility for any actions taken based on the information provided or for any resultant financial or other losses.

Technical Analysis with Elliott Waves: A Combined ApproachHello friends, Welcome to RK Charts!
This Educational Post is based on technical analysis, specifically how to initiate analysis on a chart, and what points to consider. This is purely for Educational purposes.
This is not a trading or investing tip or advisory. Rather, it's a comprehensive guide on how to easily analyze a chart, intended for educational purposes. I hope that by reading and understanding this post, you'll gain valuable knowledge and insights. Your focused effort to understand this will surely provide you with something valuable and easy to grasp.
Let's dive in, During technical analysis, what we had observed certain points in this chart, I'm highlighting them here:
1. Resistance line breakout, where the price has closed above it.
2. The volume within that breakout.
3. The price closing above Weekly Exponential Moving Averages.
4. Elliott Wave Counts.
5. Projected Target along with Invalidation level as per Elliott Wave theory.
6. Projected Duration for Projected Targets.
Breakout of Resistance zone with Good Volume intensity:
So, friends, here we can clearly see on the chart that this is a weekly time frame chart of Shipping Corporation of India Limited. Over the last eleven months, from July 2024, the price has been falling, remaining largely bearish, but has now broken out of Curved Resistance Trendline for the first time with a bullish candle on Weekly (Closing basis), accompanied by good volume intensity.
Alongside this, the price has sustained and closed above Major EMAs:
- 50-Weekly Exponential moving average (red line plotted on the chart)
- 100-Weekly Exponential moving average (blue line plotted on the chart)
- 200-Weekly Exponential moving average (black line plotted on the chart)
on the weekly time frame.
Elliott Wave Theory:
Considering the Elliott Wave structure, if we look at it theoretically, the top it made on July 2024, was the completion of Wave III. After that, it completed Wave IV in 7 swings (WXY) and is now possibly moving higher, making higher lows. It has closed above the moving averages, broken out of the Curved Trendline, and has strong volume. So, possibly, we are unfolding an impulse Wave V.
In Elliott Wave Theory, the invalidation level means that the price should not go below that level, which in this case is the low of Wave IV at ₹130. If the price goes below that level for any reason, even by a single point, our wave counts will be invalidated, and we'll have to re-analyze the chart.
That's why we call it the invalidation level. Analysts and traders also refer to it as a stop-loss level. So, in Elliott Wave Theory, our wave counts remain valid as long as the price stays above the invalidation level and doesn't trigger it.
Now, regarding the target, if we take the measurement of Wave IV and calculate its 1.236 level, the target for Wave V should be above the high of Wave III. According to Elliott Wave Theory, the projected target for Wave V is near ₹440, which is the 1.236 Fibonacci level.
Projected Duration for Projected Targets:
In the chart analysis we conducted, where we prospectively projected a target, if everything goes right and the invalidation level is not triggered, what could be the duration of this target? It will definitely take more than a medium-term duration, maybe even a long-term duration.
This is because each candle represents a week, and we're currently looking at the weekly time frame. Since the fourth wave has just ended and the fifth wave is upcoming, it will take a long-term duration
I am not Sebi registered analyst.
My studies are for educational purpose only.
Please Consult your financial advisor before trading or investing.
I am not responsible for any kinds of your profits and your losses.
Most investors treat trading as a hobby because they have a full-time job doing something else.
However, If you treat trading like a business, it will pay you like a business.
If you treat like a hobby, hobbies don't pay, they cost you...!
Hope this post is helpful to community
Thanks
RK💕
Disclaimer and Risk Warning.
The analysis and discussion provided on in.tradingview.com is intended for educational purposes only and should not be relied upon for trading decisions. RK_Chaarts is not an investment adviser and the information provided here should not be taken as professional investment advice. Before buying or selling any investments, securities, or precious metals, it is recommended that you conduct your own due diligence. RK_Chaarts does not share in your profits and will not take responsibility for any losses you may incur. So Please Consult your financial advisor before trading or investing.

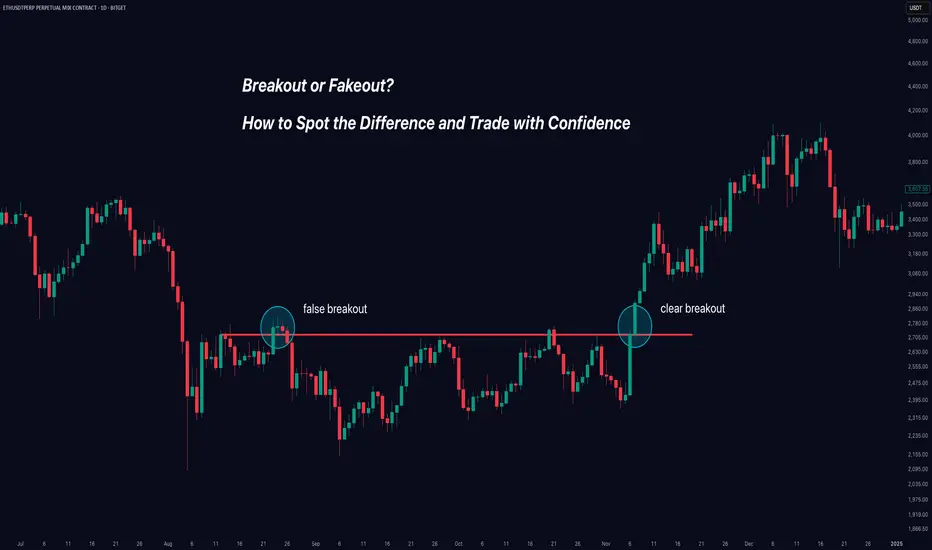
Breakout or Fakeout? How to Spot the Difference and Trade.Trading breakouts can be exciting - and profitable - when they're real. But how do you avoid getting caught in those frustrating false breakouts (fakeouts) that trap many traders?
In this clear and practical guide, you'll learn exactly how to identify genuine breakouts, avoid traps, and improve your trading decisions instantly.
Here's what we'll cover:
✅ Real Breakouts vs Fakeouts: Why it matters.
✅ Market Psychology: Why false breakouts happen.
✅ Volume: Your best friend for spotting authenticity.
✅ Price Structure & Context: When breakouts mean business.
✅ Momentum Confirmation: The hidden indicator that changes everything.
Let’s dive in!
🚩 Real Breakout vs Fakeout: Know the Difference
A breakout occurs when price decisively moves beyond a clear support or resistance level. Imagine Bitcoin breaking above $50,000 or Gold dropping below $1,900.
A fakeout happens when price briefly breaks these key levels—but quickly reverses, leaving traders stuck on the wrong side of the market.
Why it matters: Fakeouts aren't just frustrating—they’re costly. They drain your capital and confidence. Recognizing them early keeps you profitable and disciplined.
🧠 Why Do Fakeouts Happen? (The Psychology)
Fakeouts thrive because traders chase excitement and fear missing out (FOMO). Here’s the secret many traders overlook:
Bull and Bear Traps: Institutional traders deliberately push prices slightly past key levels to trigger stop orders—only to reverse the price sharply.
FOMO-driven trades: Retail traders jump in excitedly at any small breakout, providing fuel for these short-lived moves.
Understanding these tactics can help you stay calm and avoid impulsive entries.
🔥 Volume: The Ultimate Breakout Indicator
Want to know if a breakout is real? Look at volume—it reveals the market’s true intention.
High Volume: Means broad market participation and conviction, supporting a genuine breakout.
Low Volume: A red flag! This signals low market conviction and a higher likelihood of reversal.
Example: If Ethereum breaks above $4,000 with unusually high volume, that's a strong signal. But if volume remains low, beware—it's likely a fakeout.
📐 Context and Price Structure Make a Difference
Not all breakouts are created equal. Pay attention to these key context clues:
Trend Alignment: Breakouts in the direction of a clear existing trend are more reliable.
Significance of Level: Breakouts of major support/resistance levels (weekly or monthly highs/lows) have higher odds of success.
Follow-through and Retests: Genuine breakouts often retest broken levels, turning old resistance into new support.
⚡ Momentum Confirmation: Your Secret Weapon
Momentum indicators (like RSI or MACD) tell you what's happening beneath the surface. They help confirm or reject breakout validity:
Strong Momentum: If indicators confirm the breakout direction, the breakout is more reliable.
Divergence (Warning Sign): If price makes a new high but momentum indicators show lower highs, beware—a fakeout could be near.
Use momentum as your final confirmation step. It’s the missing piece that many traders ignore.
🎯 Quick Breakout Checklist
Use this simple checklist next time you're assessing a breakout:
🚦 Trade Breakouts Wisely: Final Tips
Be Patient: Waiting for breakout confirmation saves you from costly mistakes.
Set Clear Stops: If a breakout fails, exit quickly. Small losses protect your capital.
Scale into Trades: Enter gradually to manage your risk effectively.
Mind Market Context: Always align breakouts with the broader market direction.
Trading breakouts doesn't have to be stressful. When you know what signs to watch for, you trade with confidence—not guesswork.
🚀 Conclusion: Trade Better, Not Harder
Avoiding fakeouts is all about patience, confirmation, and understanding market psychology. By using volume, context, and momentum effectively, you'll greatly improve your breakout trading.
Now, put these strategies into practice. Stop guessing—start confidently trading real breakouts today!
Happy Trading!
Like this post? Follow us for more clear, actionable trading education.
#TradingTips #Breakouts #TechnicalAnalysis #TradingEducation #Crypto #Forex #StockTrading
Clear DayTrading strategy video. The "Inside Bar"🔉Sound on!🔉
📣Make sure to watch fullscreen!📣
Thank you as always for watching my videos. I hope that you learned something very educational! Please feel free to like, share, and comment on this post. Remember only risk what you are willing to lose. Trading is very risky but it can change your life!

Momentum Trading Strategies Across AssetsMomentum trading is a strategy that seeks to capitalize on the continuation of existing trends in asset prices. By identifying and following assets exhibiting strong recent performance—either upward or downward—traders aim to profit from the persistence of these price movements.
**Key Components of Momentum Trading:**
1. **Trend Identification:** The foundation of momentum trading lies in recognizing assets with significant recent price movements. This involves analyzing historical price data to detect upward or downward trends.
2. **Diversification:** Implementing momentum strategies across various asset classes—such as equities, commodities, currencies, and bonds—can enhance risk-adjusted returns. Diversification helps mitigate the impact of adverse movements in any single market segment.
3. **Risk Management:** Effective risk management is crucial in momentum trading. Techniques such as setting stop-loss orders, position sizing, and continuous monitoring of market conditions are employed to protect against significant losses.
4. **Backtesting:** Before deploying a momentum strategy, backtesting it against historical data is essential. This process helps assess the strategy's potential performance and identify possible weaknesses.
5. **Continuous Refinement:** Financial markets are dynamic, necessitating ongoing evaluation and adjustment of trading strategies. Regularly refining a momentum strategy ensures its continued effectiveness amid changing market conditions.
**Tools and Indicators:**
- **Relative Strength Index (RSI):** This momentum oscillator measures the speed and change of price movements, aiding traders in identifying overbought or oversold conditions.
- **Moving Averages:** Utilizing short-term and long-term moving averages helps in smoothing out price data, making it easier to spot trends and potential reversal points.
**Common Pitfalls to Avoid:**
- **Overtrading:** Excessive trading can lead to increased transaction costs and potential losses. It's vital to adhere to a well-defined strategy and avoid impulsive decisions.
- **Ignoring Market Conditions:** Momentum strategies may underperform during sideways or choppy markets. Recognizing the broader market environment is essential to adjust strategies accordingly.
By understanding and implementing these components, traders can develop robust momentum trading strategies tailored to various asset classes, thereby enhancing their potential for consistent returns.
Source: digitalninjasystems.wordpress.com
Leap Ahead with a Dynamic Setup: Trading with Andrew’s PitchforkThe Leap Trading Competition: A Chance to Trade Micro Euro Futures
TradingView’s "The Leap" Trading Competition provides an opportunity for traders to apply their futures trading strategies in a competitive environment. Participants can trade select CME Group futures contracts, including Micro Euro Futures (M6E).
This article presents a structured trade setup using Andrew’s Pitchfork, a technical tool that helps define potential trend direction and breakout levels. The setup involves two intersecting pitchforks near a key UFO support level, signaling the possibility of either an uptrend continuation or a confirmation of a new downtrend.
Understanding Andrew’s Pitchfork and Market Structure
Andrew’s Pitchfork is a technical analysis tool used to identify trend channels by plotting three parallel lines from a major price swing. The tool helps traders anticipate support, resistance, and breakout levels based on median lines.
In this setup, two pitchforks define opposing market structures. The green pitchfork represents an uptrend, suggesting that price could continue higher. The red pitchfork represents a developing downtrend, indicating a possible reversal. The intersection of these pitchforks at a key UFO support level marks an important decision point for the market.
The Dynamic Trade Setup: Long and Short Scenarios
In a long trade scenario, entry is confirmed if price breaks above the Upper Median Line (UML) of the red pitchfork. The target for the trade is the Median Line (ML) of the green pitchfork, representing trend continuation. A stop loss is placed below entry at a distance that ensures a minimum 3:1 reward-to-risk ratio.
In a short trade scenario, entry is confirmed if price breaks below the Lower Median Line (LML) of the green pitchfork. The target for the trade is the Median Line (ML) of the red pitchfork, confirming further downside movement. A stop loss is placed above entry at a distance that maintains a minimum 3:1 reward-to-risk ratio.
Because the UML, LML, and ML levels change dynamically with each bar, breakout levels and targets must be adjusted accordingly. If price remains inside the pitchfork structure, the setup remains neutral until confirmation occurs.
Contract Specifications and Margin Requirements
Euro FX Futures (6E) details:
Full contract specs: 6E Contract Specifications – CME Group
Contract size: €125,000
Tick size: 0.00005 per EUR/USD ($6.25 per tick)
Margin requirements depend on broker conditions and market volatility, currently around $2,600 per contract.
Micro EUR/USD Futures (M6E) details:
Full contract specs: M6E Contract Specifications – CME Group
Contract size: €12,500 (1/10th of 6E)
Tick size: 0.0001 per EUR/USD ($1.25 per tick)
Lower margin requirements provide access to traders with smaller accounts, currently around $260 per contract.
M6E offers a lower-cost alternative to 6E, making it a useful instrument for adjusting position sizes and managing risk effectively. Traders should consider market conditions and leverage when determining position sizes.
Execution and Trade Management
Before executing a trade, price must confirm a breakout by fully breaking above UML for long trades or below LML for short trades. Additional confirmation through volume trends, momentum indicators, or candlestick patterns may help validate the move.
If price does not confirm the breakout, the setup remains invalid. If price re-enters the pitchfork channel, traders should reassess market structure before taking a new position. Stop losses should be maintained at levels that align with a structured risk-reward plan.
Conclusion
Andrew’s Pitchfork provides a structured approach for trading trend continuation and reversals. This setup allows for both long and short breakout opportunities, depending on how price reacts at key pitchfork levels.
For traders in The Leap Trading Competition, this setup highlights the importance of disciplined execution, waiting for confirmation, and managing risk effectively when trading futures.
When charting futures, the data provided could be delayed. Traders working with the ticker symbols discussed in this idea may prefer to use CME Group real-time data plan on TradingView: www.tradingview.com - This consideration is particularly important for shorter-term traders, whereas it may be less critical for those focused on longer-term trading strategies.
General Disclaimer:
The trade ideas presented herein are solely for illustrative purposes forming a part of a case study intended to demonstrate key principles in risk management within the context of the specific market scenarios discussed. These ideas are not to be interpreted as investment recommendations or financial advice. They do not endorse or promote any specific trading strategies, financial products, or services. The information provided is based on data believed to be reliable; however, its accuracy or completeness cannot be guaranteed. Trading in financial markets involves risks, including the potential loss of principal. Each individual should conduct their own research and consult with professional financial advisors before making any investment decisions. The author or publisher of this content bears no responsibility for any actions taken based on the information provided or for any resultant financial or other losses.

Leap Ahead with a Dual Breakout Setup on ES and MESThe Leap Trading Competition: A Chance to Trade S&P 500 Futures
TradingView’s "The Leap" Trading Competition gives traders the opportunity to test their futures trading strategies in a competitive environment. Participants have access to select CME Group futures contracts, including E-mini S&P 500 Futures (ES) and Micro E-mini S&P 500 Futures (MES).
This article presents a dual breakout trade setup, analyzing both bullish and bearish scenarios based on key Fibonacci levels and low volatility price ranges. The goal is to trade the breakout of a well-defined range and target either a Fibonacci extension to the upside or a retracement level to the downside.
Understanding Breakouts and Fibonacci Levels
A breakout occurs when price moves beyond a defined support or resistance level, often leading to a strong trend continuation. In this case, the trading range between 6146.75 and 6121.25 is the key level to watch. A breakout above this range suggests bullish momentum, while a breakout below signals bearish pressure.
Fibonacci retracement levels are used to identify potential support or resistance zones based on past price movements. The 50% retracement level at 5985.75 aligns with a UFO support, making it a key downside target if price breaks lower.
Fibonacci extension levels project potential price targets beyond the most recent high or low. The 100% Fibonacci extension at 6288.75 serves as the projected upside target if price breaks higher.
The Dual Breakout Trade Setup
In a bullish scenario, a breakout above 6146.75 confirms entry to the upside. The target for this trade is the 100% Fibonacci extension at 6288.75. A stop loss is placed below the breakout level at a distance that ensures a minimum 3:1 reward-to-risk ratio.
In a bearish scenario, a breakdown below 6121.25 confirms entry to the downside. The target is the 50% Fibonacci retracement at 5985.75, which aligns with a UFO support zone. A stop loss is placed above the breakdown level, ensuring a minimum 3:1 reward-to-risk ratio.
Risk management considerations include adjusting stop losses based on a trader’s preferred risk-reward ratio. Scaling out at intermediate levels can help manage volatility and secure partial profits.
Contract Specifications and Margin Requirements
E-mini S&P 500 Futures (ES) details:
Full contract specs: ES Contract Specifications – CME Group
Contract size: $50 x S&P 500 Index
Tick size: 0.25 index points ($12.50 per tick)
Margin requirements depend on broker conditions and market volatility – Currently ≈$15,000 per contract.
Micro E-mini S&P 500 Futures (MES) details:
Full contract specs: MES Contract Specifications – CME Group
Contract size: $5 x S&P 500 Index (1/10th of ES)
Tick size: 0.25 index points ($1.25 per tick)
Lower margin requirements make it more accessible for smaller accounts – Currently ≈$1,500 per contract.
Leverage in ES and MES magnifies both potential gains and losses. Traders should consider margin requirements and market conditions when determining position sizes.
Execution and Market Conditions
Before executing a trade, a typical breakout trader would watch price confirm a breakout by sustaining above or below the key levels. Additional confirmation from volume trends and momentum indicators can improve trade accuracy.
If price does not break out, the setup remains invalid. If a false breakout occurs, traders may need to reassess conditions before re-entering.
Conclusion
A dual breakout setup provides both bullish and bearish opportunities depending on price movement. Fibonacci extensions provide upside targets, while retracement levels align with strong support zones for downside moves.
For participants in The Leap Trading Competition, this setup highlights the importance of disciplined execution, confirmation, and structured risk management.
When charting futures, the data provided could be delayed. Traders working with the ticker symbols discussed in this idea may prefer to use CME Group real-time data plan on TradingView: www.tradingview.com - This consideration is particularly important for shorter-term traders, whereas it may be less critical for those focused on longer-term trading strategies.
General Disclaimer:
The trade ideas presented herein are solely for illustrative purposes forming a part of a case study intended to demonstrate key principles in risk management within the context of the specific market scenarios discussed. These ideas are not to be interpreted as investment recommendations or financial advice. They do not endorse or promote any specific trading strategies, financial products, or services. The information provided is based on data believed to be reliable; however, its accuracy or completeness cannot be guaranteed. Trading in financial markets involves risks, including the potential loss of principal. Each individual should conduct their own research and consult with professional financial advisors before making any investment decisions. The author or publisher of this content bears no responsibility for any actions taken based on the information provided or for any resultant financial or other losses.

Leap Ahead with a Regression Breakout on Crude OilThe Leap Trading Competition: Your Chance to Shine
TradingView’s “The Leap” Trading Competition presents a unique opportunity for traders to put their futures trading skills to the test. This competition allows participants to trade select CME Group futures contracts, including Crude Oil (CL) and Micro Crude Oil (MCL), giving traders access to one of the most actively traded commodities in the world.
Register and compete in "The Leap" here: TradingView Competition Registration .
This article breaks down a structured trade idea using linear regression breakouts, Fibonacci retracements, and UnFilled Orders (UFOs) to identify a long setup in Crude Oil Futures. Hopefully, this structured approach aligns with the competition’s requirements and gives traders a strong trade plan to consider. Best of luck to all participants.
Spotting the Opportunity: A Regression Breakout in CL Futures
Trend reversals often present strong trading opportunities. One way to detect these shifts is by analyzing linear regression channels—a statistical tool that identifies the general price trend over a set period.
In this case, a 4-hour CL chart shows that price has violated the upper boundary of a downward-sloping regression channel, suggesting the potential start of an uptrend. When such a breakout aligns with key Fibonacci retracement levels and existing UnFilled Orders (UFOs), traders may gain a potential extra edge in executing a structured trade plan.
The Trade Setup: Combining Fibonacci and a Regression Channel
This trade plan incorporates multiple factors to define an entry, stop loss, and target:
o Entry Zone:
An entry or pullback to the 50%-61.8% Fibonacci retracement area, between 74.60 and 73.14, provides a reasonable long entry.
o Stop Loss:
Placed below 73.14 to ensure a minimum 3:1 reward-to-risk ratio.
o Profit-Taking Strategy:
First target at 76.05 (38.2% Fibonacci level)
Second target at 77.86 (23.6% Fibonacci level)
Final target at 78.71, aligning with a key UFO resistance level
This approach locks in profits along the way while allowing traders to capitalize on an extended move toward the final resistance zone.
Contract Specifications and Margin Considerations
Understanding contract specifications and margin requirements is essential when trading futures. Below are the key details for CL and MCL:
o Crude Oil Futures (CL) Contract Details
Full contract specs: CL Contract Specifications – CME Group
Tick size: 0.01 per barrel ($10 per tick)
Margin requirements vary based on market conditions and broker requirements. Currently set around $5,800.
o Micro WTI Crude Oil Futures (MCL) Contract Details
Full contract specs: MCL Contract Specifications – CME Group
Tick size: 0.01 per barrel ($1 per tick)
Lower margin requirements for more flexible risk control. Currently set around $580.
Choosing between CL and MCL depends on risk tolerance and account size. MCL provides more flexibility for smaller accounts, while CL offers higher liquidity and contract value.
Execution and Market Conditions
To maximize trade efficiency, conservative traders could wait for a proper price action into the entry zone and confirm the setup using momentum indicators and/or volume trends.
Key Considerations Before Entering
Ensure price reaches the 50%-61.8% Fibonacci retracement zone before executing the trade
Look for confirmation signals such as increased volume, candlestick formations, or additional support zones
Be patient—forcing a trade without confirmation increases risk exposure
Final Thoughts
This Crude Oil Futures trade setup integrates multiple confluences—a regression breakout, Fibonacci retracements, and UFO resistance—to create a structured trade plan with defined risk management.
For traders participating in The Leap Trading Competition, this approach emphasizes disciplined execution, dynamic risk management, and a structured scaling-out strategy, all essential components for long-term success.
When charting futures, the data provided could be delayed. Traders working with the ticker symbols discussed in this idea may prefer to use CME Group real-time data plan on TradingView: www.tradingview.com - This consideration is particularly important for shorter-term traders, whereas it may be less critical for those focused on longer-term trading strategies.
General Disclaimer:
The trade ideas presented herein are solely for illustrative purposes forming a part of a case study intended to demonstrate key principles in risk management within the context of the specific market scenarios discussed. These ideas are not to be interpreted as investment recommendations or financial advice. They do not endorse or promote any specific trading strategies, financial products, or services. The information provided is based on data believed to be reliable; however, its accuracy or completeness cannot be guaranteed. Trading in financial markets involves risks, including the potential loss of principal. Each individual should conduct their own research and consult with professional financial advisors before making any investment decisions. The author or publisher of this content bears no responsibility for any actions taken based on the information provided or for any resultant financial or other losses.

How To Navigate: Breakouts with Tools, Indicators & StrategyHaving a Clear and Precise understanding of whether you're dealing with a Breakout or False Breakout can help you:
1) Find potentially profitable opportunities
&
2) Avoid making risky investment moves!
Also knowing how to Confirm Trend Change can:
1) Rise probability of profitable trades
&
2) Limit the total # taken!
So today, I lay out the tools, indicators and tips I use to visualize and to make a decision!
Examples:
COINBASE:XLMUSD & BITSTAMP:XRPUSD
Tools:
- Trendline
- Parallel Channel
- Rectangle
Indicators:
- Volume
- RSI
- "True or False" Formula : Close + 20-25% Break + 5-6 Days Outside of Break = Breakout

Analyzing the Market Performance of Dr. Reddy's Laboratories:Analyzing the Market Performance of Dr. Reddy's Laboratories: Trends, Support, and Resistance
Introduction
Lets delve into the recent market performance of Dr. Reddy's Laboratories (DRREDDY), a prominent player in the global pharmaceutical industry. We will examine the stock's technical aspects, incorporating support and resistance levels, trading volume, and options data to provide a comprehensive view of potential trading opportunities and risk factors.
Technical Analysis
Current Price: ₹1288.15
Resistance Levels:
Resistance 1: ₹1305.52
Resistance 2: ₹1322.88
Resistance 3: ₹1332.82
Support Levels:
Support 1: ₹1278.22
Support 2: ₹1268.28
Support 3: ₹1250.92
The trading volume for the current period stands at 738.79K, indicating moderate market activity. Higher volume often signifies strong investor interest and can be an early indicator of significant price changes.
The chart reveals critical resistance and support zones. The resistance zone around ₹1420.00 serves as a potential barrier to upward price movement, while the support zone around ₹1140.00 provides a safety net against significant downward trends. These zones are crucial for traders to make informed decisions regarding entry and exit points.
Options Data Analysis
The options data provide a detailed view of the current market sentiment and possible future price movements of DRREDDY's stock.
Key Observations:
Call and Put Activities:
Significant call writing activity across various strike prices (1300, 1310, 1320, 1330, 1340, 1360, 1380, 1400) indicates bearish sentiment. Investors are selling call options, expecting the stock not to rise above these levels.
Put short covering is observed at most strike prices, suggesting that investors who had previously sold put options are buying them back, possibly anticipating that the stock's decline might be limited.
At strike prices 1350, 1370, and 1390, there is call long covering, implying that traders are closing their long call positions, which could signal an expectation of decreased upward momentum.
LTP (Last Traded Price) and OI (Open Interest):
Higher LTP for puts compared to calls at lower strike prices indicates a higher demand for put options, reinforcing the bearish sentiment.
Substantial changes in open interest (OI) for calls at various strike prices suggest that traders are actively adjusting their positions in response to market conditions. Increased OI in calls generally signifies a buildup of new positions, while decreased OI indicates position closures.
For puts, the changes in OI also reflect market dynamics, with decreases in OI suggesting that traders are closing their bearish positions.
Strategy - DRREDDY 1300 Strike
DRREDDY is showing signs of action – here’s how you can make the most of it!
Strike Price : 1300 Call Option High: ₹35 Put Option High: ₹36.6
Plan of Action:
Focus on the side (Call or Put) that breaks its high first.
Quick Profits : Lock in gains based on your comfort level and market conditions.
Risk Management : Always implement a strict stop loss to safeguard your capital.
Why This Trade?
This strategy is designed to capture sharp price movements, offering potential opportunities in both upward and downward directions. Ideal for traders prepared to act swiftly on breakout levels.
Stay Ready – Don’t Miss Out! Be prepared to execute when the breakout happens!
Investment Implications
Based on the technical and options data analysis, DRREDDY's stock exhibits a balanced risk-reward ratio. Investors should closely monitor the support and resistance levels for potential breakout or breakdown scenarios. Additionally, keeping an eye on options data such as strike prices, built-up positions, and changes in open interest will aid in identifying the stock's future trajectory and potential trading opportunities.
Conclusion
Dr. Reddy's Laboratories' stock chart and options data offer valuable insights for investors and analysts. By understanding the support and resistance levels, volume trends, market sentiment, and options data, stakeholders can make informed investment decisions. As always, it is crucial to consider external factors and conduct thorough research before making any trading decisions.

Technical Analysis of Bajaj Finserv (BAJAJFINSV): A Bullish BreOverview and Key Observations
Bajaj Finserv has recently shown signs of a bullish reversal after breaking out of a classic double bottom pattern, a strong indicator of upward momentum. The neckline at ₹1,680 was breached with significant volume, confirming the breakout. The current price of ₹1,735.20 positions the stock above this critical support, establishing a solid base for further upside. The pattern suggests a measured target of ₹1,800, aligning with intermediate resistance levels.
Support and Resistance Levels
The chart highlights the following critical levels for traders:
Support Levels:
₹1,693.73: Immediate support just below the current price, ideal for pullbacks.
₹1,652.27: Intermediate support aligning with prior consolidations.
₹1,630.13: A deeper demand zone marking the bottom of the previous accumulation phase.
Resistance Levels:
₹1,757.33: The immediate resistance that needs to be breached for continued upside.
₹1,779.47: A key resistance level and the target based on the double bottom pattern height.
₹1,820.93: A stronger resistance and the next major target for the stock.
The stock currently faces resistance near ₹1,757.33, and a breakout above this level with strong volume could open the doors for a rally toward ₹1,779.47 and ₹1,820.93.
Volume and Momentum
The breakout candle exhibited a notable surge in volume, validating the reliability of the bullish move. However, subsequent candles show declining volume, suggesting mild consolidation near resistance. Momentum indicators such as the RSI and MACD need to be monitored for confirmation of continued strength. If RSI remains below 70, there is room for further upward movement.
Trading Strategies
For swing traders, entering long positions near ₹1,700–₹1,720 on pullbacks or above ₹1,757 after a breakout offers good opportunities. A stoploss at ₹1,669, below Support 1, ensures risk is minimized. Targets include ₹1,757.33, ₹1,779.47, and ₹1,820.93. For shortterm traders, a failure to sustain above ₹1,680 could indicate weakness, with downside targets of ₹1,652.27 and ₹1,630.13.
Summary and Outlook
Bajaj Finserv is exhibiting strong bullish momentum backed by technical patterns and volume. The immediate focus is on clearing the resistance at ₹1,757.33 to confirm further upside toward ₹1,779.47 and ₹1,820.93. Traders should remain cautious of a potential retest of the ₹1,680 support zone, which would act as a critical level for invalidating the bullish setup. With strong risk management and a focus on key levels, this setup offers a promising opportunity for both shortterm and longterm gains.

Bitcoin major sign of Stop loss hunting and dump seen!!!This is educational post and i am making it short this time with one example which happened at 13/Jan/2025 as you can see previous time we had same scenario but they did hit stop loss of sellers + buyers and how is that ?
price was breaking 90K$ support zone which is strong and major support for BTC in lower time frames as you can see at that time and it breaks that immediately after hitting so many stop loss of buyers below 90K$ and get them out of their buy positions it pumped and start to rise also it hit so many stop loss of sellers with high leverage which sell the Bitcoin below that support zone and they were looking for the upcoming dump after breakout but it didn't happen and both sides get loss and someone's loss is some others profit and this high volume there is reason of that and after price pump above we can see more gain also appear due to that good stop loss hunting and it seems that we have the same scenario now happening but this time it seems that Resistance and ATH resistance zone is breaking so take care.
How to find out if the breakout is valid or is it fake breakout ?
1. let it breaks the resistance or support with at least +-3% as confirmation.
2. after breakout wait for retest of breakout and let it retest previous support for example and see if it turns to resistance zone this time.
3. high volume is needed after 2-3 next candles after breakout + breakout candle.
I think we may have another fake breakout and soon price will fall and dump hard and this is my thoughts.
So always do your own research and DISCLAIMER: ((trade based on your own decision))
<>

Lesson Learned: What Seperates the Greats from the AmeteursI am getting back to trading again after several years of unprofitability. I went over my trade entries from many years ago, as well as entries I backtested, now that trading view seems to have improved it's bar replay, it's been even easier.
I made a discovery:
1. High R/R as well as moves with possible multiple entry opportunities are found on the 1hr or higher timeframe breakout structures.
2. The losses I had taken came from trading breakouts within a consolidating market.
3. Winners start working rather quickly, they go move big and fast. When checking my trade duration, the losses tend to happen either very fast, or they linger for a bit, then hit my SL. or perhaps a small profit. Winners tend to have very fast(especially since I daytrade the 5min).
This was a great observation, as last night, I got to see it in action again, using live money and real emotions.
Now I can see what I do so I can learn.
Lessons Learned:
1. Trade Only 1hr or higher timeframe breakout structures. It's fine to take a 5min breakout within to catch the full breakout(as you would take a 1hr structure to catch a Daily chart breakout), however, step back if market is hostile.
This allows for:
Optimal R/R due to a bigger trending move
Higher win rate due to cutting out losses from random price breakouts due to using only the 5min chart patterns.
Patience to wait for the bigger trend to break out, when the market moves and can actually provide a good trading environment.
2. Avoid Hostile Markets. mentioned on lesson 1, but is worth reemphasizing. Continuing to reenter a market that is clearly moving unfavorably to your plan is death by 1,000 papercuts.
Rather than continuing to try to get in, which is absolutely fine in a favorable market, use your "sit-out power" - The discipline to stay out of the market when conditions dont suit your strategy. By sitting out during unfavorable periods, top traders like Mark Minervini(U.S. Investing Championship 1st place winner on multiple years with multiple students also reaching top ranks) maintains a win rate closer to 50%.
3. If market takes too long to go, it could be a sign that it is not ready yet and may most likely continue correcting . This is clearly evident in how the market today, although it seemed to be forming double tops, and breakout structures, it didnt breakout yet, it just extended it's correction, making this move unpredictable, and raising the chances of stopping out. Trading is probabilities, and successful trading is moving the probabilities in your favor. This may be an opportunity to revisit during more favorable market conditions, when it begins to trend.
I used a time stop today, and it is something that I have recently started implementing, as I also discovered that many successful traders also use a time stop, because timing the market breakout is a key element in trading the market profitably, as well as is staying out when the timing is off and avoiding a full unnecessary loss when markets are moving unfavorably for a long period.
A tweet I read today, published by Law Wai-Sum, known on X as @JLawStock, One of Mark Minervini's student's, and also 1st place winner of the Eleven Month 2024 U.S. Investing Championship with a 308.6% return in the Money Manager Verified Rating($1 Million+ Accounts), yesterday, mentioned " to improve trading performance, the first step is not to seek trading opportunities but to learn how to eliminate them ...Currently, the U.S. Stock market is also not the time for me to engage in agressive trading. I have given up on many trading opportunities, but this is cautious timing approach allowed my overall account to achieve double digit growth last december with minimal drawdowns.
The second step is to learn to focus on opportunities that truly belong to you.
How many times in the past have you kept firing away, only to end up busy for nothing and making no progress? This shows that the majority of trades are, in fact, meaningless. The major contributions to your account often come from a few key trades. But one thing is for certain: These key trades do not present entry opportunities every day- they only appear at the most favorable moments, and when they do, that's when you grab the money in large handfuls..."
This was so special for me to read precisely today, as I took losses for trading an unfavorable market, and now, hours later, I see, the market was not breaking out. Jesse Livermore, or JLaw himself couldve been trying to trade these breakouts and they wont go. The key is, they wouldn't continue trading these breakouts. they dont get results from the markets because the market just move in their favor, rather, they decide to keep their profits by staying out when it does not.
I invite you, as a reader, to take action on the knoweledge learned, and observe your past trades. zoom out, were you taking losses due to trading a hostile and corrective market?
Rather than switch and learn new strategies(As I once did, which was fine too, as it was great knoweledge, but I go back to the basics, what I started with, because it works, it always did, I just needed to do a better job of understanding when it worked and when I was overtrading), I challenge you too, to develop further YOUR strategy. To understand when to stay out and sit in cash.

How invalidation of a short setup becomes a long setupExplanation of the Trading Setup Based on the Chart:
"Short Re-test" Signal Creates Two Scenarios:
Plan A: When a "Short re-test" signal appears, it indicates potential resistance and a possible continuation of the downward move. You can short with the expectation that sellers will dominate and push the price lower.
Plan B: Alternatively, you prepare for a breakout, where price moves above the resistance formed by the "Short re-test" signal. This indicates a potential trend reversal or continuation of bullish momentum.
In this case, Plan B was triggered, leading to a textbook breakout above the resistance zone.
Breakout Confirmation and Retest Setup:
After the breakout, the price moved higher and provided a "Buy re-test" signal. This is a classic example of a breakout retest pattern, where the price pulls back to test the broken resistance, which now acts as support, before continuing upward.
Multiple "Buy Re-test" Signals Strengthen the Trend:
Following the initial breakout and retest, the chart shows multiple green "Buy re-test" signals along the way. Each signal marks a new key support level, confirming bullish control and the reliability of the uptrend.
Notice how each of the three key supports held, demonstrating strong demand at these levels and affirming the strength of the bulls.
Key Takeaways:
The initial "Short re-test" signal gave traders the opportunity to anticipate both a short continuation or a bullish breakout.
Once the breakout occurred, it was followed by a strong series of retests, giving traders multiple low-risk entry points to go long.
Holding key support levels after each "Buy re-test" signal validated the bullish momentum, creating high-confidence long setups as the trend progressed.
This setup exemplifies how combining breakout strategies with retest confirmations can lead to profitable trades while maintaining manageable risk.
Contact me to get a trial of that Impulse Master indicator

Decoding Reversals: Technical Analysis of ONGC: Educational postEDUCATIONAL POST
Technical Analysis of ONGC Stock
This post is for educational purposes only and should not be considered as investment advice.
In this post, we'll analyze the ONGC stock chart using technical indicators.
Key Points:
1. Bullish Divergence: Price and MACD are diverging, indicating a potential reversal.
2. Bullish Divergence: Price and RSI are also diverging, supporting the reversal idea.
3. Resistance Breakout: The stock has broken through a key resistance level with strong volume.
4. MACD Turns Positive: MACD has turned positive after the breakout, confirming the reversal.
5. Elliott Wave Counts: Wave counts suggest a potential reversal.
What to Expect:
Based on these indicators, we can see a potential reversal in ONGC's stock price. It may retrace to Fibonacci levels (50-61.8%) before continuing upward.
Conclusion:
This post is meant to illustrate how technical indicators can be used to analyze a stock chart. Please do your own research and consult with a financial advisor before making any investment decisions.
I am not Sebi registered analyst.
My studies are for educational purpose only.
Please Consult your financial advisor before trading or investing.
I am not responsible for any kinds of your profits and your losses.
Most investors treat trading as a hobby because they have a full-time job doing something else.
However, If you treat trading like a business, it will pay you like a business.
If you treat like a hobby, hobbies don't pay, they cost you...!
Hope this post is helpful to community
Thanks
RK💕
Disclaimer and Risk Warning.
The analysis and discussion provided on in.tradingview.com is intended for educational purposes only and should not be relied upon for trading decisions. RK_Charts is not an investment adviser and the information provided here should not be taken as professional investment advice. Before buying or selling any investments, securities, or precious metals, it is recommended that you conduct your own due diligence. RK_Charts does not share in your profits and will not take responsibility for any losses you may incur. So Please Consult your financial advisor before trading or investing.

Ascending Triangle in Nikkei/Yen Futures: A 2025 Bullish Setup?1. Introduction
The Nikkei/Yen Futures, a crucial instrument for traders aiming to capture movements in Japan’s equity index and its currency dynamics, presents an intriguing setup as we step into 2025. An ascending triangle pattern, a classic bullish formation, is emerging on the chart, signaling a potential breakout to the upside.
Adding to the technical allure is the depletion of sell unfilled orders (UFOs) within a significant price zone between 40,420 and 39,685. This critical area, revisited six times since late July 2024, has seen a steady reduction of unfilled sell orders, opening the possibility for bullish momentum to dominate. With the price currently hovering near the 39,685 level, the stage appears set for a breakout opportunity.
2. The Technical Setup
The ascending triangle, characterized by a series of higher lows converging toward a horizontal resistance level, often signifies bullish pressure. In the case of the Nikkei/Yen Futures, the horizontal resistance resides near 39,685, the lower boundary of a key sell UFO zone.
This resistance has been tested repeatedly since July 2024, with each revisit chipping away at the sell orders within the zone. Such behavior suggests diminishing selling pressure, setting the foundation for a breakout. The anticipated target for this breakout, calculated using Fibonacci projection, is set at 41,380—aligning with historical price action and technical projections.
Key Contract Specifications:
o Regular Nikkei/Yen Futures (NIY1!)
Contract Size: ¥500 x Nikkei 225 index
Tick Size: ¥5
Point Value: ¥2,500
Margin Requirement: Approx. $ 1,500,000 JPY
o Micro Nikkei/Yen Futures (MNI)
Contract Size: ¥50 x Nikkei 225 index
Tick Size: ¥5
Point Value: ¥250
Margin Requirement: Approx. $ 150,000 JPY
These details ensure accessibility for both institutional and retail traders, with the micro contract enabling smaller capital commitments while maintaining exposure to the same underlying asset.
3. Forward-Looking Trade Plan
The technical evidence supports a bullish trade plan for Nikkei/Yen Futures:
Trade Direction: Long
Entry Price: Above 39,685, confirming a breakout from the resistance level.
Target Price: 41,380, based on Fibonacci projections.
Stop Loss: 39,120, targeting a 3:1 reward-to-risk ratio to manage risk effectively.
Reward-to-Risk Ratio: 3:1 (Calculated: 41,380 - 39,685 = 1,695 reward; 39,685 - 39,120 = 565 risk).
The trade parameters apply to both the standard and micro contracts, offering flexibility in position sizing. Traders with smaller accounts may opt for the micro contract to manage margin requirements while engaging in this high-potential setup.
4. Importance of Risk Management
Risk management remains the cornerstone of any successful trading strategy, particularly when trading leveraged instruments like futures. Here are key considerations for managing risk in the Nikkei/Yen Futures trade setup:
Stop-Loss Orders: Placing a stop-loss at 39,120 ensures a predefined risk level, protecting traders from unexpected market reversals. It’s vital to adhere to this level to maintain discipline and avoid emotional decision-making.
Position Sizing: The availability of micro contracts (MNIY1!) allows traders to tailor their position size according to their account size and risk tolerance. For example, trading one micro contract involves a significantly smaller margin commitment compared to the regular contract, making it suitable for retail traders.
Defined Risk Exposure: Leveraged products like futures can lead to substantial losses if risk is not clearly defined. Using stop-loss orders and trading within calculated risk parameters prevents the potential for undefined losses.
Precise Entries and Exits: Setting the entry above 39,685 ensures a systematic approach to triggering the trade based on the expected breakout. Similarly, targeting 41,380 using Fibonacci projections ensures that profit objectives align with technical analysis rather than arbitrary levels.
By prioritizing these aspects, traders can mitigate risks while maximizing the potential reward from this bullish setup.
5. Closing Remarks
The Nikkei/Yen Futures seem to be poised for a potential breakout as we enter 2025, driven by a combination of technical factors and diminishing sell-side unfilled orders. The ascending triangle formation strengthens the bullish bias, with the calculated Fibonacci projection of 41,380 offering an attractive target.
Both the standard and micro contracts cater to different trader profiles, allowing participation regardless of account size. As the price approaches the critical 39,685 level, traders are encouraged to stay vigilant, using real-time CME data to track developments and validate entry triggers.
When charting futures, the data provided could be delayed. Traders working with the ticker symbols discussed in this idea may prefer to use CME Group real-time data plan on TradingView: www.tradingview.com - This consideration is particularly important for shorter-term traders, whereas it may be less critical for those focused on longer-term trading strategies.
General Disclaimer:
The trade ideas presented herein are solely for illustrative purposes forming a part of a case study intended to demonstrate key principles in risk management within the context of the specific market scenarios discussed. These ideas are not to be interpreted as investment recommendations or financial advice. They do not endorse or promote any specific trading strategies, financial products, or services. The information provided is based on data believed to be reliable; however, its accuracy or completeness cannot be guaranteed. Trading in financial markets involves risks, including the potential loss of principal. Each individual should conduct their own research and consult with professional financial advisors before making any investment decisions. The author or publisher of this content bears no responsibility for any actions taken based on the information provided or for any resultant financial or other losses.

Master High-Probability Breakouts with the GOLDEN Trading SystemWelcome to the GOLDEN Trading System (GTS) – a custom-designed strategy tailored for traders seeking high-probability breakout opportunities. Built on the foundation of TradingView's powerful indicators, GTS focuses on leveraging Camarilla Pivot Levels (H3-H4 and L3-L4) to spot and act on potential market trends. Whether you're a beginner or an experienced trader, this system simplifies the complexity of technical analysis, giving you an edge in the markets.
Core Elements of the Strategy.
1. Key Levels to Watch:
Green Band (H3-H4):
Represents a resistance zone where bullish breakouts are likely to occur. A confirmed breakout above H4 often leads to a strong upward trend.
Red Band (L3-L4):
Acts as a support zone, signaling potential bearish moves when broken. A confirmed breakdown below L4 generally triggers a downward trend.
2. The Breakout Concept:
When the price crosses either of these bands, it indicates a potential shift in market dynamics:
Bullish Breakout: Price breaks above the Green Band, suggesting buyers have gained control.
Bearish Breakout: Price breaks below the Red Band, signaling sellers have the upper hand.
Why This Strategy Works?
High Probability: Camarilla Pivot Levels are widely respected by traders, making breakouts from these zones more reliable.
Trend Confirmation: The system minimizes false signals by focusing on specific breakout levels instead of broader zones.
Clear Entry/Exit Points: You can easily determine when to enter a trade and set stop-loss or take-profit levels.
How to Use the GOLDEN Trading System?
Identify the Bands: Look for the Green Band (H3-H4) and Red Band (L3-L4) on your chart.
Watch for Breakouts:
Enter a long position when the price closes decisively above the Green Band (H4).
Enter a short position when the price closes decisively below the Red Band (L4).
Manage Your Risk:
Use the opposite band (L3 or H3) as a stop-loss level to protect your trade.
Consider trailing your stop-loss as the trend progresses.
Add Confirmation: For greater accuracy, combine this strategy with other tools such as volume spikes, candlestick patterns, or higher timeframe trend analysis.
Case Study Example:
Take a closer look at the chart provided:
The price broke below the Red Band (L3-L4), confirming a bearish breakout.
Post-breakout, the price continued its downtrend, offering a high-reward opportunity for short-sellers.
By adhering to the system's clear breakout rules, you could have entered the trade early and capitalized on the trend with confidence.
Benefits of the GOLDEN Trading System:
Simplicity: Focuses on straightforward rules, making it beginner-friendly.
Consistency: Reduces emotional trading by adhering to defined breakout zones.
Scalability: Works across multiple timeframes and markets, including indices, stocks, and commodities.
Pro Tip for Advanced Traders:
Combine GTS with volume analysis, RSI divergence, or moving averages to add layers of confirmation to your trades. This helps filter out false breakouts and improves your win rate.
Join the GTS movement and elevate your trading game today! Share your feedback, results, and tweaks to make the strategy even better. Happy trading! 🚀

Catching Dips any Coin with Spiderline !The Spiderline is a concept in cryptocurrency that refers to a specific strategy or indicator used in technical analysis to identify key support and resistance levels on the price charts of crypto assets, particularly Bitcoin.
This concept is based on retracement levels or structures calculated from historical market data. Here are the key points to understand the Spiderline:
Origin:
It is often used by experienced traders to visualize critical zones where the price has historically reacted (bounced or been rejected). These zones are derived from specific lines on the charts based on previous Bitcoin price movements.
Usefulness:
- Identify support levels: where the price could stop during a decline.
- Determine resistance zones: where the price might struggle to move higher.
- It also helps plan entry and exit points based on the likelihood of market reactions.
Differences from traditional indicators:
Unlike tools like moving averages or the Relative Strength Index (RSI), the Spiderline is more specific to Bitcoin's historical behavior and is often used over longer timeframes.
Associated strategy:
Traders use it to refine their buying or selling decisions, avoid trading against strong trends, and manage their risk effectively.
Credit Inspired by #Cryptoface

Breakout Signals via Asymmetrical AveragingSpecial Application of Average Bullish & Bearish Percentage Change Indicator
INDICATOR AVERAGES BULLISH AND BEARISH VOLATILITY SEPARATELY THROUGH THEIR NATIVE PAST CANDLE COUNT. NOT PERIODICALLY!
Asymmetrical averaging is a versatile technique that involves assigning different lengths for independent averaging of opposite market forces. This adaptability uncovers high-probability breakout signals by establishing a threshold that filters out irrelevant fluctuations.
Below, I illustrated 2 practical examples of the method applied to bullish and bearish breakout scenarios:
Bullish Breakout Example:
Set the bullish averaging to 30 and the bearish averaging to 1000.
If the bullish average consistently surpasses the bearish threshold, it indicates robust buying momentum and a potential breakout to the upside.
The extreme bearish average establishes a consistent baseline, filtering out short-term fluctuations and focusing on significant upward momentum to deliver reliable bullish breakout signals.
Bearish Breakout Example:
Set the bearish averaging to 30 and the bullish averaging to 1000.
If the bearish average rises above the bullish threshold, it signals growing selling pressure and a potential breakout to the downside.
The extreme bullish average provides a steady reference point, eliminating minor fluctuations and isolating significant downward momentum for dependable bearish breakout signals.
LINK TO THE INDICATOR:

Quick Tutorial of the Time @ Mode MethodHey, guys! Just wanted to cover a quick review of the Time @ Mode method that we use to analyze and set up potential trades in the Key Hidden Levels chat room here on TradingView. If you have any questions, feel free to comment, or join us over at Key Hidden Levels! Using NASDAQ:QUBT as the example here.
Hope you enjoy, and best of luck out there!

Options Blueprint Series [Basic]: Ready to Strangle a BreakoutIntroduction: Why Natural Gas is Poised for Volatility
Natural Gas markets are showing signs of a potential volatility surge as recent data from the United States Natural Gas Stocks Change (USNGSC) displays a rare narrowing of the 21-day Bollinger Bands®. This technical setup often precedes sharp market moves, suggesting an upcoming breakout.
Given the importance of fundamental shifts in natural gas inventory data, any unexpected change in USNGSC could significantly impact Natural Gas Futures (NG1!), leading to price movements in either direction. This Options Blueprint Series explores a strategy to capitalize on this anticipated volatility: the Long Strangle Strategy. By setting up positions that profit from sharp directional moves, traders may capture gains regardless of the direction in which the price moves.
Understanding the Long Strangle Strategy
A Long Strangle involves purchasing a call option at a higher strike price and a put option at a lower strike price. This setup allows traders to profit from significant price movements in either direction.
The chosen strategy for this analysis includes:
Expiration: February 25, 2025
Strikes: 2.5 put at 0.28 and 2.7 call at 0.29
This setup is ideal for capturing potential breakouts, with limited risk equal to the total premium paid. Unlike directional trades, a Long Strangle does not require forecasting the direction of the move, only that a substantial price change occurs before expiration.
Technical Analysis with Bollinger Bands®
The 21-day Bollinger Bands® applied to USNGSC have narrowed significantly, often an indicator that the market is building up pressure for a breakout. Historically, this type of setup in fundamental data can drive volatility in Natural Gas Futures.
When the Bollinger Bands® width narrows, it indicates reduced variability and increased potential for data changes, awaiting release. Once volatility resumes, a dramatic shift can occur. This technical insight provides a solid foundation for the Long Strangle Strategy, aligning the timing of options with the potential for amplified price movement in Natural Gas.
Contract Specifications for Natural Gas Futures
To effectively plan and manage risk in this trade, it’s crucial to understand the contract details and margin requirements for Natural Gas Futures (NG).
o Standard Natural Gas Futures Contract (NG):
Minimum Price Fluctuation: $0.001 per MMBtu or $10 per tick.
o Micro Natural Gas Futures Contract (optional alternative for smaller exposure):
Minimum Price Fluctuation: $0.001 per MMBtu or $1.00 per tick.
Margin Requirements
The current margin requirement for a single NG futures contract generally falls around $2,500 but may vary with market conditions. $250 per contract for Micro Natural Gas Futures.
Trade Plan for the Long Strangle
The Long Strangle strategy on Natural Gas involves buying both a put and a call option to capture significant price movements in either direction. Here’s how the trade is set up:
o Expiration: February 25, 2025
o Strikes:
Long 2.5 Put at 0.28 ($2,800)
Long 2.7 Call at 0.29 ($2,900)
o Cost Basis: The total premium paid for the strangle is 0.57 (0.28 + 0.29) = $5,700 per strangle position.
Profit Potential
Profits increase as Natural Gas moves sharply above the 2.7 call strike or below the 2.5 put strike, accounting for the 0.57 premium paid.
With substantial price movement, gains on one option can offset the total premium and yield significant returns.
Risk
Maximum risk is confined to the total premium paid ($5,700), making this a capped-risk trade.
Reward-to-Risk Analysis
Reward potential is substantial to the upside and downside, limited only by the extent of the price move, while risk is capped at the initial premium cost.
Risk Management and Trade Monitoring
Effective risk management is key to successfully executing a Long Strangle strategy, particularly when anticipating heightened volatility in Natural Gas. Here are the critical aspects of managing this trade:
Defined Risk with Prepaid Premiums: The maximum risk is predetermined and limited to the initial premium paid, which helps manage potential losses in volatile markets.
Importance of Position Sizing: Sizing positions appropriately can help balance exposure across a portfolio and reduce excessive risk concentration in a single asset. Using Micro Natural Futures would help to reduce size and risk by a factor of 10 (from $5,700 down to $570 per strangle).
Optional Stop-Loss: As the risk is confined to the premium, no stop-loss orders are required.
Exit Strategies
For a Long Strangle to yield substantial returns, timing the exit is crucial. Here are potential exit scenarios for this strategy:
Profit-Taking Before Expiration: If Natural Gas experiences a significant price swing before the February expiration, consider taking profits which would further reduce the exposure to premium decay.
Holding to Expiration: Alternatively, traders can hold both options to expiration if they anticipate further volatility or an extended price trend.
Continuous Monitoring: The effectiveness of this strategy is closely tied to the persistence of volatility in Natural Gas. Keep an eye on Fundamental Updates in USNGSC as any unexpected changes in natural gas stocks data can lead to sharp price adjustments, increasing the potential for profitability.
When charting futures, the data provided could be delayed. Traders working with the ticker symbols discussed in this idea may prefer to use CME Group real-time data plan on TradingView: www.tradingview.com - This consideration is particularly important for shorter-term traders, whereas it may be less critical for those focused on longer-term trading strategies. Also, some of the calculations and analytics used in this article have been derived using the QuikStrike® tool available on the CME Group website.
General Disclaimer:
The trade ideas presented herein are solely for illustrative purposes forming a part of a case study intended to demonstrate key principles in risk management within the context of the specific market scenarios discussed. These ideas are not to be interpreted as investment recommendations or financial advice. They do not endorse or promote any specific trading strategies, financial products, or services. The information provided is based on data believed to be reliable; however, its accuracy or completeness cannot be guaranteed. Trading in financial markets involves risks, including the potential loss of principal. Each individual should conduct their own research and consult with professional financial advisors before making any investment decisions. The author or publisher of this content bears no responsibility for any actions taken based on the information provided or for any resultant financial or other losses.
