Types of Gaps !!!👨🏫Hello👨🏻🏫, dear traders from all over the world🗺️.
I'm Pejman🙋🏻♂️ & welcome🌸 to one more educational adventure🧭 in Tradingview, but we will not be traders💹 today; We want to look at our charts like a hunter🏹.
We look for every clue🐾 we see so that we can hunt suitable positions💱 like valuable creatures💰 and transfer them to the cages as our accounts💳 or wallets💸.
Although I'm not too fond🙍🏻♂️ of hunting, either legally or illegally.
But I know that hunting good positions in the forests🏞️🌳 of Tradingview is not prohibited😉❗.
So let's get acquainted with these clues🔎 as soon as possible because the price is skittish🙈, and we don't want to waste the hunting time⏳✅.
I said that in Technical Analysis , we look for ways to trade by using the price information, which is recorded on the charts📈. (such as the prey's tracks🔎🐾)
Today I want to introduce one of these clues so that you can become a professional position hunter🏹 by identifying the clues👀;
But don't forget that you should practice🙌🏻, be careful⚠️, and watch your positions👀, so you don't miss them or rush 🏎️💨to the wrong❌ position🙂.
Today's clue is the GAPS . First, let's see what the GAP is🤔.
The gap is nothing. I mean, it is something that is nothing😶🙄.
It is incredibly paradoxical💥! I'm kidding😉, but the space between candles🕯️ or bars is called a GAP.
A gap is created when we see👀 a price gap between two candles🕯️ or bars when the trading volume is high⏫ or low⏬. This difference or space between two candles is called a gap🤏🏻.
It is said that gaps are more valuable✅ in higher time frames among the traders, so much coin, much care👀.
Gaps, or as the Japanese🎌 term "windows," are significant for hunting🏹 positions, so as hunter traders, we should learn these gaps well👌🏻.
The reason🧐 for creating gaps can be factors such as important positive🆒 or negative🙈 news or an increase🔺 or decrease🔻 in supply and demand.
It is interesting to know that gaps are primarily seen in Forex , Stocks , and Commodities (especially when markets close and open).
The space👌🏻 between the candles means that the price has jumped like a rabbit🐰 from one number to the upper☝🏻 different number.
Or, like a monkey🐒, it moved from one number to a lower👇🏻 number.
I tried to make it funny😊 and straightforward👌🏻, but these gaps that move up or down have different types, like the year's seasons🌈☁️.
We have 4️⃣ seasons in a year and also 4️⃣ types of gaps in the charts.
According to personal taste😊, I relate the gaps to the year's seasons and, simultaneously, do not forget the case of hunting positions🏹💰.
So fasten your seat belts💺 because we want to travel in time🧳⏳ to all the year's seasons with this post🚩 and learn about the different price gaps, which are one of our clues🐾 to trap positions🪤.
Let's start with the autumn🍂 season because we are still in it and can understand it better😌.
---------------------------------------------------------------------------------------------------------------------------------------------------------------------------------------------------------------
The name of this type of Exhaustion 🥱 gap.
They are seen at the end🔚 of a process, which means that the process may change🔄 at any moment.
Just like the autumn🍁 season, it may rain☔ anytime after seeing the clouds🌥️.
Another feature of this gap is the increase🆙 in trading volume, so by paying attention👀 to these points and practicing by reviewing the charts📈, you can easily recognize🔎 this gap.
---------------------------------------------------------------------------------------------------------------------------------------------------------------------------------------------------------------
The next💁🏻♂️ gap is the Breakaway 🏃🏻♂️ gap.
The breakaway gap is associated with an increase⤴️ in trading volume.
This gap occurs when a critical range is broken🤞🏻, representing a strong💪🏻 start🏁 trend or a sign of trend change.
Like the blooming🏵️ of some trees🌳 in winter☃️ or the sprouting🌱 of plants from under the snow❄️.
Also, This gap is created when the price starts moving from a limited area, like support or resistance ( I'm going to talk about them in the future😉. )
I have to say that the breakaway gap plays a critical👌🏻 role in some of the classic reversal patterns, such as the Head and Shoulders Pattern , Double Top/Bottom Patterns , etc.
When The breakaway gap is combined with Classic Reversal Patterns, the breakaway gap adds to these patterns' validity✅.
If you want to get acquainted with the most important Classic Reversal Patterns of Technical Analysis , I suggest you read the following post👇.
---------------------------------------------------------------------------------------------------------------------------------------------------------------------------------------------------------------
Now it's time for spring🌸🍀, and I'm going to introduce a gap like spring.
Spring season is a sign✌🏻 of the continuation of life💐, and this gap in technical analysis shows the continuation of a trend📈.
The Continuation gap is also known as a Runaway 🏃🏻♂️ gap, occurring in the middle of a downward↙️ or upward↗️ trend.
This type of gap creates a kind of confidence for traders to enter.
It doesn't occur when the price fluctuates or corrects in a limited area but occurs during a rapid increase or decrease.
So, as a result ☑️, if this gap occurs in an upward trend🔺, it indicates the continuation of the upward movement.
And when it is created in a downward trend🔻, it indicates the entry of more sellers and further price decline.
---------------------------------------------------------------------------------------------------------------------------------------------------------------------------------------------------------------
Now we have reached✌🏻 the last gap🥰.
This gap is Common , but I should introduce it as the summer☀️ season.
These gaps are very common, And considering the time frame it has, it is expected to fill quickly, which is also called "closing the gap."
The filling or closing of the gap means that the price returns🔁 to the same area where the gap was created, like a criminal returning to the crime scene😄.
This can be true✅ for gaps as well.
Time flies in summer🏝️, and Common and Exhaustion 🥱gaps fill as soon as a blink👁️.
You may have heard👂🏻 that gaps are always filled, but this is not permanent🙅🏻♂️ and only a strong possibility🤏🏻.
For example, Continuation 🏃🏻♂️ & Breakaway gaps usually take a long time⌛ to fill.
But what if the gap doesn't close🤷🏻♂️?
Go to any currency pair and examine👀 the recorded data🗄️; You will find that many gaps take a year or more to close.
It is interesting😃 to know that the Japanese🎌 have another interpretation of the price gap.
They use gaps as continuation and reversal trading patterns (as I said, I'll explain them in future posts🔜😉).
It is interesting to know that the combination of gaps can create the Island reversal pattern.
The Island pattern consists of two gaps ; One up⬆️ and one down⬇️.
We will definitely✅ learn more about these patterns in the following posts🔜, but today we are only focusing on the gaps🧐.
---------------------------------------------------------------------------------------------------------------------------------------------------------------------------------------------------------------
Another thing I want to add➕ is about the Heikin-Ashi charts💹 that we learned about in the previous post🔙.
Gaps are filtered❌ in Heikin-Ashi charts.
As I said, in this chart, the average is displayed between two✌🏻 consecutive candles; even candlestick patterns are filtered❌.
So, the type of chart is also essential👌🏻 for finding gaps.
Well, I gave you the basic tips to identify these gaps🤏🏻, and now you can carefully look👀 for them in your charts💹.
Practice this information for a bit, as I will be back soon🔜 with an educational post👨🏻🏫 on how to trade💰 with these gaps.
If you have any questions❓, you can ask me💬.
We will get acquainted with new clues🔎 in new posts, so until that day, take care of your knowledge📊 and increase it every day📈, because according to Kofi Anan:
Knowledge is power💪🏻, and information is liberating. Education📚 is the beginning of progress in every society🏙️, in every family👨👩👧👧.
I hope you become stronger🙌🏻 daily by using your knowledge, and I will also increase your progress by teaching you the introduction.
I wish🙌🏻 you happiness, health😍, and success😎.
Educationalpost

Technical Analysis !!!👨🏫Hello, my trader friends🙋🏻.
I want to tell you the story of Technical Analysis, its advantages & disadvantages.
We're even gonna learn about its branches.
Like any other science, Technical Analysis has come a long way, and it's still evolving. But why should we learn it and know it well?🤷🏻
When you're trading, you may be afraid or greedy. But how do professional traders control these two?🤔
Let me start with a simple example.
If someone turns off the lights & challenges you in a new room, you will feel scared or lack confidence because you don't know that place. But if the challenge happens in your bedroom or home🏡, you'll feel more powerful 💪🏻 and confident because this environment is familiar & you can act better.✅
Fear is caused by the unknown. When you don't know this market, you can't get good results (or at least permanent good results).
So follow this page to conquer all the peaks⛰️ of Technical Analysis together🙌🏻 and learn from A to Z of it.
Also, I'm a fellow traveler on this route🛤️, not your tour guide.
So, if you have any questions, ask me in the comments💬.
My trader fellas, let's take one step👣 at a time because taking long and hurried steps will only hit you harder. I'm with you in all these steps🪜 & get started with the first type of market analysis.
Technical Analysis is old. I mean, it's almost 300 years old📜, but it doesn't like to talk about its age, so we couldn't find the exact information about its birth date🗓️😑.
Maybe it’s from Japan⛩️🎌 and was born in the 18th century, or perhaps its date of birth is in the Middle Ages.
But there is some more information that I'm sure about. For example, in 1879, the Technical Analysis found a friend by the name of Chart📈, and they have not separated until today.
Let's skip this story and be serious☺️. Technical analyzers believe that everything is in the Chart.
In Technical Analysis, there is all the necessary information for trading, such as entry points, exit points, market volume, stock prices in the past and present, etc. (The Chart is a complete encyclopedia for Technical analyzers!!🤦🏻😶 )
There is another type of analysis that examines the available information about a stock (from the founder of a stock or company to the cost and income and even the company manager's records), called Fundamental. But the Technicalists say that even some of the Fundamental information is in the Chart! 😐
Overall, Technical and Fundamental are both complementary to each other and opposite to each other. But both are related to the Chart. (These three have a complicated relationship; I mean, there is a love triangle, so we should stay out of it !!🤫😂 )
Let's skip the joke. All these things are just like the gears⚙️ of a car, but it's not enough. You need to follow more rules in the market to pass the finish line🏁 with your trading car🏎️ . Don't worry cause I'm gonna tell you everything you need to know to win🏆 this trade racing with your strategy car.
Now that we have learned a little about the history of Technical Analysis, it is better to learn about its contents.
The price chart, our most important resource and tool in Technical Analysis, consist of the price-time, Charts, and Candles.
But these candles🕯️ existed 100 years before bar and dot charts.📊📉
In 1700, a Japanese man named Huma realized that the price of rice depended on the emotions of traders in addition to supply and demand.
Candles show these feelings with their colors.
For example, the green candles🟢 show trust and good feelings among people who invested in a stock.🤑
But red candles🔴 indicate doubts or hopelessness of people about a stock, and they sell it.😞
I don't know why I remembered Moody's octopus doll🐙 :)
But candles tell you the feelings of other traders just like these dolls. But only its color is not essential.
Can you guess the other important factors about candles? I will tell you the rest of them soon.😉.
Have you heard that history repeats itself?
By looking carefully🧐 at the old charts, some creative people found that the prices behaved similarly to their past.
They realized that the candles make interesting shapes next to each other, and they made these shapes repeatedly in different periods.🔁
They formed different geometric shapes and patterns & continued to make these shapes until today :)
Let's accept that the Chart is creative and artistic! 🎨🖌️😊
For example, they found a shape called a Head & Shoulders Pattern. This type of pattern will cause a downward trend⤵️ in the Chart.
I tried to find it & place it on someone's Head & Shoulders to remember it better. 😁
Many patterns can be found in any chart, and I have already taught the reversal patterns in my previous posts, But I want to go over all the patterns in detail again in the future, so let's dive into the other contents of Technical Analysis.👇
Using formulas, mathematical🧮 ratios, and advanced calculations, indicators were created that can generally show the market's present and past and give a relative opinion about the future (Please don't get the indicators wrong with magic 8 ball🎱 or Professor Dumbledore's wand✨. )
Let's be serious about it. Maybe you know that indicators depend on the two factors of time and place of price.
In terms of time🕦, they are divided into two categories: leading and lagging.
In terms of price movement💹, they are divided into three categories: trend indicators, oscillators, and volume indicators.
The indicator that I made the above meme for is a leading oscillator.
Now it’s time to go for the other various tools that are made by using numbers🔢 and people’s actions in the market.
A person named Nelson Elliott made a useful tool, although, after his death, many people worked on this tool and improved it until today it reached us, but we are going to discuss it better in the following posts like the rest of the contents of Technical Analysis.😉
But I have to say Elliot believed that the market is not disordered and always repeats a repetitive cycle, and Eliot called these repeated movements waves.
According to him, if you can perfectly identify the repeating patterns in the price, you can predict how the price will change (or not change) in the next phase.
Eliot published his experiences and theories in a book called the waves principle, which I recommend if you want to get good information in this field; it's better to start from the origin of this theory.
I think there is no better definition for the word "Wave" than sea waves🌊, and I tried to draw Elliot waves like sea waves reaching the shore. 🏖️
In the end, I want to say that whatever style of analysis you have or whatever type of Chart you use, in the future, this machine will not go the right way without following a series of principles.
Suppose you have the best car in the world, but you neither know how to drive nor the rules. It can be guessed that you will either crash with someone or break the car💥.
You should have risk management along with your trading system, and don't forget that no trading system is perfect.🙅🏻
It is better to try each method on demo accounts before making real trades.
Of course, you can count on me and ask any questions you may have.🙂💭
In the following posts, I’ll talk more about the things that have been said and introduce you to good trading systems that can be obtained from any method.
I'm by your side so that if you are a beginner, you can find your own way, and if you know the market, we can learn the basics of this market better & together🤝🏻.
Wish you happiness, health & success guys🙋🏻.

Bitcoin Historical Volatility new low Here we have the BTC historical Volatility Index in blue. Orange is the price of BTC. The teal line is the 50sma for volatility. At the bottom, I have the correlation coefficient (CC) for the volatility index with BTC. I have marked in green when the CC reaches above 0.50, and red when it crosses below -0.50. The fibonacci retracement is fairly arbitrary, but fits nicely between 0.25 and 1.00. In this article, I would like to discuss a little bit about volatility. It is often associated as going up when price goes down, but is a bit more specific in what it is telling us than simply being an inverse price indicator. Next, I’ll talk about the correlation coefficient. It is an excellent tool that every trader, and investor, should learn to use. Finally, I would like to examine some of the similarities between our recent all time low in this index, breaking the low 2018, which proceeded the infamous 2018 capitulation event.
Volatility is always an interesting indicator, and is often used to indicate position risk for the asset it is being calculated for. Simply stated, it is a measure of how much the price of an asset moves in a particular period of time. However, it can be calculated a number of different ways. The most common is standard deviation, or how far price is from an average of the price over a recent period of time. The amount of time the data is taken from can also change how the volatility measure acts and how useful it is. More so, because it measures movement, and not so much direction, it can be difficult to use it in an accurate way, as correlation appears to be inconstant at face value. Historical volatility is calculated a little differently. And honestly, before reading a few papers on it for this essay, I had not realized that ‘historical’ referenced the calculation method as opposed to it being the history of the volatility. Historical, or realized, volatility is an estimation of the standard deviation of the price of returns over a particular period of time, in this case, 24 hours. It can also be calculated with a weighting for the trading volume over the calculation period. I have placed a 50ma (150 day moving average) to show a general range for average volatility, and we can see that MA tends to oscillate between 2.5 and 5.0.
The correlation coefficient is an excellent indicator that allows you to see, and quantify, the correlation of your current chart with any other chart ticker. Here I have it set to the BLX all time price index for BTC. The higher it goes, the more correlated the movement of the 2 charts are, and below zero indicates an inverse correlation. When CC is near zero, the movements of the two charts are NOT correlated. One of the issues with volatility indexes is their accuracy can vary, and is sometime disputed. My goal in using the correlation coefficient with this index is to parse out when volatility is most useful to pay attention to, and in which direction. On this chart, we can see that when volatility spikes above 10, it is often correlated with big, sudden moves to the downside. However, not all of them are. By using the correlation coefficient, we can parse out the direction of volatility. When CC is in the green, and volatility increases, we see the price of bitcoin moving up, usually in an explosive manner. Likewise, inverse correlation is often showing us downwards movements. I find this a useful way to pull a little bit of the noise out of the volatility index.
The previous all time low in volatility of 0.35 occurred on October 28th of 2018, and about sixteen days before the 2018 capitulation event began. About a week ago on Christmas day, we broke that low, going down to 0.34. Very low volatility tells us that price isn’t just moving sideways, but is pretty flat for the most part. And if you have been following bitcoin lately (bless your soul) you know flat and boring is kind of an understatement. The good news is that it’s likely going to get exciting soon. Volatility doesn’t seem to stay at or below 1.0 for very long, and seems to be either correlated, or inversely correlated with price within a few weeks to a month after reaching 1.0. An exception would be from August of 2019 to the pandemic crash in 2020. We can see some similarities in both volatility and the correlation coefficient between the time leading up to the 2018 capitulation event and our recent data in 2022. Price action is also fairly similar (flat and boring) with the exception that in 2018, the line chart had a small move down and back up during the flatness, while we had a small move up and then down earlier in December. Although, I doubt this really means anything. In 2018, we saw a 50% drop after price had already fallen around 70%. From top to bottom, the draw-down was just under 85%. Another 50% draw-down from where we are at the time of writing would take the price of bitcoin to just over $8,000.
So what does this mean? Well, I can tell you, for sure, 100%, that I can not tell the future. I will be, however, watching my new chart very closely. But I would say it is likely we’ll be seeing something exciting, and it will probably be in January. Unfortunately, it looks like CC moves down just as fast as price, and as fast as volatility moves up during sudden, capitulation like events. However, Bitcoin always has a way of surprising everyone. If CC moves down to 0, and then puts in another local high in the next week, I would be a little spooked. If it keeps moving up to 0.50, it may be an interesting and unexpected move to the upside. Regardless of what happens, I would encourage everyone to try to understand volatility a little better than you already do, and use the correlation coefficient indicator. It is a simple, yet versatile tool that can be used to quantify data in a way that makes a trading strategy precise. Here’s to 2023, I wish you well, and thanks for reading.

5 IMPORTANT INDICATORS FOR BEGINNERSHi guys, This is @CRYPTOMOJO_TA One of the most active trading view authors and fastest-growing communities.
Consider following me for the latest updates and Long /Short calls on almost every exchange.
I post short mid and long-term trade setups too.
Moving Average
A moving average is a technical indicator that combines price points of an instrument over a specified time frame, and divides by the number of data points, to give you a single trend line. It is popular amongst traders because it can help to determine the direction of the current trend, while lessening the impact of random price spikes.
A moving average will enable you to examine the levels of support and resistance, by analysing the previous movement of an asset’s price. It is a measure of change that trails the previous price action of an asset, assessing the history of market movements to determine possible future patterns. A moving average is primarily a lagging indicator, which makes it one of the most popular tools for technical analysis.
Calculating an MA requires a certain amount of data, which can be a large quantity depending on the length of the moving average. For instance, a ten-day MA will require ten days of data, while a one-year MA will require 365 days’ worth. A 200-day period is a very commonly used timeframe for MA.
The indicator is described as ‘moving’ because the introduction of new figures will replace old data points and ‘move’ the line on the chart.
Bollinger Bands
Bollinger Bands are typically plotted as three lines:
An upper band
A middle line
A lower band
The middle line of the indicator is a simple moving average (SMA).
Most charting programs default to a 20-period, which is fine for most traders, but you can experiment with different moving average lengths after you get a little experience applying Bollinger Bands.
The upper and lower bands, by default, represent two standard deviations above and below the middle line (moving average).
If you’re freaking out because you’re not familiar with standard deviations.
Have no fear.
The concept of standard deviation (SD) is just a measure of how spread out numbers are.
If the upper and lower bands are 1 standard deviation, this means that about 68% of price moves that have occurred recently are CONTAINED within these bands.
If the upper and lower bands are 2 standard deviations, this means that about 95% of price moves that have occurred recently are CONTAINED within these bands.
Relative Strength Index ( RSI )
RSI is considered overbought when above 70 and oversold when below 30. These traditional levels can also be adjusted if necessary to better fit the security. For example, if a security is repeatedly reaching the overbought level of 70 you may want to adjust this level to 80.
Note: During strong trends, the RSI may remain in overbought or oversold for extended periods.
RSI also often forms chart patterns that may not show on the underlying price chart, such as double tops and bottoms and trend lines. Also, look for support or resistance on the RSI.
In an uptrend or bull market, the RSI tends to remain in the 40 to 90 range with the 40-50 zone acting as support. During a downtrend or bear market the RSI tends to stay between the 10 to 60 range with the 50-60 zone acting as resistance. These ranges will vary depending on the RSI settings and the strength of the security’s or market’s underlying trend.
If underlying prices make a new high or low that isn't confirmed by the RSI, this divergence can signal a price reversal. If the RSI makes a lower high and then follows with a downside move below a previous low, a Top Swing Failure has occurred. If the RSI makes a higher low and then follows with an upside move above a previous high, a Bottom Swing Failure has occurred.
MACD(Moving Average Convergence Divergence)
Moving average convergence divergence, or MACD, is one of the most popular tools or momentum indicators used in technical analysis. This was developed by Gerald Appel towards the end of 1970s. This indicator is used to understand the momentum and its directional strength by calculating the difference between two time period intervals, which are a collection of historical time series. In MACD, ‘moving averages’ of two separate time intervals are used (most often done on historical closing prices of a security), and a momentum oscillator line is arrived at by taking the difference of the two moving averages, which is also denoted as ‘divergence’. The simple rule for taking the two moving average is that one should be of shorter time period and the other longer time period. Generally, exponential moving averages (EMA) are considered for this purpose.
Description: The main points for an MACD indicator are:
a) Time period or interval – which the user can define. Commonly used time periods are:
Short-term intervals – 3, 5, 7, 9, 11, 12, 14, 15-day intervals, but 9-day and 12-day durations are more popular
Long-term intervals – 21, 26, 30, 45, 50, 90, 200-day intervals; 26-day & 50-day intervals are more popular
b) Momentum oscillator line or divergence or MACD line – which can be simple plotting of ‘divergence’ or difference between two interval moving averages
c) Signal Line – which is exponential moving average of divergence data e.g. 9-day EMA
d) Normally a combination of 12-day and 26-day EMA of prices and 9-day EMA of divergence data is used, but these values can be changed depending on the trading goal and factors
e) The above data is then plotted on a chart, where the X- axis is for time and Y-axis is price, to get MACD line, signal line and histogram for the difference between the MACD and signal line, which is shown below the X-axis
Volume
Volume, or trading volume, is the number of units traded in a market during a given time. It is a measurement of the number of individual units of an asset that changed hands during that period.
Each transaction involves a buyer and a seller. When they reach an agreement at a specific price, the transaction is recorded by the facilitating exchange. This data is then used to calculate the trading volume.
Trading volume can be denominated in any trading asset, such as stocks, bonds, fiat currencies or cryptocurrencies. For example, if Alice sells Bob 5 BNB for 20 USD each, the volume of that transaction can be either 100 USD, or 5 BNB, depending on what the trading volume is denominated in.
This also means that for a stock, for example, the trading volume refers to the number of individual stocks that were traded during the measured period. So if 100 shares are traded in one trading day, the daily volume of the stock is 100 shares.
Traders tend to use the volume indicator as an attempt to gain a better understanding of the strength of a given trend. If volatility in price is accompanied by high trading volume, it may be said that the price move has more validity. Conversely, if a price move is accompanied by low trading volume, it may indicate weakness of the underlying trend.
Price levels with historically high volume can also give traders an indication regarding where the best entry and exit points could be located for a specific trade setup.
Typically, a rising market should see increasing volume, indicating continuous buyer interest to keep pushing prices higher. Increasing volume in a downtrend may indicate increasing sell pressure.
Reversals, exhaustion moves, and sharp changes in price direction are often accompanied by a high volume spike, as these tend to be the times when the highest amount of buyers and sellers are active in the market.
Volume indicators often also incorporate a moving average, measuring the volume of the candles in a given period and producing an average. This gives traders an additional tool to gauge the strength of the current market trend.
If you like our content, please feel free to support our page with a like, comment & follow for future educational ideas and trading setups.

Golden Advice from Takashi Kotegawa🎥Takashi Kotegawa turned around $12K to $200M in just 8 years and reached a net worth of a whopping $ 1.8B from trading in his bedroom🍻 When I met Stocks Genius Takashi a few years ago, he gave me one of the best trading advice👇🏻
Trade with small size while learning
Only risk 1% of your account size each trade
Master one setup
Find a solid mentor
Journal your trades and study your data
Follow your plan consistently regardless of the outcome
Take Trading decisions as unemotionally as possible
Focus on these points, instead of focusing on goals like: I want to make 5K or 10K a month🍻

Educational How Beat Retailers. Mostly Retailers Trap with SMC Traders. Please Carefully all education is good for you and beneficial for you.
if you want to Trap Retailers then you can learn SMC Trade Setup.

How to differentiate a fake-out from an actual break-outHappy Friday, sorcerers. Welcome on another educational post by Investroy!
The trading and investing industry is a difficult one to succeed in as it has various complex details that you need to dig into both from technical and psychological perspectives. Predicting the price movement and understanding the logic behind it may be challenging at first. But as time passes and you gain experience, you understand the science behind price action and make more logical decisions.
Today, we will talk about a rather puzzling issue faced by many beginning and experienced traders: the theme of differentiating fake price movements from real ones. Although, it is not always possible to separate the two to the full extent, it is feasible to build a plan around it and stick to it on a consistent basis.
A fake-out is a failed attempt of the price to break above/below a key zone. Very often, it is associated with liquidity grabs and Stop Loss hunts. To demonstrate, looking at the illustration pictured on the chart, you can see how the price attempts to continue its bullish moves, but fakes out from the sideways-moving range and re-enters the borders of it instead.
On the contrary, a breakout happens when price successfully penetrates a key level and continues its impulsive moves in the same direction
Now, the question is: how to distinguish a real breakout from a fake one?
Firstly, it has to be kept in mind that what goes up, must come down. In trading terms, after an impulsive move, a correctional one should come; after a breakout, a re-test should happen before continuing impulses. In order to identify whether a breakout is a fake or a real one, we should always look for a re-test of the penetrated zone after a break is completed. However, you have to keep in mind that it is not a 100% fact that a re-test will happen every time. Sometimes, breakouts will be so impulsive that price will not retrace back to re-test a penetrated zone.
Nothing is 100% accurate in trading. Not every breakout will lead to a re-test before impulsive continuations. Not every fake breakout will seem like a fake-out at first. However, waiting for a re-test of a broken zone is a good way to evade fake breakouts and capture high risk-to-reward trades and opportunities.
To conclude, if you want to make sure you don’t get faked out and liquidated, always wait for a re-test of a penetrated level before forming biases and executing positions.

Do not get caught in this trap!Good time of the day, friends! Rushing into trades is definitely among the top #3 common mistakes done by relatively newer market participants who we would call early sellers in this context.
The chart/infographic above is pretty self explanatory, but let’s still cover some aspects of it by considering a following scenario:
Market was moving sideways the whole week, you almost lost hope to finish the month in profits and now you see the up-trending channel with already 2 lower trend-line touches. You instantly get excited and set a long position in the area of a third touch. Well, next thing you know it plummets right past through it. Lesson learned, but what can be done to avoid that?
Well, first of all “look for multiple confluences”. Does the third touch coincide with a potential support zone? If not, that already weakens the point. Was there any signs of bottom forming and reversal? Another strike if not. Did it coincide with any Fibonacci levels, for instance? No? You’re out.
Going over mistakes is easy, as there are always so many things that can go wrong, but what’s an alternative then, you may ask. On the chart above, we also indicated a point where we would consider entering the mentioned trade. Patient execution with a proper Risk-Reward is a way to do it.
Hope this helps, and tune in for more content for us!

How you trade impacts how you feel 😀It's no secret that managing your trading psychology is the biggest challenge in your trading journey.
Some say it counts for 80%+ of what's needed to be successful.
I totally agree...
However, there's a key factor in this for me.
How you actually trade to start with!
Correct trading psychology starts by realising you need a strategy.
If you're guessing with no real plan or risk management surely you're going to be more stressed and overwhelmed than a trader who has a plan, has the data to support his strategy and manages his risk?
So once you get your system/strategy nailed on, this in turn will help manage your fear.
Greed is another factor, but this comes from your expectation.
Expectations and reality need to be aligned with one another.
Your expectations can come from your data and your testing.
But if you've skipped this step you'll be chasing unrealistic expectations.
Not just in terms of % gains, but in understanding your drawdown periods too.
So in summary both are completely related. You give me a trader that's really struggling with his trading mindset and fear and within a month they won't be feeling the same way.
Likewise, if give me a trader who is calm and in tune with his system and emotions, we'll quickly change this by getting him to trade randomly!
No trading psychology means no trading strategy, No trading strategy means no trading psychology. These two elements are so intertwined.
Thanks for looking at my idea.
Darren 👍

Gut feeling in trading.I hear many traders talking about gut feeling, especially when referring to very good traders. I hear them saying that you will, at some point, feel what the market will do next. Many explain it as a sixth sense or cannot it explain it at all. I say to them the explanation behind is a much simpler one.
Gut feeling in trading, in most of the cases, is nothing else but subconscious pattern recognition. There is nothing magic here, it is simply related to how the human brain works in day-to-day life.
The trader looks at his screen for thousands of hours. Every day, he tries to analyze the price movements, while the brain stores the information in an abstract way into neural maps . Millions of neurons fire and wire together and create complex memory banks which include associated emotional responses. Day after day after day, these memory banks are reinforced and restructured until the neural maps are hardwired.
This process is all subconscious. The part which is even more interesting is the way the human brain retrieves the needed information stored in those complex neural maps . This mechanism is also done subconsciously and this is why many label it as “gut feeling”. So, when a trader instantaneously “feels”, in an apparently strange way, what he should do when he sees a particular market event, his brain has subconsciously identified a store pattern.
You may ask yourself: So what? What difference does it make knowing this? I say it makes. When you understand how your brain works you should also realize that you have at your disposal an extraordinary working instrument, but this will not guarantee your success by itself. Those neural maps need quality data. Programmers are accounted with the saying “garbage in garbage out”. It’s the same with the human brain.
If you don’t put the true intellectual effort in your day to day market observations, if you don’t approach what you see from multiple angles, if you don’t analyze your own emotional reactions, then your neural maps will be built on superficial data. You will only reinforce all sorts of ineffective pattern recognition processes, no matter how long you stare at the screens. By contrast, if you do it right, your “gut feeling” will evolve and become very valuable.
Evolving as a trader is not only a function of how much time you spend trying. What really matters is what you are really doing and how you are doing it. This explains why so many traders cannot become profitable even after years of trying. They are caught in inefficient and superficial ways of looking at the market.
So many retail traders rely exclusively on technical patterns. They don’t understand what really moves the markets and how those patterns are formed. They spend years and years switching from one technical indicator to another, without realizing they are unconsciously accumulating only superficial data. Some realize the trap … most don’t

Exit Strategies to Consider on Each Trade: a Complete GuideEnter, monitor, and exit are three vital steps to follow while trading. While most traders focus on how and when they can enter a particular setup, they pay less attention to their exit strategy. Today, we are gonna look into some popular exit strategies that we utilise in our personal trading.
1) Breakeven closure
When the price is moving in our direction and is already a few key zones away from the entry zone, we make the trade risk-free by moving the Stop Loss level to the price of entry.
If the Stop Loss gets hit, we exit the trade with neither a gain nor a loss.
2) Manual Closure
In the process of monitoring, if the price does not play out according to our plan, we tend to make quick decision and exit the trade earlier than planned.
3) Target Profit
We set a Take Profit (TP) order that closes the transaction as soon as it gets triggered.
4) Stop Loss
We set a Stop Loss (SL) order that closes the transaction as soon as it gets triggered.

Elliott Wave DegreesRalph Nelson Elliott acknowledged 9 degrees of waves from the Grand Super Cycle degree which is found in weekly and monthly time frame to the Sub-minute degree which is found in the hourly time frame. He labelled them as below mentioned.
1 Grand Super Cycle
2 Super Cycle
3 Cycle
4 Primary
5 Intermediate
6 Minor
7 Minute
8 Minuette
9 Sub-Minuette
It is a good understanding to start applying a wave count to a market from higher degree to all the way lower degree which you want to trade. you need to first learn about the labeling of wave degrees. Elliott Wave is a very helpful to understand the charts of any assets. the waves from the main degree are subdivided into intermediate waves which also subdivided into minor waves and the minor waves are also subdivided into minutes waves and then to sub-minutte waves, each degree of waves consists of one full cycle of motive and corrective waves. each degree of trend is labelled with a different style of label for a better understanding.
If you want to trade in 4H so then you will look for and count the monthly, weekly and the daily charts is will.
Hope you understand the concept of wave degrees.

How to calculate which lot size to useAs mentioned several times before, we risk 1% of our total trading capital per transaction. In simple terms, we risk 1 egg out of the 100 that we have in the basket in an attempt to get more eggs.
However, even though the average price mark where we place our Stop Loss is 30-60 pips away from the entry price, SL levels set differ from one trade to another, and different currency pairs have various differences in pricing (major pairs have small differences for the most part, while minor and cross-pairs have big gaps in pricing).
This article will demonstrate 3 random scenarios and illustrate which lot sizing is needed to be used based on the Stop Loss set and the percentage of the total capital risked while taking into account the size of the trading account. All numbers are imaginary in order to diversify the visualisation of the portrayed examples and give a better understanding of the case.
Enjoy the idea and don't forget to drop your questions in the comment box below!

Finding your optimal performance 🏃♂️Most traders spend a good bit of time looking at charts.
Well here is a chart we traders should all take a look at.
The chart shown is the Yerkes-Dodson Law.
The Yerkes-Dodson law is a proposition that people perform best at intermediate levels of arousal, and that performance is lower at high or low levels of arousal.
The theory behind this is visually represented by the graphic in this idea.
No arousal levels or a bored/laidback approach to life will mean no stress but no real performance in what you are trying to achieve or do.
However when arousal and stress gets too high by pushing to hard, performance starts to decrease.
It's about finding the right balance to achieve an optimal performance.
A certain level of stress about what you are trying to achieve motivates you to study, learn or train in order to do your best.
A sportsperson has to get bumped up before an event as well as train hard, But getting to worked up and training to hard could cause a decrease in performance when it comes to the event.
Pushing not hard enough to pass an exam will lead to a fail as you haven't studied or don't care, But also pushing to hard could lead to a fail as you've let stress and anxiety take over forgetting everything you studied.
Moderate levels of arousal is best for overall performance.
This theory can be applied to your trading.
Take a non interested approach or bored approach and you performance in this area will be affected. Less potential profits etc.
Get to focused on your trading or trade to hard could lead to poor performance along with a load of stress in your life.
You as an individual will have to self reflect and determine where you fit on the curve in the idea graphic.
If you fell more success, achievement and happiness can be had, by all means crack on and go for it!
However, if you are getting to a point where you feel you might have reached your limit, it could well be time to dial it back a bit.
Don’t push to hard for it that you go down the opposite side of the curve.
This theory can be applied to every aspect in your life by using it to balance all aspects of your life will also help your trading as well as work, relationships and everything else we all go through day to day.
Thanks for taking time to read this.
Darren 🙌

The Inside Bar ConceptThe Inside Bar is a lovely pattern that shows consolidation in a valuable way. As you can see the candle parent candle creates the high and low that will low key to know the consolidation is over. Price staying inside this area tells you so many things !
1. The Market volume is low in terms of trades being executed on the instrument.
2. Where price is at fair value
3. When price action is ready to leave fair value.
Take a look at your chart and back test this. You will be amazed !

Is mindset holding you back 🤔Trading can be a rollercoaster of emotions.
Many traders are unaware of when their state of mind leads to underperforming trades and why it happens.
We are all different and unique when it comes to trading, and understanding the type of trader you are is essential to your success.
Traders can spend a lot of time studying technical indicators and strategies, but understanding the psychology driving your trading decisions is just as important.
The first starting point of getting on the right path in regards to trading psychology and emotions is by having the right one of two mindset choices.
There's two mindsets which will effect your trading results and progress massively.
They are 'Growth mindset' and 'Fixed mindset'
Of those two mindsets there is only a place for one when it comes to trading and that is 'GROWTH MINDSET'
The graphic on chart shows the difference between the two mindsets.
If you can't ditch the 'Fixed mindset ' you will never be able to progress in trading.
No matter how great of a trader you think you are, or how well you think you handle your emotions.
It's impossible to remove them from the equation completely when trading.
When emotions are combined with a 'Fixed mindset' mentality however you are going to feel emotional pain and loss of money when it comes to your trading.
Once you have learned to recognise your mindset, you can then begin the next important step of switching to the ' Growth mindset '
People with a ' Fixed mindset ' believe they are born with a certain amount of intelligence and that it is fixed for the rest of their lives.
People with a 'Growth mindset ' however know that intelligence is not fixed and that you can in effect grow your brain.
They see their traits as just a starting point and know that these can be developed by hard work, effort, dedication and challenge.
Having a growth mindset can improve your progress and attainment and this is crucial in being successful as a trader.
The brain can be developed like a muscle, changing and growing stronger the more it is used.
Your abilities are also very much like muscles they need training in order to perform at their peak.
You can learn how to do anything you want to do and you can get better at whatever that is with time and consistent practice.
Even if you have what you perceive to be a talent or ability for something, if you never practice that talent or ability you simply will never improve.
Applying this theory to your trading game will help you grow not just your accounts but as a person also.
Get that 'Growth mindset' and start believing in your ability to change.
Thanks for looking.
Darren 🙌

"Stop it, Picasso! Trading should be kept simple."Quick question: which of the two illustrations portrayed on the graph do you enjoy more?
If your preference is the one on the right, then you should have definitely continued the legacy of the Renaissance era artists. On the contrary, if you prefer the one on the left-hand side of the screen, let’s become friends.
Starting with the portrait (let’s put it that way) on the left, we can observe how everyhting is illustrated in a crystal clear way. Firstly, no indicators have been used, which makes it easier for us to read the chart. Second, it has been shown that with as few as 2-3 confluences, a trade has been executed.
On the opposite side of the road, we have the portrait which is depicted on the right side of the screen. We can see how blurry, messed up and confusing it all looks. Two random EMA’s crossing each other, ABCD patterns, Elliott Waves, tens of thousands of Fibonacci retracement levels, random Support&Resistance levels and many other indicators have been added into the chart with zero purpose. Yes, indicators could and should be used as confluences. However, by adding tens of indicators into your charts, you are not beating the market. Just like in real life, everything should be utilised in moderation.
The purpose of this idea is not trying to damage the reputation of indicator trading, but to show that pure price action will always be the king. Many beginning traders get tricked into believing that by adding multiple indicators into their charts, they will have a high win rate, a successful trading journey, long-term profitability. Little do they know that many indicators contradict to each other and perplex novices into entering random positions.
Of course, as we always say, if it works for you, then go for it. Chart analysis is only a part of your trading plan. There is also psychology, risk management, discipline and so forth.

Some cool features on Tradingview!Many times we search for holy grail strategies that works and we tend to ignore some little stuffs that can help us defeat that 'Goliath', the giant market. We all know that there's no such thing as a 'holy grail' strategy. There are only certain things (simple things) that needs to be combined and when used well these can be good strategy to help us defeat that furious Goliath.
In this article I am going to discuss about some cool tradingview features which are important to every trader and which we should not dare ignore. You might be familiar with these or perhaps already use these in your day to day trading activity.
The first one is Alert.
This feature allows you to set alerts on certain levels of interest or price. Once the market reaches the price or level you specified you get notified immediately by visual popups, audio signals, email alerts and email-to-sms alerts. You can set alerts like, "Alert me if Bitcoin crosses above $25000."
You can set alerts on your trendline, indicators like moving average and once the market touches the desired level of your indicator you receive a notification. How cool is that!
Instead of you watching the chart 24/7 to wait for Bitcoin to reach $25000, you can set an alert on that level so you get notified once price reaches there. Why alerts relevant in trading? Just like you need alarm in the morning so you don't miss an important appointment, you need alerts so you don't miss important trading opportunities. Alerts have really helped me to focus on quality trades. All I do is set an alert in advance if I see that Gold will reach a strong support in few days, because there can be a lot of interruption. Once Gold reaches the support level I get notified.
Go have fun with your friends buddy, just set that alert and be notified once the market reaches your desired level.
The second feature is Replay
Replay tool on tradingview can be used to study past price action and trading history.
Why is this feature relevant?
Well, if you want to master your strategy one way to do is to study historical data or price action. With the replay tool it can allow you to go back moment in time and replay the same price action that occurred in the past. That way you can practice your strategy and see how you could have traded that market.
The third feature is News/Headlines
If you want to receive news and headlines of what is shaking the market then you should not ignore this feature. With just a click of a button you can view important headlines that is moving the market. What I find interesting about this is, the news or headlines you see is specified by the instrument that you are currently viewing on the chart. For example, if you are currently on EURUSD, once you click on the news icon, most of the headlines you will see there are those that will have a direct impact on that pair. How beautiful is that! Instead of you having to struggle to search for fundamental information affecting the market, this feature has everything you need to stay on top of financial news.
The last feature in this article is Screener.
Screener is a tool that can be used to scan and filter instruments based on market cap, dividend yield, volume to find top gainers and most volatile instruments.
Why is this important?
If you want to learn which instruments are gaining or weakening then the first place you need to go is to the screener. By looking at the stock screener it helps me gauge how the stock markets are doing thus it helps me have informed decision as to what to focus on and it helps me have strong conviction in my biased.
Do you use these tools in your trading?
Note: Some of these features you need to have a paid plan with tradingview for them to be enabled.

This is why patient traders are profitable and consistent"Cut the losers only, let the winners run". One of the quotes that are pretty popular among beginning and experienced traders. Sounds pretty simple, but let's take a look at it in practice.
On the left-hand side, we have illustrated the recent trading history of a patient trader, and on the right side, that of an impatient one. Taking a close look at the recent trades of the patient trader, we can observe that he has a solid trading plan, rock-solid psychology and discipline, and a very good risk management plan. Out of 5 trades, he has only won 3 of them. But due to the fact that he risks only 1% of his trading capital per trade and sets realistically-positive Take Profit levels that vary depending on the market, he makes really appetising returns.
On the contrary, the impatient trader has everything to fail. If we take a look at the recent trade history, we can notice that this trader neither has a well-defined risk management strategy nor any discipline or patience (well, the name says it all).
There is a common misconception in the world of trading that states: "the higher your win rate is, the more profitable you will be in the markets". This statement is absurd and totally incorrect. No matter how high your win rate is, if you are not risk tolerant and you put all of your eggs in the same basket, you will be far away from reaching the doors of consistency and profitability.
To add, patience and a strong psychology are heavily linked and cannot exist without each other. Hence, once you teach your mental state the importance of the ability of sitting on your hands and waiting, your trading journey will head towards the correct direction.
Enjoy the read!
Investroy.

Unraveling the bitter truth about compounding in trading"I'll start with $100 and flip it to $10k" is one of the lies we tell ourselves when we first start trading. Although compounding can do some wonders, without realistic expectations and targets, you will not reach your goal.
Illustrated on the chart, we can see a sincere and a deceitful statistical representation of a compounding system based on a year-long tracking. All numbers depicted in percentage-based returns are for example purposes. For both cases, we will have a $5000 beginning capital to work with.
Looking at the left hand-side of the screen where the realistic statistics are, we can observe that the ROE (return on investment) numbers differ from one month to another. Some months result in a small loss, some are in deep profits and so on. Just like every single trade, every single month should result in the following:
- A big win
- A small win
- A small loss
- A breakeven
On the contrary, looking at the table portrayed on the right side of the screen, we can see a blurry image of compounding. Expecting to make a fixed return of 10% every single month is nice, but unrealistic. No matter how well-backtested your trading strategy is, in the world of business and finance, nothing is 100%. Plus, there are several factors influencing our trading life: changing market conditions, negative impact of the surrounding environment on our everyday lives and so on. What we are trying to emphasise is that mentally and psychologically, it is impossible to make huge returns consistently on a monthly basis.
The bottom line: have a trading plan that fits your lifestyle the most, be disciplined, risk-tolerant, cold-blooded. And most importantly do not rush the process, as good things come to those who wait.

How to spot and avoid Stop Loss hunting: a complete guide Stop Loss hunting happens every trading day, and it's not something you would want to let fly under the radar.
We have carefully orchestrated some examples on the graph to give a clear picture of what this phenomenon really is, and listed some tips on how to avoid getting into this mouse trap.
In basic terms, Stop Loss hunting is the strategy of the price action spiking above/below key levels to enter the pool of Stop Loss orders and take the masses out of their positions before moving the price in the destined direction.
Looking at the first example, we can observe that a nice double top pattern has been formed. This is one of the clear indicators that the price might potentially drop after failing to rise above and forming a new top. Thus, a trader would most likely go short and set his Stop Loss a few pips above the freshly formed area of resistance. What happens next is obvious - a trader gets liquidated. Why? because him and tens of thousands of other market participants had set their Stop Losses at a very obvious key level - above the local zone of supply. After successfully spiking up and grabbing some liquidity, the price peacefully continues its bearish movements in the predetermined direction.
The second example is a similar one as well. "What a beautiful ranging market. Let's buy at support and sell at resistance." Only if it was that easy...
What happens next, the price spikes below the lower boundary of the sideways-moving range and grabs liquidity before moving in the upside direction.
Stop Loss hunting scenarios will always happen, and to be honest, we cannot really avoid them all. However, there are some tips that we can follow in order to evade these traps.
Firstly, you should never rush into entering positions. Eventually, the price will come to your levels and develop into some patterns (Double Top, Head&Shoulders etc.) before starting its big moves.
With that being said, no FOMO either. There will always be fish in the sea, just like there will always be opportunities in the market. Be patient, cold-blooded, and wait for your time.
Do not set a tight Stop Loss, because you will most likely get taken out immediately. Either set a wide one so you can escape hunting in case the price starts spiking up and down, or wait for cases of a fake breakout a.k.a liquidation before entering a position.
Last tip is a pretty smart one: set your entry orders at levels where masses would put obvious Stop Loss orders. Then, you will notice how many times the price goes in that direction.
Hope you enjoyed this Educational Post, dear TradingView community members! If you have any suggestions or recommendations for the next educational idea, feel free to let us know in the comment section below.

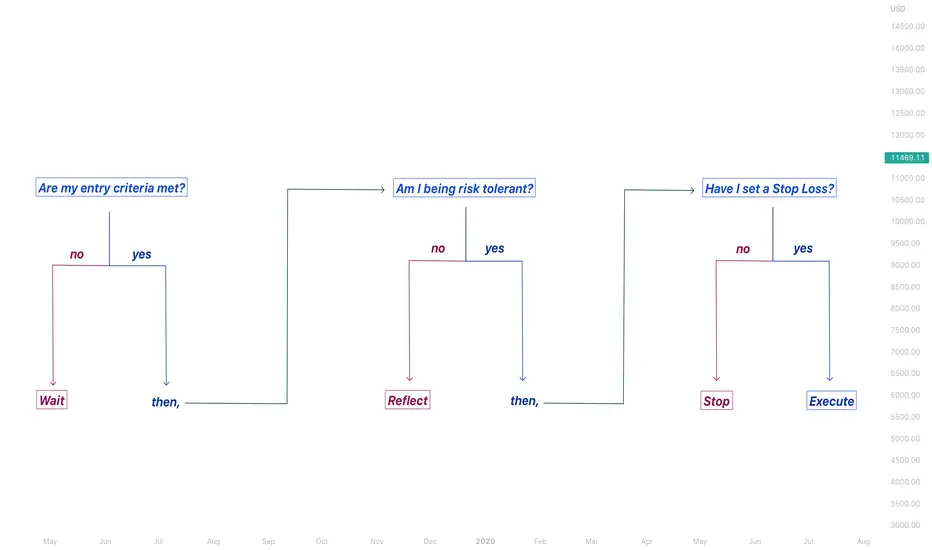
Questions to ask yourself before entering a tradeThere is a set of questions to ask yourself before opening a transaction and we will talk about some of the common ones.
1) Are my entry criteria met?
Undoubtedly, everyone has his own style of trading. Entry and exit strategies should be included in each and every trading plan there is. Only if the entry criterium is met, should we enter a position on any security. No FOMO, if our entry criteria have not been met, we sit on our hands and patiently wait.
2) Am I being risk tolerant?
Am I risking my usual 1-2% per position or I am too confident in this setup and would rather go all in? If you see yourself risking more than you usually do on a single trade, pause for a minute and thoroughly reflect. Yes, you can have some winners while risking a big portion of your total capital on a position, but does that not make you a gambler? Always remember that it is a marathon and not a sprint.
3) Have I set a Stop Loss?
Many people will say that it is not mandatory to set an SL if you are a position trader. Let me tell you this: a trade without a Stop Loss is like jumping off a cliff without a parachute. No matter how confident you are in your analytical skills, you can never be 100% sure that a trade will play out thoroughly according to your technical setup. Use a Stop Loss and carry on!
While there are many more questions that you may ask yourself before executing a position, we have addressed some popular ones. Of course, it solely depends on your trading plan, but the aforementioned questions can be implemented in every strategy.
Hope you enjoyed the read and thank you!
Don't let the dopamine get you 🥴Do you feel excited? 😅
This is why. It's all down to the chemical reaction in your brain. Dopamine.
Dopamine is a chemical in the brain that makes us feel good.
Should you be feeling excited when trading?🤔
No.🙈 As this isn't gambling and shouldn't give you the same dopamine rushes like a gambling win does.
What's starts as initial excitement will move to fear, anxiety, stress and excitement again. 🤷🏻♂️
You become irrational and unable to stick to your plan.🤯
Entering trades through boredom for the 'rush' and closing profitable trades too early because of fear of the profit disappearing - all because you risked too much for that 'buzz'.
'So what can I do about it?' I hear you shout loudly....📢
Well this depends on if you really want to change or not, the downside is you'll think you will make less money ....
Think about it - you have a £5000 account right?
Option 1 - you trade 15 pairs at 0.5 lot size and your account is up and down like a yo yo - but it's exciting right?
Option 2 - you trade 3 pairs at 0.01 - your account movement is marginal.
Option 2 is less exciting for sure, but if you want excitement go and jump out of plane.
Option 1 will eventually lead to a blown account.
Option 2 will give you sustainable consistent trading - you'll let your winners run and you'll lose less on the losing trades. A win win.
Only when you get this bit right will you start to see positive change.
Emotional control is key
Be present doing other things without checking your phone to see how trades are going.
Exercise patience by sticking to your plan and letting your trades run instead of closing them early.
The only thing you can control in trading is YOU
Just don't end up letting the dopamine take control!
Have a good weekend everyone and thanks for looking
Darren👍
