Mastering the Bollinger Bands- How to use it in trading?What is the Bollinger Bands
Bollinger Bands is a popular technical analysis tool developed by John Bollinger in the 1980s. It is designed to measure market volatility and provide signals for potential price reversals or trend continuations. The Bollinger Bands consist of three lines: a simple moving average in the middle, usually calculated over 20 periods, and two outer bands that are placed a set number of standard deviations above and below the moving average. These outer bands automatically adjust to market conditions, expanding and contracting based on price volatility. The indicator is widely used by traders to understand the relative highs and lows of a financial instrument in relation to recent price action.
What will be discussed?
- How does it work with the lower band and upper band?
- What does the narrowing mean?
- What does the widening mean?
- How to trade with the Bollingers Bands?
-------------------------
How does it work with the lower band and upper band?
The upper band and the lower band serve as dynamic levels of resistance and support. When the price of an asset touches or exceeds the upper band, it may be considered overbought, suggesting that a reversal or pullback could be near. Conversely, when the price approaches or breaks below the lower band, the asset may be viewed as oversold, indicating a potential rebound. These bands do not generate definitive buy or sell signals on their own but instead help traders assess market conditions. The interaction of price with the upper and lower bands often provides visual cues about the momentum and direction of the market, allowing for more informed decision-making.
-------------------------
What does the narrowing mean?
The narrowing of the Bollinger Bands occurs when the price becomes less volatile over time. This contraction indicates a period of consolidation or low market activity, where the price is trading in a tighter range. Narrowing bands are often interpreted as a signal that a significant price movement may be coming soon, as low volatility tends to precede high volatility. This phase is sometimes referred to as the "squeeze," and traders closely monitor it to anticipate breakout opportunities. The direction of the breakout, whether upward or downward, is not predicted by the narrowing itself but usually follows shortly after the bands have contracted.
-------------------------
What does the widening mean?
The widening of the Bollinger Bands reflects increasing market volatility. When the price starts to move rapidly either up or down, the bands spread further apart to accommodate this movement. This expansion typically confirms that a new trend is underway or that a breakout has occurred. The wider the bands become, the greater the degree of price fluctuation. During these times, traders may observe stronger momentum in the market, and the continuation of the move may be supported by the growing distance between the bands. However, extremely wide bands may also suggest that a reversal could be nearing, as the market can become overstretched in either direction.
-------------------------
How to trade with the Bollinger Bands?
Trading with Bollinger Bands involves using the bands to identify entry and exit points based on the behavior of price in relation to the upper and lower bands. One common approach is to buy when the price touches or breaks below the lower band and shows signs of bouncing back, and to sell when the price reaches or moves above the upper band and begins to retreat. Another strategy involves waiting for the bands to narrow significantly and then entering a trade in the direction of the breakout that follows. Traders often use Bollinger Bands in combination with other indicators such as RSI, MACD, or volume to confirm signals and reduce the risk of false breakouts. It is important to remember that Bollinger Bands are not predictive on their own but are most effective when used as part of a broader technical analysis framework.
-------------------------
Disclosure: I am part of Trade Nation's Influencer program and receive a monthly fee for using their TradingView charts in my analysis.
Thanks for your support.
- Make sure to follow me so you don't miss out on the next analysis!
- Drop a like and leave a comment!
SMC

How to Trade Liquidity Sweep in Forex Market (SMC Trading)
I will show you a real example of trading liquidity sweep with Smart Money Concepts.
You will learn the essential SMC liquidity basics, a simple and profitable strategy to identify and trade liquidity sweep.
I will share with you an accurate entry confirmation signal that works perfectly on any Forex pair.
Liquidity Basics
In order to trade liquidity sweeps profitably, you should learn to identify significant liquidity zones.
To spot them, analyze a historic price action and find clusters of important historic key levels.
Examine a price action on EURUSD on an hourly time frame.
I underlined multiple horizontal key levels.
The price respected each level, found support on them, and rebounded.
What is so specific about these levels is that they are lying close to each other, composing a liquidity cluster.
That fact that EURUSD strongly bounced from these levels suggests that buying interest and high buying volumes were concentrated around them.
We can unite these levels and treat them as a single demand zone that has just been broken and turned into a supply zone.
After we found a valid liquidity zone, we can look for a liquidity sweep.
First, we should let the price approach that area and look for a specific price behavior then.
That is a perfect example of a liquidity sweep.
You can see that the price formed a wide range candle with a long tail.
Its high went way beyond the underlined area, but its body closed within.
In order to understand, why a liquidity sweep occurred, let's zoom in our chart and try to understand a behavior of the market participants.
Our supply zone concentrated selling orders , we assume that sellers were placing their orders across its entire length.
Their stop losses were presumably lying above that area.
Smart Money know that and with a liquidity sweep they manipulate the market, making sellers close their positions in a loss (buying back their positions from the market) and providing a liquidity for big players.
After a formation of a such a candlestick, a reliable confirmation of a saturation of the Smart Money is a formation of a strong bearish candle - a clear sign of strength of the sellers.
A bearish engulfing candle above confirmed a completion of a liquidity sweep and indicates a highly probable bearish continuation.
Your perfect sell entry is immediately after a close of such a candlestick.
Stop loss should strictly lie above the high of a liquidity sweep.
Take profit is based on a local low.
Look, how quickly the price reached the goal.
Your strategy of trading liquidity sweeps of demand zones is absolutely the same.
Let the price test a demand zone, wait for a formation of wide range bearish candle with a tail going below its lows.
Wait for a bullish imbalance candle and buy immediately then.
Stop loss will be below the low of a liquidity sweep, take profit - a local high.
This SMC strategy works on any time frame and can be applied for trading any Forex pair, Gold, Silver, Crypto and commodities.
Try it by your own and let me know your results.
❤️Please, support my work with like, thank you!❤️
I am part of Trade Nation's Influencer program and receive a monthly fee for using their TradingView charts in my analysis.

Internal and external liquidity Here's another mechanical lesson for you.
In my last post I covered a mechanical technique to identify swing ranges. Rule-based, simple and repeatable.
In this post, I want to share another little technique, again part of the mechanical series. But this time I want to talk about liquidity.
Most traders talk about liquidity, they might even have a grasp of what it is. But most do not know how liquidity forms the sentiment and how that creates a type of algo for the market.
You might have heard of Elliott wave theory. There is a saying along the lines of "you ask 10 Elliott traders for their count and you get 11 answers".
But the point is here, when you simplify the concept, it's clear to see that sentiment caused by liquidity swings is what causes a repeatable pattern in the market.
Let's take the idea of the ranges from my last post.
Now after a fair amount of accumulation, this level becomes "defended" - the price will gradually move up until old short stop losses are tagged and new long entries are entered into.
This allows the institutional players to open up their orders without setting off the alarm bells.
Price then comes back from external liquidity to find internal liquidity (more on this in a later post).
But then it looks for the next fresh highs.
As the highs are put in, we can use the range technique to move our range to the new area as seen in the image above.
Next we will be looking for an internal move, not just internal to the range, but a fractal move on the smaller timeframe that drives the pullback down. See this in blue.
The logic here is simple; on the smaller timeframes we have witnessed an accumulation at the 2 region and as we spike up for 3; we will witness a distribution on the smaller timeframes.
Wyckoff called this the accumulation, followed by a mark-up and then the distribution and a mark-down.
It is this pattern, over and over again that leads to this type of structure.
This will then be re-branded by various analysts who will call it things like a head and shoulders, smart money will see a change of character and a retest before breaking the structure.
This is all the same thing - just a different naming convention.
Again, I hope this helps some of you out there!
Disclaimer
This idea does not constitute as financial advice. It is for educational purposes only, our principal trader has over 25 years' experience in stocks, ETF's, and Forex. Hence each trade setup might have different hold times, entry or exit conditions, and will vary from the post/idea shared here. You can use the information from this post to make your own trading plan for the instrument discussed. Trading carries a risk; a high percentage of retail traders lose money. Please keep this in mind when entering any trade. Stay safe.

SMC Trading Basics. Change of Character - CHoCH (GOLD FOREX)
In the today's post, we will discuss one of the most crucial concepts in SMC - Change of Character.
Change of Character relates to market trend analysis.
In order to understand its meaning properly, first, we will discuss how Smart Money traders execute trend analysis.
🔘Smart Money Traders apply price action for the identification of the direction of the market.
They believe that the trend is bullish ,
if the price forms at least 2 bullish impulse with 2 consequent higher highs and a higher low between them.
The market trend is considered to be bearish ,
if the market forms at least 2 bearish impulses with 2 consequent lower lows and a lower high between them.
Here is how the trend analysis looks in practice.
One perceives the price action as the set of impulse and retracement legs.
According to the rules described above, USDCAD is trading in a bullish trend because the pair set 2 higher lows and 2 higher highs.
🔘Of course, trends do not last forever.
A skill of the identification of the market reversal is a key to substantial profits in trading.
Change of Character will help you quite accurately identify a bullish and bearish trend violation.
📉In a bearish trend, the main focus is the level of the last lower high.
While the market is trading below or on that, the trend remains bearish .
However, its bullish violation is a very important bullish signal,
it is called a Change of Character, and it signifies a confirmed violation of a bearish trend.
In a bearish trend, CHoCH is a very powerful bullish pattern.
Take a look, how accurate CHoCH indicated the trend reversal on Gold.
After a massive selloff, a bullish breakout of the level of the last lower high confirmed the initiation of a strong bullish wave.
📈In a bullish trend, the main point of interest is the level of the last higher low. While the price is trading above that or on that, the trend remains bullish.
A bearish violation of the last higher low level signifies the violation of a current bullish trend. It is called a Change of Character, and it is a very accurate bearish pattern.
Take a look at the example on Dollar Index below.
In a bullish trend, bearish violation of the last higher low level
quite accurately predicted a coming bearish reversal.
Change of Character is one of the simplest , yet accurate SMC patterns that you should know.
First, learn to properly execute the price action analysis and identify HH, HL, LL, LH and then CHoCH will be your main tool for the identification of the trend reversal.
❤️Please, support my work with like, thank you!❤️
I am part of Trade Nation's Influencer program and receive a monthly fee for using their TradingView charts in my analysis.

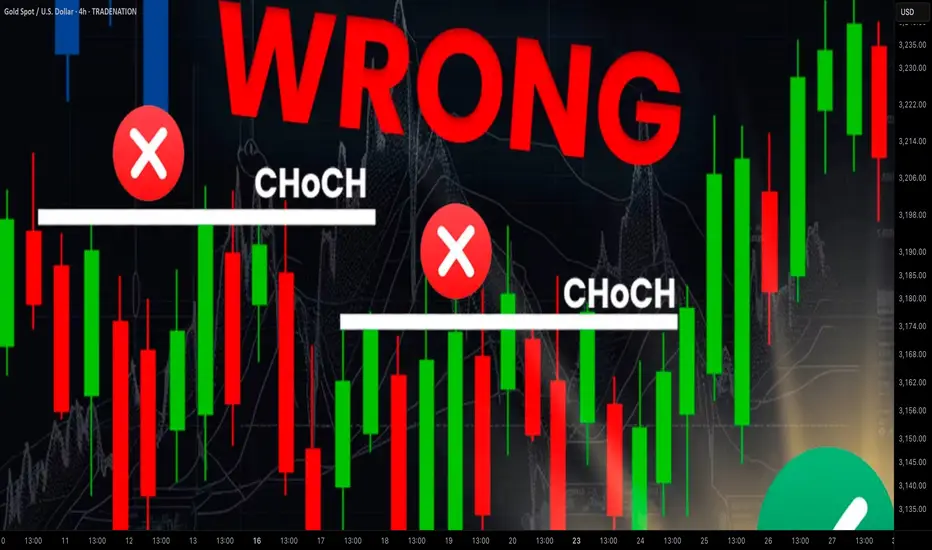
Learn Best Change of Character CHoCH Model in Trading with SMC
Most of the SMC traders get Change of Character CHoCH WRONG!
In this article, I will share with you Change of Character models that have a low accuracy and better to be avoided.
I will teach you the best CHoCH model for Forex Gold trading and show you how to identify it easily.
Let's start with the basic theory first and discuss what Change of Character signifies.
Change of Character in Bearish Trend
In a downtrend, Change of Character CHoCH is an important event that signifies a violation of a bearish trend.
CHoCH is confirmed when the price breaks and closes above the level of the last lower high.
Above, is a text book Change of Character model in a bearish trend.
For the newbie traders, such a price action provides a strong signal to buy while it fact it is NOT .
One crucial thing is missing in this model to confirm a bullish reversal.
According to basic trend analysis rules, we say that the market trend is bullish if the price forms a bullish impulse, retraces and sets a Higher Low HH , forms a new bullish impulse with a new Higher High HH.
Only then, we can say that the market is trading in up trend.
CHoCH model above confirms a bearish trend violation BUT it does not confirm a trend change.
Such a model may easily signify a deeper correction.
Look what happened with GBPNZD.
Though the price formed a confirmed bearish CHoCH, it was a false signal and just an extended correction.
That's a perfect bullish reversal model.
It combines CHoCH and conditions for a bullish trend.
Such a union is extremely accurate in predicting up movements.
Examine a price action on USDJPY.
Not only the price formed a confirmed CHoCH but also we see a start of a new bullish trend.
Change of Character in Bullish Trend
In an uptrend, Change of Character CHoCH is a significant event that signifies a violation of a bullish trend.
CHoCH is confirmed when the price breaks and closes below the level of the last higher low.
Above is a typical model of a bearish CHoCH.
For many traders, that is the signal to open short.
However, it is not that accurate and one important component is missing there.
According to basic price action rules, the market trend is bearish
if the price forms at least 2 bearish impulses with Lower Lows LL and a pullback between them with a Lower High LH.
Only when these 3 conditions are met, a bearish trend is confirmed .
Perfect bearish Change of Character model should include both CHoCH and a bearish trend price action. That will confirm a violation of a bullish trend and start of a new bearish trend.
EURCAD has a very strong potential to continue falling:
not only we see a valid bearish Change of Character but also
a start of a new bearish trend based on a price action.
Next time when you identify CHoCH on forex market, make sure that you check the preceding price action. It will help you to more accurate assess reversal probabilities and make a wiser trading decision.
❤️Please, support my work with like, thank you!❤️
I am part of Trade Nation's Influencer program and receive a monthly fee for using their TradingView charts in my analysis.
Mechanical rangesMany traders will talk about things like "Smart Money Concepts" (SMC) and think they have found something new.
The truth is, everything in trading stems back to Liquidity.
There is no "Algo" nobody is out to get you specifically. The market is always right, where you position yourself is your own choice.
I have written several posts on mechanical trading, recorded a number of streams. The more mechanical you can make the process, the less the emotions have a chance to kick your ass.
Let me give you a very simple method of being able to identify the ranges. Ignore the timeframes as this will work on any of them, on most instruments. (I say most, as some behave differently due to how it attracts liquidity). Lets assume high end crypto such as Bitcoin (BTC) and of course Forex in the general sense, stocks, commodities etc.
This is simple - only 2 rules.
You start by zooming out and giving yourself a general feel for the trend.
Let's say this looks to be an uptrend - we now need to understand the rules.
An opposing candle can simply be defined by a different colour. If the trend is up (Green) and we see a red candle - then it's an opposing candle.
The inverse is true, if we are down and the trend is Red. Then a Green candle would be opposing.
This is only half of the story. The second rule is a pullback candle or even a sequence of candles. This simply means either the very same opposing candle that doesn't make a new high or low (depending on the trend up not making fresh highs or down not taking new lows).
In this image, you can see we have in one candle both an opposing and pullback in one candle. This means we can now mark the high of the range. Working backwards to identify the swing range low.
This easy method means I can draw a range exactly the same and mechanically every single time.
Giving me a mechanical range.
We could then get a lot more technical by looking for liquidity, 50% of the range or places such as supply or demand areas.
But these are all for other posts.
For now, getting a range on the higher timeframes means you can work down and down into a timeframe you are likely to want to trade on.
These ranges will give clues to draws and runs of liquidity.
This will also help identify changes in the character and fresh breaks of structure.
Here's another post I posted on the mechanical structures and techniques.
More in the next post.
Have a great week!
Disclaimer
This idea does not constitute as financial advice. It is for educational purposes only, our principal trader has over 25 years' experience in stocks, ETF's, and Forex. Hence each trade setup might have different hold times, entry or exit conditions, and will vary from the post/idea shared here. You can use the information from this post to make your own trading plan for the instrument discussed. Trading carries a risk; a high percentage of retail traders lose money. Please keep this in mind when entering any trade. Stay safe.

Building Liquidity: What It Really Means🔵 Building Liquidity: What it really means
Professional traders often need liquidity (buyers and sellers) to enter/exit large positions without moving the market too much.
This means manipulating the market within a pre-determined range, which serves as the operating center for everything that follows.
🔹 How is liquidity built
Price Ranging: Sideways consolidation before big moves attracts both buyers and sellers.
False Breakouts (Stop hunts): Price may briefly break support/resistance to trigger retail stop-losses and fill institutional orders.
News Timing: Pro traders often execute during or just before major news when volatility brings liquidity.
🔹 How can you spot a Liquidity-building zone
🔸 Volume
Unusual spikes in volume: Often indicate institutional activity.
Volume clusters at ranges or breakouts: Suggest accumulation/distribution zones.
Volume with price divergence: Price rises but volume falls = possible exhaustion. Volume rises and price consolidates = potential accumulation.
🔸 Price Action
Order Blocks / Imbalance zones: Sharp moves followed by consolidations are often pro trader footprints.
Break of Structure (BoS): Institutions often reverse trends by breaking previous highs/lows.
Liquidity sweeps: Price moves aggressively above resistance or below support then reverses = stop-loss hunting.
🔸 News Reaction
Watch pre-news volume spikes.
Look for contrarian moves after news — when price moves opposite to expected direction, it often reveals smart money traps.
Analyze price stability post-news — slow movement shows absorption by pros.
Wick traps and reversals around news events = stop hunting.
🔸 Narrative is Everything
Higher timeframe trends show intent.
Lower timeframes show execution zones.
Look for alignment between timeframes in a specific direction.
🔹 Why do whales move the market in an orderly manner
To fill large positions at optimal prices.
To create liquidity where there is none.
To trap retail on the wrong side of the move.
To trap other whales on the wrong side of this move.
To rebalance portfolios around economic cycles/news.
🔹 Professionals never forget what they've built
When you track price, volume, and news, you’ll find specific bars that form areas that are the foundation for the short-term direction.
This is pure VPA/VSA logic, the interplay of Price Analysis ,Volume Analysis and News, where each bar is not just a bar , but a clue in the story that professionals are writing.
When you monitor volume, price, and news together and perform multi-timeframe analysis, it becomes clear what the whales are doing, and why.
🔹 From the chart above
The market reached a weekly resistance level and then pulled back slightly after whales triggered the stop-losses of breakout traders.
Prior to the breakout, whales had accumulated positions by creating a series of liquidity-rich buying zones on the daily timeframe.
It's essential to understand the broader context before choosing to participate alongside them—whether you're planning to buy or sell.
🔴 Tips
Use volume and price analysis together, not separately.
Monitor any unusual volume bars before economic market news.
Monitor news and volatility spikes to detect traps and entries.
Combine this with liquidity zones (support/resistance clusters).
Build a "narrative" per week: What is smart money trying to do?
A smart trader understands the tactics whales use, and knows how to navigate around them.

Mastering the ICT Power of 3 concept - How to use it in trading!The financial markets often appear chaotic and unpredictable, but behind the scenes, institutional players operate with clear strategies that shape price action. One such strategy is the ICT (Inner Circle Trader) "Power of 3" model, a framework used to understand and anticipate market cycles through three key phases: accumulation, manipulation, and distribution. This guide will break down each of these phases in detail, explaining how smart money operates and how retail traders can align themselves with the true direction of the market.
What will be discussed?
- The 3 phases
- Examples of the PO3
- How to trade the PO3
- Tips for trading the PO3
The 3 phases
Accumulation
The Accumulation Phase in the ICT "Power of 3" model refers to the initial stage of a market cycle where institutional or "smart money" participants quietly build their positions. During this time, price typically moves sideways within a tight range, often showing little to no clear direction. This is intentional. The market appears quiet or indecisive, which is designed to confuse retail traders and keep them out of alignment with the real intentions of the market's larger players.
In this phase, smart money is not looking to move the market dramatically. Instead, they are focused on accumulating long or short positions without drawing attention. They do this by keeping price contained within a consolidation zone. The idea is to gather enough liquidity, often from unsuspecting retail traders entering early breakout trades or trying to trade the range, before making a more aggressive move.
Manipulation
The Manipulation Phase in the ICT "Power of 3" model is the second stage that follows accumulation. This phase is where smart money deliberately moves the market in the opposite direction of their intended move to trigger retail stop losses, induce emotional decisions, and create liquidity.
After price has consolidated during accumulation, many retail traders are either already positioned or have orders waiting just outside the range, either stop losses from those trading the range or breakout orders from those anticipating a directional move. The manipulation phase exploits this positioning. Price will often break out of the accumulation range in one direction, appearing to confirm a new trend. This move is designed to look convincing, it might even come with a spike in volume or momentum to draw traders in.
However, this breakout is a false move. It doesn’t represent the true intention of smart money. Instead, it's meant to sweep liquidity, triggering stop losses above or below the range, and then reverse sharply. This stop run provides the liquidity needed for large players to finalize their positions at optimal prices. Once enough liquidity is collected, and retail traders are caught offside, the real move begins.
Distribution
The Distribution Phase in the ICT "Power of 3" model is the final stage of the cycle, following accumulation and manipulation. This is where the true intention of smart money is revealed, and the market makes a sustained, directional move, either bullish or bearish. Unlike the earlier phases, distribution is marked by clear price expansion, increased volatility, and decisive momentum.
After smart money has accumulated positions and shaken out retail traders through manipulation, they have the liquidity and positioning needed to drive the market in their desired direction. The distribution phase is where these positions are "distributed" into the broader market, meaning, institutions begin to offload their positions into the retail flow that is now chasing the move. Retail traders, seeing the strong trend, often jump in late, providing the liquidity for smart money to exit profitably.
This phase is typically what retail traders perceive as the real trend, and in a sense, it is. However, by the time the trend is obvious, smart money has already entered during accumulation and profited from the manipulation. What appears to be a breakout or trend continuation to most retail participants is actually the final leg of the smart money’s strategy. They are now unloading their positions while price continues to expand.
Examples of the Power of 3
How to trade the PO3?
Start by identifying a clear accumulation range. This typically happens during the Asian session or the early part of the London session. Price moves sideways, forming a consolidation zone. Your job here isn’t to trade, but to observe. Draw horizontal lines marking the high and low of the range. These become your key liquidity zones.
Next, anticipate the manipulation phase, which usually occurs during the London session or at the NY open. Price will often break out of the range, triggering stop losses above the high or below the low of the accumulation zone. This move is deceptive, it is not the real trend. Do not chase it. Instead, wait for signs of rejection, such as a sharp reversal after the liquidity grab, imbalance filling, or a shift in market structure on a lower timeframe (like a 1- or 5-minute chart).
Once manipulation has swept liquidity and price starts showing signs of reversing back inside the range or beyond, you now look for a confirmation of the true move, this begins the distribution phase. You enter in the direction opposite of the manipulation move, ideally once price breaks a structure level confirming that smart money has taken control.
For example, if price consolidates overnight, fakes a move to the downside (running sell stops), and then quickly reverses and breaks above a key swing high, that's your signal that the true move is likely up. Enter after the break and retest of structure, using a tight stop loss below the recent low. Your target should be based on liquidity pools, fair value gaps, or higher-timeframe imbalances.
The key to trading the Power of 3 is patience and precision. You're not trying to catch every move, but to wait for the market to complete its cycle of deception and then ride the clean expansion. Ideally, your entry comes just after manipulation, and you hold through the distribution/expansion phase, taking partials at key liquidity levels along the way.
Tips for trading the PO3
1. Learn price movements
Before you can effectively apply the ICT Power of 3 strategy, it’s crucial to have a deep understanding of how price behaves. This means being comfortable identifying market structure, recognizing trend direction, and interpreting candlestick dynamics. Since the Power of 3 is deeply rooted in how price moves in real time, a strong grasp of these basics will give you the confidence to read the market correctly as each phase develops.
2. Analyse multiple timeframes
Although the Power of 3 pattern shows up on lower timeframes, relying on just one can lead to misreads. You’ll gain a clearer picture when you align the short-term view with higher timeframe structure. For example, what appears to be accumulation on the 15-minute chart may simply be a retracement in a larger trend on the 1-hour or daily. By examining multiple timeframes together, you can better identify the true setup and avoid being tricked by noise.
3. Exercise patience
A key part of trading the Power of 3 is knowing when to act, and more importantly, when not to. It’s easy to get impatient during the accumulation or manipulation phases, but entering too early often leads to frustration or losses. True discipline comes from waiting for the expansion or distribution phase, when the market reveals its real direction. This is where the most favorable risk-to-reward setups occur.
Thanks for your support.
- Make sure to follow me so you don't miss out on the next analysis!
- Drop a like and leave a comment!

How to Master Premium & Discount For Better EntriesA lot of traders talk about premium and discount, but very few actually know how to use it properly. Most just draw Fibonacci tools on random legs and try to catch reactions at the 61.8% level. That kind of trading lacks structure and context. If you're serious about using Smart Money Concepts the right way, then you need to understand where value exists in the market and how to position yourself accordingly.
This guide is all about mastering the premium vs discount model using a 4H bias, entries on the 1H or 15M, and refinements based solely on Fair Value Gaps. No order blocks. No guessing. Just clean structure, displacement, and a focus on institutional logic.
Establishing a Valid 4H Dealing Range
Your entire analysis starts with the 4H chart. That’s where you define the dealing range, the leg of price that caused a significant shift in market structure, usually confirmed by displacement and a break of a previous swing.
To do this correctly:
Identify a 4H swing high to swing low (or low to high) that broke structure and created an imbalance.
Anchor your range from that swing point to the extreme, this becomes your dealing range.
Mark the 50% of this range — this is your equilibrium line.
Everything above this midpoint is premium, everything below is discount.
You’re not drawing fibs for retracement levels. You’re using them to separate cheap price from expensive price.
Premium vs Discount: Why It Matters
The logic is simple: institutions buy at discount and sell at premium. They don’t place large positions in the middle of the range, they accumulate when price is cheap and distribute when price is expensive.
Once you’ve marked out your 4H range, you now have a framework:
Price in discount (below the 50%) = potential buy setups.
Price in premium (above the 50%) = potential sell setups.
The key is to only look for trades in the right part of the range. If price is in premium and you're trying to long, you're working against smart money. If it's in discount and you're trying to short, you're fading accumulation.
Refining the Setup on 1H or 15M
Once price enters the zone you’re interested in, premium or discount. Drop to the 1H or 15M charts to look for entries.
But we’re not trading any structure or supply/demand zone. We’re only interested in Fair Value Gaps. Why? Because FVGs are the cleanest way to spot imbalance — they show where price moved too aggressively and left inefficiency behind.
Here's what to do:
Watch for displacement on 1H or 15M once price taps into the 4H premium or discount zone.
The move should break short-term structure and leave a clear FVG.
Wait for price to retrace into that FVG.
Entry is placed inside the gap, preferably in the upper or lower third depending on direction.
Your invalidation is the low or high of the displacement move.
The FVG gives you a clean risk-to-reward setup that is backed by structure, context, and smart money intent.
Example: Long from Discount
Let’s say price is trading inside the discount zone of a 4H bullish dealing range. You now drop to 15M and see a sharp move higher that breaks structure and creates a clean 15M FVG.
Now you wait.
If price retraces into that gap and shows some form of reaction (volume, reaction wick, or small lower timeframe shift), you have a valid long. The trade is high probability because:
It’s inside 4H discount
The 15M displacement confirms smart money is stepping in
The FVG is your refined entry zone
Target is always the next liquidity pool inside premium.
Example: Short from Premium
Opposite logic applies.
If price trades into the premium zone of a 4H bearish range, you drop to 1H or 15M and wait for displacement to the downside. When you get a strong bearish move that leaves behind a Fair Value Gap and breaks intraday structure, you mark the FVG.
When price retraces into it, you execute your short. Stop is above the displacement high. Target is the first liquidity level inside discount, such as an old low or a clean equal low.
Rules for FVG Entries (1H/15M)
To keep your execution sharp, stick to these:
Only enter FVGs that form from displacement moves.
The FVG must break intraday structure.
It must form inside the 4H premium or discount zone, no exceptions.
Avoid FVGs that form in the middle of the range or during chop.
Make sure higher timeframe context supports the direction.
This filters out 90% of weak setups and forces you to trade in sync with value.
Targets and Exits
Where you enter is based on imbalance and structure, but where you exit is based on liquidity and the premium/discount model in reverse.
If you long from discount, you should be targeting premium levels.
If you short from premium, you should be targeting discount levels.
More specifically:
Look for old highs/lows
Clean equal highs/lows
Unfilled FVGs in the opposite zone
This way, you’re always exiting into areas where the market is likely to reverse or stall, and not overstaying your trade.
Conclusion
Trading from premium or discount zones isn’t just a concept, it’s a framework that puts you in line with institutional activity. When you combine it with FVGs, you have a clean, mechanical way to structure your trades.
Keep your bias on the 4H. Mark your ranges clearly. Drop to 1H or 15M only when price is in a valid zone, and only take entries on FVGs that form from strong displacement. If you stay disciplined with this model, you’ll avoid chasing price and start trading from areas of true value.
___________________________________
Thanks for your support!
If you found this guide helpful or learned something new, drop a like 👍 and leave a comment, I’d love to hear your thoughts! 🚀
Make sure to follow me for more price action insights, free indicators, and trading strategies. Let’s grow and trade smarter together! 📈

BTCUSDT 13R Trade Breakdown: Deep Crab Pattern + SMC Precision Hello Traders!
If you enjoyed my previous post on combining Harmonic Patterns with Smart Money Concepts (SMC) for high-precision, high-risk-to-reward trades, then you're going to love this breakdown on BTCUSDT.
If you haven’t checked out my earlier content, make sure to scroll below this post and see that first—it sets the foundation for what we’re diving into here.
📈 BTCUSDT Trade Breakdown: Harmonic x SMC Precision Entry
This analysis was originally shared around three weeks ago on my YouTube channel, and if you were with me live, you’ll remember I was closely watching for a Bullish Deep Crab Pattern to complete before considering a LONG position.
Let’s walk through the setup and outcome step-by-step:
🕰 WEEKLY TIMEFRAME:
Price was reacting to a Weekly Fair Value Gap (FVG) and had filled the imbalance.
As shown in the chart:
🔍 SETUP: Strategy Confirmation
Important Reminder:
Just because price hits a key level doesn’t mean we jump in to buy or sell.
✅ There must be a confirmed Harmonic Pattern that aligns with the key SMC level.
On the Daily Chart, we identified a valid Bullish Deep Crab Pattern:
B-point at 0.886
PRZ (Potential Reversal Zone) at 1.618 FIB Extension
This PRZ aligned perfectly with the key level identified on the Weekly chart.
🎯 ENTRY STRATEGY (15-Minute Chart):
We zoomed into the 15M chart for an SMC-based entry.
Supply-to-demand flip confirmed with a visible liquidity inducement—textbook confirmation.
Entry was just a few pips below the recent swing low to limit downside risk in case of invalidation.
Take Profits (TPs) were set using standard Deep Crab targets, based on FIB retracements from A to D:
✅ TP1 at 0.382
✅ TP2 at 0.618
✅ TP3 at 0.786
✅ TRADE OUTCOME:
Entry was cleanly triggered and the price followed through as expected.
All three profit levels were successfully hit:
✅ TP1
✅ TP2
✅ TP3
We secured an impressive 13R on this single BTCUSDT trade —a solid example of what happens when Harmonics and Smart Money Concepts are aligned.
💬 Your Turn:
Did you take this BTC trade using a different strategy?
Or did you spot the pattern and enter alongside me?
Drop your thoughts and experiences below this analysis—let’s learn together!

Simple Break of Structure BoS Trading Strategy Explained
One of the best and reliable strategies to trade break of structure BoS is to apply multiple time frame analysis.
In this article, I will teach you my break of structure gold forex trading strategy. You will get a complete step-by-step guide with examples.
Let's start with a quick theory and let me explain to you what is break of structure BoS in Smart Money Concept SMC trading.
In a bullish trend, break of structure BoS is an important event that signifies a continuation of an uptrend. It is based on a violation and a candle close above the level of the last higher high (HH).
After a breakout, the broken level becomes the first strong support for trend-following buying.
Check multiple examples of confirmed breaks of structure BoS on GBPNZD forex pair on a weekly time frame.
In a downtrend, Break of Structure BoS means a bearish trend continuation . Break of Structure is considered to be confirmed when a candle closes below the level of the last lower low (LL).
The broken key level becomes the closest strong support for buying.
That's the example of a healthy downtrend on USDJPY forex pair on a daily. Each break of structure BoS pushed the prices lower, providing a strong signal to sell.
What newbie traders do incorrectly, they trade break of structure without a confirmation strategy, and it leads to substantial losses.
Though GBPCHF is trading in a bullish trend and though each BoS provided a trend-following signal. The price retraced significantly lower below the broken structure before the growth resumed.
When the price retests a broken structure after BoS in a bullish trend, start lower time frame analysis.
If you identified a break of structure on a daily, analyze 4h/1h time frames.
If on a 4H, then 30/15 minutes.
After the price sets a new higher high with BoS in uptrend, it usually starts trading in a minor bearish trend on lower time frames.
With our strategy, your signal to buy will be a retest of a broken structure and a consequent bullish Change of Character CHoCH . That will provide an accurate bullish signal.
In a bearish trend, analyze the lower time frames after a retest of a broken structure. Your signal to sell will be a bearish Change of Character CHoCH.
Look at a price action on EURCHF on a daily.
We see a strong bullish trend and a confirmed Break of Structure BoS.
According to the rules of our trading strategy, we start analyzing 4h/1h time frames after a retest of a broken level of the last Higher High.
Our signal to buy is an intraday bullish CHoCH. We open a long trade after that with the stop loss below the intraday lows and take profit being a current high.
That's how simple this strategy is.
Multiple time frame analysis provides the extra level of security.
Strong lower time frame confirmation substantially increases the win ratio of a trading setup.
❤️Please, support my work with like, thank you!❤️
I am part of Trade Nation's Influencer program and receive a monthly fee for using their TradingView charts in my analysis.

Ultimate Guide to Master CISDCISD stands for Consolidation, Inducement, Stop Hunt, Displacement. It’s a simple, repeatable structure that shows how smart money sets up traps in the market to grab liquidity and then make a clean move in the opposite direction.
If you’re serious about trading the ICT style, this is one of the most useful frameworks to learn. It helps you avoid chasing bad breakouts and teaches you to wait for real setups that come after stop hunts and proper market structure shifts.
But there’s one rule that’s non-negotiable — a CISD setup is only valid after a liquidity sweep. If the market hasn’t taken out a clear high or low where stops are sitting, then the rest of the model doesn’t mean anything. No sweep, no trade.
1. Start With the Liquidity Sweep
Everything begins with the liquidity grab. If price hasn’t taken out a high or low where stops are stacked, you should walk away from the setup. Don’t try to front-run a move before smart money has done its job.
The liquidity sweep is what gives the rest of the move power. That’s when price runs through obvious levels, swing highs, swing lows, the Asian range, New York session highs or lows and hits stop losses. Those stops give smart money fuel to enter in the opposite direction.
When you’re watching the market, ask yourself this:
"Who just got stopped out?"
If you can’t answer that, then it’s not a sweep. And if it’s not a sweep, it’s not a CISD.
2. Consolidation — Where Liquidity Builds
This is the first part of the structure. Price starts to move sideways in a tight range, usually during Asian session or during parts of London where volume is low. It can last for hours or even across sessions.
The key here is to understand what’s happening. Traders are placing buys above the highs and sells below the lows. Liquidity is building on both sides. It’s a trap being set. Retail traders are expecting a breakout, but smart money is waiting to use that breakout to their advantage.
Your job in this phase is to identify the range and mark out the highs and lows. That’s where stops will be sitting. You’re not looking to trade during this phase. You’re watching and planning
3. Inducement (sweep)— Fake Break to Trap Traders
After the range is set, price gives a small push out of the range just enough to get people to commit. This is the inducement. It’s the bait.
Let’s say the range high is being tested. Price breaks just above it, traders think it’s a breakout, and they go long. Maybe it holds for a couple of minutes, even gives a small push in their favor. But then it rolls over. That’s the trap. Now those traders are caught, and their stops are sitting below.
Sometimes the inducement comes before the real sweep. Other times, the inducement is the sweep. What matters is that traders have been lured into bad positions and their stops are exposed.
As a trader, your job is not to take the bait. Watch how price reacts to these fake moves. Often, they come with weak volume or are followed by an immediate sharp reversal.
4. Stop Hunt — The Sweep That Validates the Setup
This is where the real move starts to form. Price aggressively runs through the level that holds liquidity, usually below the low or above the high you marked earlier.
This is when smart money takes out the traders who were induced during the fake move. Their stops get hit, and that gives institutions the volume they need to get into the opposite side.
You should be actively watching for a reaction here. Do you see rejection? Does the candle close with a strong wick? Are there signs of absorption or order flow flipping?
This is your validation point. Once price sweeps liquidity and starts to reject the level, that’s your cue to get ready for the next part, the actual shift.
5. Displacement — The Real Move Begins
Once the sweep happens, price doesn’t just drift, it snaps back hard. This is called displacement.
Displacement is a sharp, clean move in the opposite direction of the stop hunt. This is when market structure breaks, momentum shifts, and a fair value gap usually forms.
This is your confirmation that the setup is live. The sweep happened, smart money entered, and now the market is moving with intent.
You don’t want to chase the displacement candle itself. Instead, wait for the retrace. Look for price to come back into the fair value gap or an order block left behind by the impulse. That’s your entry point.
Make sure:
Structure is broken in your direction
The move away is impulsive, not choppy
You’re not forcing an entry on a weak pullback
This is the only part of CISD where you actually take the trade. Everything else is just setup.
How to Manage Risk and Entries
Once you’ve got a valid setup, here’s how to manage it:
Entry: Enter on the CISD or wait for the pullback into the fair value gap or order block. Enter on the reaction or confirmation.
Stop Loss: Place it just past the low or high that got swept. If you’re long, your stop goes below the stop hunt candle. If you’re short, it goes above.
Take Profit: Target the next liquidity level. That could be the other side of the range, a swing high or low, or an inefficiency in price.
You can scale out if price approaches a session high or low, or hold for a full range expansion depending on the session.
Final Thoughts
The CISD model works because it’s built on how the market actually moves, not indicators, not random patterns, but liquidity.
Don’t jump in early. Don’t guess. Wait for the sweep. Wait for the displacement. That’s where the edge is.
Once you get used to watching this play out in real time, you’ll start to see it everywhere. It’s in Forex, crypto, indices, any market that runs on liquidity.
Stick to the rules. Let the model do its job. And remember: no sweep, no setup!
___________________________________
Thanks for your support!
If you found this guide helpful or learned something new, drop a like 👍 and leave a comment, I’d love to hear your thoughts! 🚀
Make sure to follow me for more price action insights, free indicators, and trading strategies. Let’s grow and trade smarter together! 📈

Ultimate Guide to Master ICT KillzonesWhy Timing Matters Just as Much as Price
Smart Money Concepts (SMC) and ICT methodologies are built on the idea that markets are manipulated by large players with precision. While most traders obsess over price levels, entry models, and liquidity zones, many fail to realize that none of those matter if they happen at the wrong time. Time is not an afterthought, it's a core part of the edge.
Price can show you where the move might happen, but time shows you when smart money is most likely to act. That window of action is what ICT calls the killzone.
What Are Killzones?
Killzones are specific time periods in the trading day when smart money typically executes large moves. These sessions have predictable volatility and institutional order flow. They are not just random hours, they coincide with major session opens and overlaps.
The most relevant killzones are:
London Killzone (LKO), 2 AM to 5 AM EST
New York Killzone (NYKO), 7 AM to 10 AM EST
New York Lunch/Dead Zone, 11:30 AM to 1 PM EST (low probability, often reversal traps)
Each killzone offers unique opportunities depending on how liquidity has been engineered prior. ICT-style setups are most reliable when they form within, or directly in anticipation of, these windows.
The Trap Before the Real Move
Smart money loves to trap retail traders. This trap usually happens just before or early in a killzone. For example, if price takes out a key high at 2:30 AM EST (London open), many retail traders see a breakout. But those in tune with SMC see it as a classic liquidity raid, bait before the reversal.
Once that external liquidity is taken, smart money shows its hand with displacement, a sudden, aggressive move in the opposite direction. This typically forms a clean imbalance (Fair Value Gap) or a breaker block. That’s your cue.
If the price returns to that level within the killzone, that’s the optimal entry window.
Confluence is King: Time, Liquidity, and Structure
The most reliable SMC setups happen when:
Liquidity is swept early into a killzone
Displacement confirms the real direction during the killzone
Entry happens via return to an FVG or OB created within that same session
The setup might still look right if it forms outside these windows, but without proper timing, it’s often just noise or engineered liquidity to trap impatient traders.
Real-World Example: NY Killzone Short
NY, At 8:30 AM EST, price runs above the Asian highs, sweeping liquidity
Displacement, Sharp bearish move breaks structure to the downside at 8:45 AM
Entry, Price retraces into the 5M FVG at 9:10 AM
Result, Clean reversal into a nice profit trageting liquidity, all within the NY session
Outside of this killzone structure, the same setup likely would have chopped or failed.
Common Mistakes Traders Make With Time
Chasing price outside of killzones, Setup might look good, but volume is thin and no follow-through comes
Assuming all killzones are equal, London setups are often cleaner in structure, while NY has more manipulation around news
Forcing trades in NY lunch, Midday reversals do happen, but they’re lower probability. If you're not already in a position by 11 AM EST, it's often best to wait for the next day
The Discipline Edge
Most traders overtrade not because they lack setups, but because they don’t filter based on time. By only trading when price interacts with your levels during active killzones, you immediately reduce the number of bad trades and increase your focus on meaningful opportunities.
Good setups are rare. Good setups in the right timing window are even rarer. That’s where consistency comes from.
Final Thoughts
Time is not optional. In SMC and ICT, it’s not enough to have the level, you need the timing. Killzones are your filter, your edge, and your context for every trade.
Once you understand how time and price move together, and stop treating every moment on the chart equally, your trading will start to reflect the true flow of smart money.
Wait for time, wait for price, then strike.
___________________________________
Thanks for your support!
If you found this guide helpful or learned something new, drop a like 👍 and leave a comment, I’d love to hear your thoughts! 🚀
Make sure to follow me for more price action insights, free indicators, and trading strategies. Let’s grow and trade smarter together! 📈

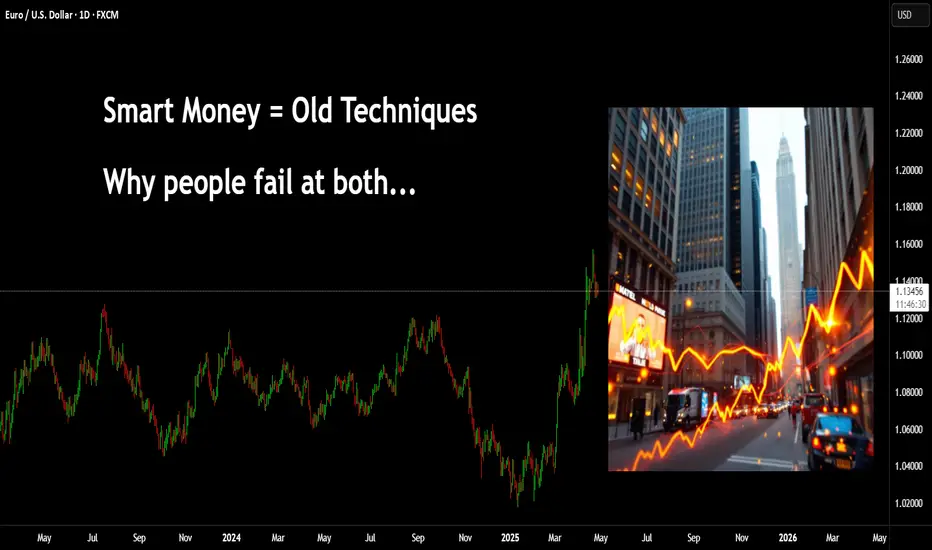
Why does it always go against you? You might be new to trading, you may have several years of experience. But, where a lot of people still seem to go wrong is in not realising the relationships.
I have posted hundreds of educational posts here on Tradingview from cartoons, trying to simplify techniques through to market relationships between technical systems such as Elliott Wave and Wyckoff.
Many new traders fall foul of social media posts covering "SMC - Smart Money Concepts" and are not seasoned enough to appreciate what or why these can work for some and not for others.
You have Elliott Wave traders, there is a saying along the lines of "if you put 10 Elliott traders in a room searching for a wave count you will come out with 11 different answers"
This isn't to say Elliott doesn't work, nor Smart Money.
The market seeks liquidity, it forms seemingly complex patterns that humans try to make sense of. We are great at that, seeing patterns even if they are not there. - Look, there's an upside-down butterfly 1.618 extension!
First, you need to appreciate Elliott Wave counts on smaller timeframe are pointless, especially in the age of algo's and bots. However, sentiment on the larger timeframes can't really be spoofed.
In this first image; you can see a market wave that is straight out of a textbook.
Let's also add some Wyckoff; if you were to visualise this - Wyckoff schematics would be visible on smaller timeframes, the Green boxes represent accumulation and the Red show distribution.
Let's overlay and Elliott Wave count -
Take that to the next level, this count is only part of a higher fractal count.
How does this fit into smart money concepts? well, it's more like - How does Smart Money fit into this?
Elliott waves and Wyckoff have been around for over 100 years. Many of the techniques shown on YT video's today can be traced back to these older concepts.
Now, if you can see how a 1-2 EW count pushes up for a 3. You can zoom in again and start to see what to expect when trading using SMC.
In this image you can see a drop, then a gap as price pushes back up (I haven't bothered drawing wicks for simplicity assume their inside the box)
Many traders would now anticipate a move that looks something like this.
Only to see price do this
Yeah - you're not the only one!
The next issue is where and how Supply and Demand is drawn.
Ok, the gap didn't hold, it must be the demand level there. GO AGAIN!!!
How did that play out? Trade 1, Trade 2 =
What about now?
Price holds the support
This time you are afraid to go in. Then one of two things happens.
1)
Or
2)
In the first image, we can see a sweep of prior liquidity and that creates momentum for a move up. In the second image, price simply melts away.
This is an easy fix. It all comes down to understanding what the charts are trying to tell you.
People love to talk about how "Smart Money" is the banks and institutional players - how they are playing against you on every click of the button.
The truth is, most people don't understand the market.
When larger players enter the market, the can leave a pretty obvious footprint. In addition to that - they leave behind orders they had but were unable to fill. These orders they will be defended with even more buying or selling (if they need to), and this is the premise for a rally and pullback or a drop to pullback.
Now, visualise a 1-2 Elliott Wave move. Why do you think 2 often comes back so deep?
What would you expect the move from 2-3 to do?
Powerful push, yes?
In this image, the move that created demand is simply the opposing colour candle before the power play. The significant move pushed up (showing institutional involvement). Hence, a location they will likely defend.
In addition to the push up, they pushed with so much money - it created a natural gap.
This type of example doesn't always have to be a power play 1-5 up, it could be visualised on pullback moves too.
Here's a great example recently on Euro.
The demand candle 'buy before the sell" is clearly targeted on the way up. Price fails to close above it, drops, goes back to retest - sweeps and drops. If you were to zoom in you will see on smaller timeframes evidence of a Wyckoff schematic with a UTAD.
Add a volume profile there.
As the price breaks above, after it's pullback you can see an acceleration in price and of course the area has the PoC.
Back to where people go wrong.
They will see this GAP created and assume price will come back here to reject and go. However, look closer and the demand that started the move is very near that gap.
Where is the juicy liquidity? PoC is another little clue.
Let's take this to another level.
In this image I have a range, using the prior high just to give the example in this post.
We are in an uptrend = we just broke the high, we expect a Pullback. Where would that likely target?
Zoom in again. This time I have added a fixed range volume tool.
What do you know?!
Anyways, once you get a handle on the bigger picture and understand the relationships, you can zoom into any timeframe you like - the game is always the same.
Have a great week all!
Disclaimer
This idea does not constitute as financial advice. It is for educational purposes only, our principal trader has over 25 years' experience in stocks, ETF's, and Forex. Hence each trade setup might have different hold times, entry or exit conditions, and will vary from the post/idea shared here. You can use the information from this post to make your own trading plan for the instrument discussed. Trading carries a risk; a high percentage of retail traders lose money. Please keep this in mind when entering any trade. Stay safe.
Ultimate Guide to Liquidity Sweeps: Trading Smart Money MovesIn the world of Crypto and other financial markets, liquidity sweeps are deliberate price moves designed to capture liquidity sitting above or below key price levels. These moves are not random, they are orchestrated by large players who need to fill significant orders efficiently. By pushing price into zones where stop-losses and pending orders accumulate, these entities access the liquidity required to open large positions without causing excessive slippage.
Liquidity sweeps offer sharp insights into market structure and intent. Understanding how they work and recognizing them in real-time can significantly enhance a trader’s edge, especially in environments dominated by algorithmic and smart money behavior.
Defining the Liquidity Sweep
A liquidity sweep is characterized by a quick push through a well-defined support or resistance level, typically a recent high or low, followed by a swift reversal. These zones are hotspots for stop orders placed by retail traders, such as long stop-losses placed under swing lows or short stops above recent highs. When these stops are triggered, they act as liquidity pools.
Large players anticipate these zones and use them to enter positions. The sweep creates an illusion of breakout or breakdown, luring reactive traders in, only for the price to reverse direction once the necessary liquidity is absorbed. This mechanism reveals the strategic manipulation often present in efficient markets.
Structure and Behavior of a Sweep
The process typically starts with the market forming a recognizable range, often between a defined high and low. Price then consolidates or slowly trends toward one edge of the range, building tension. As the market reaches that boundary, a sudden surge beyond the level occurs, this is the sweep. Importantly, price does not sustain above or below the level. Instead, it quickly retraces, printing a rejection wick or reversal pattern.
Following the reversal, the market often resumes its original trend or begins a new leg in the opposite direction of the sweep. For traders, this offers a clear point of entry and invalidation, allowing for precise trade setups.
Bullish Scenario, Sweep of Lows
When Bitcoin approaches a prior low, especially one that marked a swing point or a support level, many traders place their stop-losses just below that low. This creates a pocket of sell-side liquidity.
In a bullish liquidity sweep, price will spike below this prior low, often triggered by a news event, a large market order, or a sudden increase in volatility. The market will quickly wick below the level, triggering stop-losses and perhaps inviting new short positions. However, instead of continuing lower, price snaps back above the broken level and begins to climb.
This reversal indicates that large players were absorbing liquidity at the lows and are now positioned long. Traders can look for bullish confirmation via engulfing candles, reclaim of the low, or a fast return into the previous range.
Bearish Scenario, Sweep of Highs
Conversely, when Bitcoin grinds higher toward a prior swing high or resistance level, traders anticipating a breakout may enter early, while others have stop-losses on short positions resting above the level.
A bearish liquidity sweep occurs when price spikes above the prior high, triggering those buy stops and breakout entries. Almost immediately, the market reverses, showing rejection at the highs. This action signals that buy-side liquidity has been used by larger players to enter short positions.
Once price fails to hold above the breakout level and begins to drop, the sweep is confirmed. Traders aligned with this read may look for bearish structure to form, such as a lower high, and enter short with a defined invalidation above the sweep.
Common Pitfalls and Misinterpretations
One of the most frequent mistakes traders make is confusing a sweep for a breakout. Liquidity sweeps are often mistaken for the beginning of a new trend leg, leading to premature entries that quickly get reversed.
Another pitfall is ignoring the broader market context. Liquidity sweeps are most reliable when they occur at logical levels aligned with higher time frame bias. Without that alignment, the sweep may simply be part of a choppy, indecisive range.
Lack of confirmation is also an issue. Entering trades immediately after a wick without seeing structure reclaim, volume shift, or candle confirmation can lead to unnecessary losses.
Confirming a Valid Sweep
To increase confidence in a sweep setup, traders should watch for several confirming behaviors. Volume often spikes during the sweep itself, followed by a drop in volatility as the market reverses. Divergences on momentum indicators like RSI or OBV can also support the idea of an exhausted move.
Most importantly, the reaction after the sweep matters more than the sweep itself. If price fails to reclaim the swept level or continues trending, the move was likely a true breakout, not a manipulation.
In high-probability sweeps, price often reclaims the level and begins forming structure in the opposite direction. Watching for breaker blocks, fair value gaps, or inefficiencies being respected in this phase can also strengthen the case for entry.
Conclusion
Liquidity sweeps are one of the clearest footprints left behind by smart money. While they can be deceptive in the moment, with enough practice and context awareness, they become one of the most powerful tools in a trader’s arsenal.
The key lies in understanding that these moves are engineered, not accidental. Recognizing where the market is likely hunting liquidity, and how it behaves after collecting it, can dramatically improve your ability to enter trades with precision, confidence, and clear invalidation.
__________________________________________
Thanks for your support!
If you found this guide helpful or learned something new, drop a like 👍 and leave a comment, I’d love to hear your thoughts! 🚀
Make sure to follow me for more price action insights, free indicators, and trading strategies. Let’s grow and trade smarter together! 📈

Best Liquidity Grab / Sweep Strategy For Trading Forex & Gold
Learn how to trade liquidity grab / sweep with multiple time frame analysis.
Discover how to combine top-down analysis and smart money concept SMC for trading forex and gold.
You will get a complete step by step trading strategy with entry, stop loss and target.
1. In order to trade liquidity grab / sweep properly, you need to find liquidity zones first.
For this trading strategy, the best liquidity zones will be on a daily time frame.
Check these 2 significant liquidity zones on EURAUD forex pair on a daily.
The zone where the selling activity concentrate will be called a supply zone. While the zone with a strong concentration of a buying activity will be a demand zone.
2. After that, you should look for a liquidity grab / sweep.
For a valid liquidity grab / sweep the daily candle should violate the liquidity zone only with the tail / wick of the candle , while the body should stay within the zone.
Above is the example of a liquidity grab of a demand zone.
While the daily candle closed within the underlined area, the wick went beyond that.
3. After you identified a liquidity grab/sweep, start analyzing lower time frames . For this strategy, the best time frames are 4H and 1H.
On these time frames, you should look for a consolidation and a formation of a horizontal range.
Here is such a range on EURAUD on a 4H.
These ranges will be used for confirmation .
Your bullish signal will be a breakout of the resistance of the range ,
it will confirm a strong buying interest after a liquidity grab.
That is the example of such a confirmation.
4. After that, set a buy limit order on a retest of a broken resistance of the range. Take profit will be the closest strong resistance, stop loss will be below the support of the range.
That is how we trade a liquidity grab/sweep of a demand zone.
With the supply zone liquidity grab trading strategy, you should wait for a bullish liquidity sweep followed by a bearish breakout of a range on a 4H / 1H time frames.
I always say to my students that a single time frame analysis is not sufficient for profitable trading SMC.
A proper combination of multiple time frames is the key to consistent profits.
Following this strategy, you should achieve up to 80% winning rate trading liquidity grabs / sweeps.
❤️Please, support my work with like, thank you!❤️
I am part of Trade Nation's Influencer program and receive a monthly fee for using their TradingView charts in my analysis.

How Smart Money is Positioning in EUR/USD – 5 Scenarios UnfoldedLiquidity Maps & Trap Zones: EUR/USD 1H Breakdown
EUR/USD SMC Analysis – Scenarios Overview
1. Case 1 – Immediate Pump:
The market may pump directly from the current market price (CMP) and take out the external range liquidity resting above the current highs.
2. Case 2 – 15-Min Demand Reaction:
The market could react to the 15-minute demand zone , showing a bullish response and pushing higher toward the 1H supply zone .
3. Case 3 – Inducement & Distribution:
Combined with Case 2, the market may first mitigate the 15-minute demand , then take out the inducement (IdM ) near the 1H supply zone . From there, distribution may begin within that supply range, leading to a drop toward the discount zone .
This would likely involve a fake breakout to the upside (liquidity sweep), trapping buyers and hitting the stop-losses of early sellers before reversing sharply.
4. Case 4 – 1H CHoCH and Triangle Breakdown:
A Change of Character (CHoCH) may occur on the 1H timeframe directly from the current price, leading to a downside move. This scenario would also break the rising triangle pattern , triggering entries from price action traders and increasing market volatility as liquidity accelerates the move downward.
5. Case 5 – 1H Supply Rejection & Free Fall:
The market may react from the 1H supply zone and reject aggressively, resulting in a free fall all the way down to the previous CHoCH level , confirming strong bearish intent from premium to discount.
Thanks for your time..

The Ultimate Guide to Smart Money ReversalsLet’s cut to it. Most retail traders get caught chasing moves that were never meant for them. They’re entering late, reacting to structure breaks without context, or fading moves without understanding what’s really happening behind the price.
If you're trying to trade like smart money on the reversal, at the turn then you need to know when the game is flipping. That’s where the Market Structure Shift (MSS) comes in. But not just any MSS. I'm talking about MSS that follow a liquidity sweep and are driven by real displacementnot weak candles, not in consolidation. Real intent. Real shift.
Here’s how I approach it.
What Actually Counts as a Market Structure Shift?
Everyone talks about market structure higher highs, lower lows, etc. But structure breaks alone don’t mean anything. A valid MSS isn’t just about breaking a swing point. It’s why it broke and how it broke that matters.
I only consider a shift valid when three things are in place:
Liquidity has been taken (above a high or below a low).
The shift is caused by a displacement candle that clearly shows urgency.
The move happens with strength, not during chop or consolidation.
If you don’t have all three, it’s just noise.
Liquidity Comes First
Everything starts with a liquidity sweep. That’s the trap.
Price has to reach into a pool of liquidity usually above equal highs, clean swing highs, or below clean lows to grab those orders, and reject. That rejection is key. It shows smart money is offloading positions into retail breakouts or stop hunts.
Without a sweep, I don’t care what breaks. No liquidity = no reversal setup.
So the first thing I do is mark out obvious liquidity levels. Equal highs, equal lows, trendline touches anywhere retail is likely to have their stops sitting. That’s where the fuel is.
Then Comes Displacement
After the sweep, I want to see displacement a sharp, aggressive move in the opposite direction.
Not a weak pullback. Not a slow grind. A real candle that shows intent.
Displacement is always obvious. You’ll get a clean candle, often engulfing multiple others, that breaks structure and leaves behind an imbalance what we call a Fair Value Gap (FVG). That imbalance is the signature of smart money hitting the market hard enough to leave a gap in the order flow.
If the candle’s weak, or if it happens during consolidation, I skip it. Displacement is what separates real reversals from fakeouts.
Here is a clean example of what it should look like.
Confirming the Shift
Once displacement confirms intent, I check if it actually broke structure.
That means:
In an uptrend, I want to see price break a previous higher low after sweeping a high.
In a downtrend, I want price to break a lower high after sweeping a low.
When that happens, that’s your MSS. Price has grabbed liquidity, shown displacement, and broken a key point in the structure. At that point, we’ve got a confirmed shift in control.
Entries, Stops, and Targets
Here’s how I trade it.
After the MSS, I wait for price to pull back into the origin of the move. Usually, that’s going to be one of two things:
The Fair Value Gap (imbalance left by the displacement candle)
Or the MSS line itself (Shown on the example)
Once price comes back into that zone, that’s where I’m interested in getting in.
Stop loss always goes just above the high (for shorts) or below the low (for longs) of the displacement candle that caused the MSS. You’re giving it room to breathe, but keeping it tight enough to protect capital.
Targets are straightforward: go for the next pool of liquidity. That means swing lows (sell-side) if you’re short, or swing highs (buy-side) if you’re long. That’s where price is most likely to be drawn next.
A Clean Bearish Example
Let’s say price is trending up, putting in higher highs and higher lows. Then it takes out a recent swing high liquidity swept.
Immediately after that, a strong bearish candle drops and breaks the most recent higher low. That candle leaves an imbalance behind—perfect.
Now I’ve got:
✅ Liquidity sweep
✅ Displacement
✅ Break of structure
I mark out the FVG / MSS line, wait for price to retrace back into it, and enter the short. My stop goes above the displacement candle high. My target? The next clean swing low. That's the next spot where stops are resting where the market is drawn.
A Few Things to Watch Out For
This method works, but only if you’re strict about the rules.
Don’t take MSS setups in consolidation. Wait for clean, impulsive breaks.
If the shift happens without displacement or imbalance, skip it. It’s not clean.
Be realistic with stops. Tight is good, but don’t choke the trade. Give it the structure it needs.
The biggest mistake I see? Traders jump in too early trying to front-run the shift before displacement confirms it. Let the story unfold. Wait for the sweep. Wait for the candle that slaps the market and breaks structure. That’s your edge.
As shown here, the first "MSS" is invalid and not the A+ setup you're looking for.
Final Thoughts
Trading smart money reversals is about reading intent. You’re not just looking at price, you’re understanding why it moved the way it did.
When you combine a liquidity grab, displacement, and a break in structure, you're aligning with institutional activity. You're trading at the turn when smart money flips the script and leaves everyone else chasing.
This isn’t about trading every break. It’s about knowing which breaks matter.
Keep it clean. Stay patient. Follow the flow.
__________________________________________
Thanks for your support!
If you found this guide helpful or learned something new, drop a like 👍 and leave a comment, I’d love to hear your thoughts! 🚀
Make sure to follow me for more price action insights, free indicators, and trading strategies. Let’s grow and trade smarter together! 📈

Ultimate Guide to Smart Money ConceptsWhat Are Smart Money Concepts?
Introduction:
If you’ve been trading for a while, you’ve probably noticed that sometimes the market moves in ways that just don’t make sense. You’ve got your technical analysis all set, but the market seems to go in the opposite direction. That’s where Smart Money Concepts (SMC) come in.
At its core, SMC is all about understanding how big players in the market (think hedge funds, institutions, and banks) move prices. These players have massive amounts of capital and information, and they don’t trade like the average retail trader. Understanding their behavior can help you see where the market is going next before it happens.
What is Smart Money?
In the world of trading, smart money refers to the institutional investors who move markets with their huge orders. Unlike retail traders, who might be relying on indicators or patterns, smart money trades based on liquidity, market structure, and order flow.
While retail traders are typically reacting to price movements, smart money is the one causing those moves. They’re out there seeking out places where they can accumulate positions or distribute them. The tricky part is that they’ll often make the market go in one direction just to trap retail traders and get them to take positions before flipping it back to where they wanted it to go in the first place.
Key Concepts in Smart Money Trading
1. Market Structure
Market structure refers to the way price moves in a trend. It’s essentially a pattern of higher highs and higher lows for an uptrend, or lower highs and lower lows for a downtrend.
Smart money uses these patterns to their advantage. When they see the market creating a series of higher highs and higher lows, they’ll take advantage of that momentum to push prices further, knowing retail traders will follow along.
But when they want to reverse the market, they’ll push it in the opposite direction, creating a market structure shift or a break of structure, which signals that the trend is over and a new one is starting.
2. Liquidity
Liquidity refers to the amount of orders available to be filled at different price levels. Smart money knows exactly where retail traders are likely to place their stops or buy orders.
They’ll often push the price to these levels, triggering those stops and collecting the liquidity. Once that liquidity is grabbed, they’ll reverse the price and move it in the intended direction.
A common way to spot liquidity is by looking for equal highs or equal lows, where traders often place their stop-loss orders. These are often areas smart money will target.
3. Order Blocks
Order blocks are areas on the chart where institutions have placed big orders. These are key levels that represent where price might return to later, and they can act as areas of support or resistance.
Order blocks are usually found after big price moves. Institutions place these orders to either accumulate positions or offload them, and price often comes back to these levels to fill orders that were left behind.
4. Fair Value Gaps (FVG)
Fair value gaps, or imbalances, are price areas where the market moves quickly, leaving gaps between candlesticks. These gaps represent areas where the market has moved too fast for regular orders to fill, and price tends to return to these levels to fill the gaps.
Smart money knows that these imbalances are critical areas for future price action, and they’ll use them to re-enter the market after a move has been completed.
Why Does Smart Money Matter?
Understanding smart money concepts is like learning to think like an institution. Instead of chasing after price based on typical retail indicators, you start looking for the big moves that smart money is making. You begin to notice when the market is setting traps for retail traders, and how these large players accumulate positions before pushing price in a big way.
With SMC, you stop guessing and start anticipating. By looking for liquidity zones, order blocks, and market structure shifts, you can get in sync with the big players and follow their moves, not fight them.
Conclusion
Smart Money Concepts are all about shifting your perspective. Instead of thinking like a retail trader looking for quick breakouts, oversold/overbought conditions, or chasing trends — start looking at the market as the big players do. Pay attention to where the liquidity is, identify key order blocks, and use market structure shifts to guide your trades.
By learning to spot these key signs, you’ll stop being the one who’s trapped and start being the one who’s in sync with the smart money.
Ready to trade smarter? Keep an eye on those order blocks and liquidity zones — they’re where the real money is made.
Next Steps
- Start practicing by reviewing charts through the SMC lens.
- Keep refining your understanding of market structure, liquidity, and order blocks.
- Stay patient, smart money trades aren’t about quick wins, but about positioning yourself for big moves.
__________________________________________
Thanks for your support!
If you found this guide helpful or learned something new, drop a like 👍 and leave a comment, I’d love to hear your thoughts! 🚀
Make sure to follow me for more price action insights, free indicators, and trading strategies. Let’s grow and trade smarter together! 📈

Quarterly Theory "QT"
Introduction to Quarterly Theory (QT)
Time must be divided into quarters for a proper interpretation of market cycles.
Combining QT (Quarterly Theory) concepts with basic ICT concepts leads to greater accuracy.
Understanding QT allows you to be flexible. It adapts to any trading style as it is universal across all time frames.
QT eliminates ambiguity by providing specific time-based reference points to look for when entering trades
.
THE CYCLE
Annual Cycle - 3 quarters each
Monthly Cycle - 1 week each
Weekly Cycle - 1 day each*
Daily Cycle - 6 hours each
Session Cycle - 90 minutes each
*Monday to Thursday, Friday has its own specific function .
Annual Cycle:
Q1 JANUARY - MARCH
Q2 APRIL - JUNE
Q3 JULY - SEPTEMBER
Q4 OCT - DECEMBER
Monthly Cycle**:
Q1 FIRST WEEK
Q2 SECOND WEEK
Q3 THIRD WEEK
Q4 FOURTH WEEK
Weekly Cycle*:
Q1 MONDAY
Q2 TUESDAY
Q3 WEDNESDAY
Q4 THURSDAY
Daily Cycle:
Q1 ASIA
Q2 LONDON
Q3 NEW YORK
Q4 AFTERNOON
**Monthly Cycle starts with the first full week of the month.
*Friday has its own cycle, which is why it is not listed.
Q1 indicates the quarters that follow.
If Q1 expands, Q2 is likely to consolidate.
If Q1 consolidates, Q2 is likely to expand.
TRUE OPENS
True price opens are the beginning of Q2 in each cycle. It validates key levels.
What are the true opens?
Yearly: First Monday of April (Q2)
Monthly: Second Monday of the month (Q2)
Weekly: Second daily candle of the week
Daily: Start of the London session (6 hours after the open of the daily candle)
Asia - London - NY - Evening: 90 minutes after the open of the 6-hour candle.
DIAGRAM:
Q1 (A) Accumulation - Consolidation.
Q2 (M) Manipulation - Judas Swing (Trade this).
Q3 (D) Distribution (Trade this).
Q4 (X) Continuation - Reversal of the previous quarter.
Q1 (X) Continuation - Reversal of the previous quarter.
Q2 (A) Accumulation - Consolidation.
Q3 (M) Manipulation - Judas Swing (Trade this).
Q4 (D) Distribution (Trade this).
ANNUAL CYCLE:
MONTHLY CYCLE:
WEEKLY CYCLE:
DAILY CYCLE:

Mastering ICT Concepts: The Ultimate Trading Strategy GuideA lot of people are drawn to ICT trading concepts because they offer a deep understanding of how the markets truly work. With this guide, I want to explain the most popular ICT strategies in a simple and detailed way to help traders navigate these concepts effectively. The Inner Circle Trader (ICT) methodology offers a suite of trading strategies that delve into market mechanics, focusing on institutional behaviors and liquidity dynamics. This guide explores five prominent ICT strategies: Fair Value Gaps (FVG), Power of Three (PO3), Inversion Fair Value Gaps (IFVG) with Liquidity Sweeps, Breaker Blocks, and the Silver Bullet Strategy. Each section provides an in-depth explanation, trading approach, key considerations, and designated spots for illustrative images.
🔍 1. Fair Value Gaps (FVG)
A Fair Value Gap (FVG) represents a price imbalance created when the market moves rapidly in one direction, leaving a gap between consecutive candlesticks. This gap signals inefficient pricing, which the market tends to revisit later to balance liquidity. Understanding FVGs is crucial as they reveal hidden institutional footprints.
How to Trade:
Identification: Spot an FVG when there is a three-candlestick formation where the second candle creates a gap between the high of the first candle and the low of the third candle.
Retracement Expectation: The market typically seeks to fill these gaps as it rebalances price inefficiencies.
Entry Strategy: Wait for price to return to the gap and enter in the direction of the initial impulse. Confirm the trade with market structure shifts or other confluence factors.
Targets: Use previous highs/lows, liquidity zones, or equilibrium levels (50% of the FVG) as potential targets.
Key Considerations:
Timeframes: Higher timeframes like 1-hour, 4-hour, and daily yield more reliable signals.
Volume Confirmation: High volume during the initial impulse strengthens the likelihood of a retracement.
Partial Fills: The market may not always fill the entire gap.
⚡ 2. Power of Three (PO3)
The Power of Three (PO3) describes how institutional players manipulate price action through three key phases: Accumulation, Manipulation, and Distribution. This strategy highlights how smart money engineers liquidity and misleads retail traders before delivering the intended price move.
How to Trade:
Accumulation Phase: Identify consolidation zones where price ranges sideways, often before major sessions (London or New York).
Manipulation Phase: Wait for false breakouts or stop hunts where price temporarily breaks out from the range before reversing.
Distribution Phase: Enter the trade in the opposite direction of the manipulation, targeting the liquidity created during the false move.
Entry Confirmation:
Market structure shifts after the manipulation phase.
Bullish or bearish order blocks aligning with the intended direction.
Fair Value Gaps in the distribution phase.
Key Considerations:
Patience: This strategy often requires waiting several hours for all three phases to complete.
Liquidity Zones: Look for equal highs or lows near the range to anticipate the manipulation move.
Time Windows: PO3 often plays out during high-volume sessions.
🔄 3. Inversion Fair Value Gaps (IFVG) with Liquidity Sweeps
Inversion Fair Value Gaps (IFVG) are advanced price inefficiencies that act as dynamic support or resistance zones. When price fills a traditional FVG, that zone can later serve as an IFVG—particularly when aligned with liquidity sweeps.
How to Trade:
Identify Original FVG: Locate an FVG that has already been filled.
Liquidity Sweep Trigger: Wait for price to sweep liquidity above or below a key level.
Inversion Zone: When price returns to the previous FVG, treat it as a new support or resistance zone.
Entry Confirmation: Watch for market structure shifts or rejection candles at the IFVG.
Key Considerations:
Confluence Zones: Combine IFVG with liquidity sweeps and order blocks.
Patience: Wait for price action confirmation before entering.
Stop Placement: Place stops below the IFVG in bullish setups or above in bearish setups.
🧱 4. Breaker Blocks
Breaker Blocks are zones where previous support or resistance levels are invalidated by a liquidity sweep, only to become reversal zones. They represent areas where smart money accumulates orders before delivering price in the opposite direction.
How to Trade:
Identify Liquidity Sweeps: Spot areas where price breaks above or below a key high/low before reversing.
Breaker Formation: The candle that invalidates the liquidity sweep forms the Breaker Block.
Entry Strategy: Wait for price to retrace into the Breaker Block and confirm the trade with rejection candles or market structure shifts.
Targets: Previous liquidity pools or opposing order blocks.
Key Considerations:
Higher Timeframes: Use 1-hour or 4-hour charts for the best results.
Volume Analysis: High volume during the breaker formation strengthens the signal.
Risk Management: Place stops beyond the breaker boundary.
🎯 5. Silver Bullet Strategy
The Silver Bullet Strategy is a time-based model designed to capitalize on institutional price delivery patterns during specific one-hour windows. This strategy focuses on liquidity sweeps and Fair Value Gaps within these timeframes.
How to Trade:
Time Windows: Target these key one-hour sessions:
London Open: 03:00 AM – 04:00 AM EST
New York AM Session: 10:00 AM – 11:00 AM EST
New York PM Session: 02:00 PM – 03:00 PM EST
Identify Liquidity Zones: Look for equal highs/lows or session highs/lows.
Execute Trades: Enter trades when price sweeps liquidity and rejects from an FVG or Breaker Block within the Silver Bullet window.
Targets: Use opposing liquidity pools or session extremes.
Key Considerations:
Strict Timing: Only trade within the designated time windows.
Confluence Factors: Combine with market structure shifts and order blocks.
Risk Management: Place stops beyond liquidity sweep wicks.
Conclusion
Mastering ICT trading strategies requires patience, precision, and continuous practice. These five strategies—FVG, PO3, IFVG with Liquidity Sweeps, Breaker Blocks, and the Silver Bullet—provide a comprehensive framework to align with institutional price delivery. Use confluence factors and practice in demo environments before applying these methods in live markets.
Happy Trading!
Note: This guide is for educational purposes only and not financial advice.
__________________________________________
Thanks for your support!
If you found this guide helpful or learned something new, drop a like 👍 and leave a comment, I’d love to hear your thoughts! 🚀

Liquidity Sweeps: A Complete Guide to Smart Money Manipulation!🔹 What is a Liquidity Sweep?
A liquidity sweep occurs when price temporarily moves beyond a key level, such as a previous swing high or low to trigger stop-losses and lure breakout traders into bad positions before reversing in the opposite direction. This is a classic smart money technique used to grab liquidity before initiating the real move.
Financial markets need liquidity to function, and institutions (smart money) can’t enter or exit large positions without it. Instead of chasing price like retail traders, they manipulate price to engineered levels where liquidity is resting, allowing them to fill their orders without causing massive slippage.
🔹 How Liquidity Works in the Market
To understand liquidity sweeps, it’s important to know where liquidity pools exist. These are areas where a high number of stop-loss orders and pending market orders are placed.
Stop-loss liquidity: Traders set stop-losses above swing highs and below swing lows. When price hits these levels, stop-loss orders trigger as market orders, adding fuel for big moves.
Breakout trader liquidity: Many traders enter buy trades when a high is broken and sell trades when a low is broken. Smart money often uses these breakout orders as liquidity before reversing the market.
Essentially, liquidity sweeps allow smart money to take the opposite side of retail traders’ positions before moving the market in their favor.
🔹 Identifying Liquidity Sweeps on the Chart
A valid liquidity sweep has three key components:
1️⃣ A Key Liquidity Zone:
Look for well-defined swing highs and lows where stop-losses are likely sitting.
Equal highs and equal lows are prime targets because many traders place stops there.
Areas with high trading activity (volume profile levels, POCs) are also potential liquidity pools.
2️⃣ A Quick Price Spike Through That Level:
Price briefly moves beyond a high or low, triggering stop-losses and luring breakout traders in the wrong direction.
This move often happens suddenly, with a sharp candle wick or a short-term breakout that quickly fails.
3️⃣ An Immediate Reversal (Rejection):
Price fails to hold above/below the liquidity level and reverses aggressively.
Strong rejection candles like long wicks, bearish engulfing (after a buy-side sweep), or bullish engulfing (after a sell-side sweep) confirm the sweep.
The stronger the rejection, the higher the probability that smart money just manipulated price to collect liquidity before the real move.
🔹 Types of Liquidity Sweeps
🔸 Buy-Side Liquidity Sweep (Bull Trap)
Price spikes above a key high, triggering stop-losses from short sellers and inducing breakout buyers.
If price fails to hold above that level and quickly reverses, it confirms the sweep.
This is a signal that price is likely to drop as smart money absorbs liquidity before selling off.
Example of a buy side liquidity sweep (BSL)
🔸 Sell-Side Liquidity Sweep (Bear Trap)
Price dips below a key low, triggering stop-losses from long traders and trapping breakout sellers.
If price fails to hold below that level and quickly reverses, it confirms the sweep.
This is a signal that price is likely to rise as smart money collects liquidity before pushing higher.
A liquidity sweep is not just a random wick, it’s a strategic price move designed to trap traders before a reversal.
Example of a sell side liquidity sweep (SSL)
🔹 Why Liquidity Sweeps Matter
Liquidity sweeps provide traders with some of the highest probability reversal signals because they:
✔ Show where institutions and smart money are active
✔ Confirm major support and resistance levels
✔ Help traders avoid false breakouts
✔ Provide excellent risk-to-reward setups
Once a liquidity sweep is confirmed, price often moves aggressively in the opposite direction, as smart money has finished collecting liquidity and is now driving price toward their true target.
🔹 How to Use Liquidity Sweeps in Your Trading
1️⃣ Identify Key Liquidity Zones
Mark previous swing highs and lows where traders are likely placing stop-losses.
Pay attention to equal highs/lows and tight consolidations, as these areas tend to hold a lot of liquidity.
Use volume profile tools to see where the highest liquidity clusters exist.
2️⃣ Wait for a Liquidity Sweep & Rejection
Don’t enter just because price broke a high/low, wait for confirmation.
A strong rejection candle (wick, engulfing pattern, pin bar, etc.) signals that the sweep was a trap.
Lower timeframes (5m, 15m) can help confirm entry after a sweep happens on higher timeframes.
3️⃣ Combine with Other Confluences
Liquidity sweeps are most effective when combined with:
✅ Fair Value Gaps (FVGs): Price often sweeps liquidity before filling an imbalance.
✅ Order Blocks: Smart money enters positions at order block levels after a sweep.
✅ Fibonacci Retracements: Sweeps often happen near the Golden Pocket (0.618 - 0.65).
✅ Volume Profile (POC): If a sweep happens near a Point of Control (POC), it adds extra confluence.
The more confirmations you have, the higher the probability of a successful trade!
🔹 Common Mistakes Traders Make with Liquidity Sweeps
Entering too early: A liquidity sweep needs confirmation. Wait for a clear rejection before trading.
Ignoring higher timeframes: The strongest sweeps happen on 1H, 4H, and Daily charts. Lower timeframes can be noisy.
Forgetting the invalidation rule: If price closes above/below the liquidity sweep level, the move may not be valid.
Chasing price after a sweep: Always look for an optimal entry (retracement to a key level) rather than impulsively entering.
🔹 Advanced Tips for Trading Liquidity Sweeps
📌 Use Time-of-Day Analysis:
Liquidity sweeps often occur before major sessions open (London, New York, etc.).
Many sweeps happen during high impact news releases, be cautious.
📌 Look for Repeated Sweeps at the Same Level:
If price sweeps liquidity multiple times without follow through, it increases the chance of a strong reversal.
A double or triple sweep is a powerful confirmation that smart money is manipulating price before a real move.
📌 Use Liquidity Sweeps for Entry & Exit Points:
Entering after a confirmed liquidity sweep can provide great risk-to-reward setups.
Use liquidity sweeps as take-profit targets if price is approaching a key high/low, expect a sweep before reversal.
📌 Final Thoughts: Mastering Liquidity Sweeps
Liquidity sweeps are one of the most powerful tools in a trader’s arsenal because they reveal smart money’s true intentions. By understanding how they work, traders can:
✅ Avoid being trapped by false breakouts
✅ Identify high-probability reversal points
✅ Follow smart money instead of fighting it
Next time you see price breaking a high or low, don’t immediately assume it’s a breakout. Look for the liquidity sweep if it happens, it could be a game changer for your trading strategy. 🚀
Also, check out our Liquidity sweep indicator!
__________________________________________
If you found this guide helpful or learned something new, drop a like 👍 and leave a comment. I’d love to hear your thoughts! 🚀
Make sure to follow me for more price action insights, free indicators, and trading strategies. Let’s grow and trade smarter together! 📈✨

Fair Value Gaps (FVGs) – A Complete GuideWhat Are Fair Value Gaps (FVGs)?
A Fair Value Gap (FVG) is a price imbalance on a chart that occurs when the market moves aggressively in one direction, leaving an area where price did not trade efficiently. These gaps are often created by institutional traders (banks, hedge funds, and large market participants) executing big orders.
Key Characteristics of a FVG:
✅ Occurs when price moves impulsively, creating an imbalance
✅ Appears in a three-candle formation
✅ The gap forms between the wicks of the first and third candles
How to Identify a FVG:
1️⃣ Look for a strong price move (bullish or bearish).
2️⃣ Find a three-candle sequence where the middle candle has a large body and a gap between the first and third candle wicks.
3️⃣ Mark the area between the first and third candle wicks—this is your Fair Value Gap.
Example:
Imagine price explodes upward with a big green candle, skipping multiple price levels without much resistance. This creates an inefficiency because price hasn’t traded fairly in that area, making it likely that price will revisit it later to fill the imbalance.
Here you can see that price completely filled up that gap and moved higher.
Same here:
How to Use Fair Value Gaps in Trading
FVGs can serve as key zones where price is likely to react. Here’s how you can use them to improve your trading:
1️⃣ Fair Value Gaps as Support & Resistance
Bullish FVG (Support Zone):
If price retraces into a bullish FVG (gap formed in an uptrend), it can act as support and push price higher.
This is a good area to look for buying opportunities.
Bearish FVG (Resistance Zone):
If price retraces into a bearish FVG (gap formed in a downtrend), it can act as resistance and push price lower.
This is a good area to look for selling opportunities.
2️⃣ Using FVGs for Trade Entries & Exits
Price often revisits a Fair Value Gap before continuing its original trend.
A trader can wait for price to fill the gap and then look for confirmations like candlestick patterns or volume spikes before entering a trade.
Stop-loss placement: Put your stop-loss below/above the FVG zone to reduce risk.
3️⃣ Liquidity & Institutional Activity
Institutional traders often target these inefficiencies to fill their orders.
When price returns to an FVG, it may be because institutions are executing trades at those levels.
Why Are Fair Value Gaps Useful?
They act as magnets for price – Price tends to revisit these gaps before continuing its move.
They provide high-probability trade setups – FVGs help traders find potential reversal or continuation zones.
They improve risk management – You can use them for better stop-loss placement.
They align with Smart Money Concepts (SMC) – Institutions often use these levels for liquidity.
Tips & Tricks: How to Combine Fair Value Gaps with Other Strategies
1️⃣ FVG + Order Blocks = Strong Confirmation
If a Fair Value Gap aligns with an Order Block, it becomes a powerful area of interest.
This increases the chances of a successful trade.
2️⃣ FVG + Fibonacci Retracements
If an FVG aligns with a key Fibonacci level (like 61.8% or 50%), the chances of a price reaction increase significantly.
3️⃣ FVG + RSI or Divergence
If price revisits a FVG while RSI is overbought or oversold, it signals a high-probability reversal.
4️⃣ Higher Timeframe FVGs Are More Reliable
FVGs on the 1-hour, 4-hour, or daily charts are more effective than those on smaller timeframes.
5️⃣ Monitor News Events
If an FVG is formed due to a major news event (e.g., Fed announcement, CPI data, earnings report), be cautious, as price may act differently than expected.
Final Thoughts
Fair Value Gaps are a powerful tool that help traders identify key levels of liquidity and institutional price action. They work best when combined with other strategies like Order Blocks, Fibonacci, and RSI to increase accuracy.
By understanding how and why price moves back into these gaps, traders can anticipate potential high-probability trade setups and trade alongside smart money.
__________________________________________
Thanks for your support!
If you found this idea helpful or learned something new, drop a like 👍 and leave a comment—I’d love to hear your thoughts! 🚀
Make sure to follow me for more price action insights, free indicators, and trading strategies. Let’s grow and trade smarter together! 📈✨
