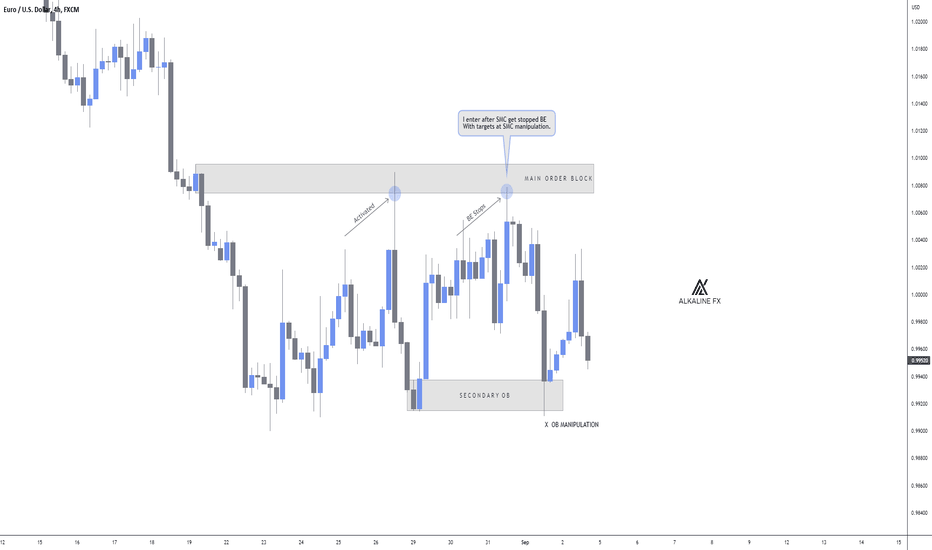
SMC
Imbalance, POI, and Confirmation entry back test/case studyThis video is longer than my usual however I explain what an Imbalance is and how it can be used to trade within the markets. I also go through a replay back to show it can be used to catch confirmation entries. Any feed back is greatly appreciated.
Discount/ premium pricing - SMC📉 We use the Fibonacci retracements for spotting discount and premium levels in a range.
📝 We draw the Fibonacci tool from the bottom to the top in an uptrend, and from the top to the bottom in a downtrend.
Terminologies:
EQL: equilibrium = a state of physical balance (50%).
Discount: we buy from
Premium: we sell from
To make it more approachable, we can compare using the fib tool as a scanner when you go to the supermarket. You won't buy the product when it's expensive, but only buy when it's cheap. Beside that - if we want to sell a product to a supermarket, we want to get the highest price as possible.
Combining it with order blocks
You can basically increase the probability of order blocks with the fib tool. Order blocks that are not in discount you won't buy from, and order blocks that are not in premium you won't sell from.
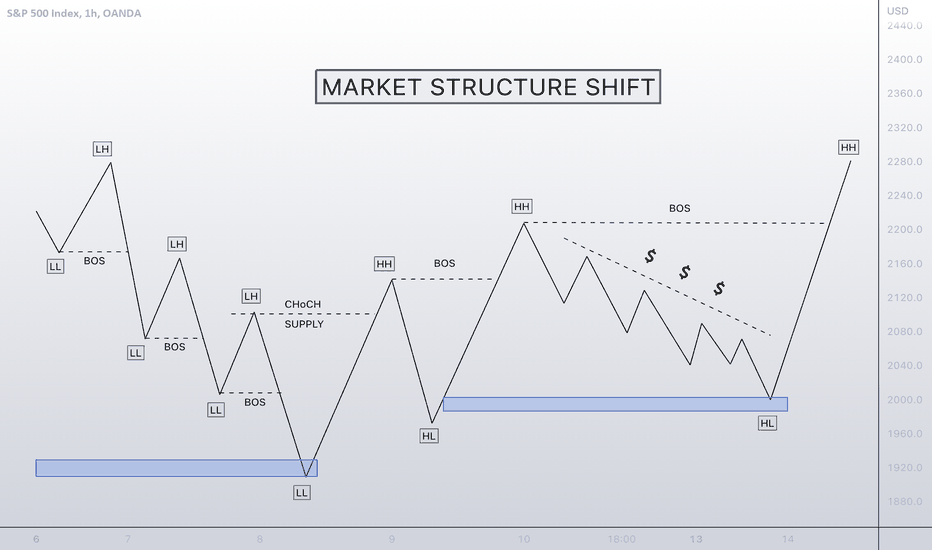
🤓 🤓 MARKET STRUCTURE SHIFT! SMCMarket structure in Forex trading or price action is how many people take advantage of the markets. No indicators, and no volume. Because the market does not have a centralised exchange. Forex traders often swing trade the market based on the structure to take advantage of the opportunity.
Structural market change is broadly defined as a shift or change in the way in which a market or economy functions or operates.
I have tried my best to show you in the easiest possible way to look out for. Save this to your notes for future reference.
🤓 🤓 DON'T TRADE FROM THIS ZONE!I have tried to make this example as simple as possible to understand for anyone that are not too familiar with liquidity hunts.
Always look for were the most liquidity is accumulating then place your trade above or below were there has been a liquidity swoop, as long as it lines up correctly with what strategy you are using.
If you add this to your trading tool belt this will improve your overall results.
LIQUIDITY MODELS🔹 Liquidity is like fuel to move the market in a specific price zone.
🔹 We can find liquidity in zones where a lot of people set their stop losses and buy/sell stops.
🔹 The market makers will manipulate the price to break these obvious zones and take the liquidity.
🔹 These are the most common liquidity patterns.
GBPUSD Using the Element of TimeThe element of time is a technical analysis tool that I've previously elaborated on -> Check links to related ideas.
The illustration is pretty self-explanatory.
First attempt failed, however price presented a better opportunity a couple hours later which ultimately yielded all our profits for the week.
I will provide my thought process, execution and exits for this trade in a subsequent recording :)
Stay tuned !
What is an Order Block? 🎯Why are order blocks formed?
Order blocks are created when a breakout move doesn't go to plan.
If banks get caught in a fake breakout move, they aren't going to sit and cry about it.
They are going to push the price back up/down so that they can close out of their negative positions to join the correct side of the market.
Stop using order blocks that have no logic, widen your chart perspective.
SMC Abbreviations & ExplanationsIOF: Institutional Order Flow
+OB: Bullish Order Block
-OB: Bearish Order Block
FVG: Fair Value Gap
SMT: Smart Money Tool/Technique
+BB: Bullish Breaker
-BB: Bearish Breaker
+MB: Bullish Mitigation Block
-MB: Bearish Mitigation Block
SSL: Sell Side Liquidity
BSL: Buy Side Liquidity
EQM: Equilibrium
CE: Consequent Encroachment
EQH: Equal Highs
EQL: Equal Lows
HTF: Higher Timeframe
MMM: Market Maker Model
MMSM: Market Maker Sell Model
MMBM: Market Maker Buy Model
LOKZ: London Open Kill Zone
LCKZ: London Close Kill Zone
NYOK: New York Open Kill Zone
SMT- Smart Money Tool
LP- Liquidity Pool
IOF-Institutional Order Flow
BISI - Buy Side Imbalance Sell side Inefficiency
SIBI- Sell Side Imbalance Buy Side Inefficiency
COT- Commitment of Traders
NFP-Non Farm Payroll
OTE - Optimal Trade Entry
BSL - Buyside Liquidity
SSL - Sellside Liquidity
OB - Order Block
+OB - Bullish Order block
-OB - Bearish Order block
PB - Propulsion Block
VB - Vacuum Block
MB - Mitigation Block
BRK - Breaker
+BRK - Bullish Breaker
-BRK - Bearish Breaker
FVG - Fair Value Gap
LP - Liquidity Pool
LV - Liquidity Void
RTO - Return to Order Block
RTB - Return to Breaker
RR - Risk to reward
MS - Market Structure
BMS - Break of Market Structure
SMS - Shift in Market Structure
IOF - Institutional Order Flow
PDH - Previous Daily High
PDL - Previous Daily Low
DH - Daily High
DL - Daily Low
CE - Consequent Encroachment
IPDA - Interbank Price Delivery Algorithm
MTH - Mean Threshold
LO - London Open
NYO - New York Open
NYKZ - New York Kill Zone
AMD - Accumulation, Manipulation, Distribution
WDYS - What Do You See?
TSBM - Turtle Soup Buy Model
TSSM - Turtle Soup Sell Model
SH - Stop Hunt
SL - Stop Loss
SP - Stops Purged
TP - Take Profit
HTF - High Timeframe
LTF - Low Timeframe
1D - Daily Timeframe
1W - Weekly timeframe
1M - Monthly timeframe
📚 Inducement: What Is It ⁉️Inducement is a trap before an area of supply or demand.
Price will usually lure impatient buyers/sellers into the market before the zone is met to create liquidity.
Once the impatient traders get trap [ped and stopped out, the true move begins.
This just goes to show the importance of sitting on your hands!
Traders, if you have your own opinion about this idea, write in the comments section, I always reply. 💬
🚨 RISK DISCLAIMER:
Trading Crypto, Futures, Forex, CFDs, and Stocks involves a risk of loss.
Please consider carefully if such trading is appropriate for you.
Past performance is not indicative of future results.
Always limit your leverage and use a tight stop loss.
--------------------------------------------------------------------------------------------------------
Please like, subscribe, and share this idea with others! ⬇️
--------------------------------------------------------------------------------------------------------
Conservative vs Aggressive Entries - Different ways to enter!There are different ways to enter trades - some opt for an aggressive approach while others opt for a conservative entry. Aggressive entries are taken at the first signs of reversal out of a supply/demand zone while conservative entries wait for more significant larger structure breaks in the trend.
I almost always opt for the conservative take as I want structure to be with me all the way. By getting in with an aggressive entry you can achieve higher risk reward but you will also inevitably run into more losses because you are relying on the short term trend to confirm your higher timeframe intensions.
It comes down to your risk tolerance: Conservative entries require patience and sometimes when they don't give an entry you'll need discipline to avoid getting burned - but they are the wiser option for risk averse traders. Aggressive trades will get you in on nearly every move you have planned but they'll also get you took out a fair amount more than conservative entries. How much pain can you take?
I recommend choosing an approach and sticking to it - being a master of one approach is better than a novice at many!
How to win your continuations and avoid bad tradesHi,
Those who follow me know that I only trade with pure price action and volume . If you are someone who also hates the subjectivity of indicators then you'd find this interesting.
This is what I look for before taking continuation trades, keep in mind that what's important when you trade like that is the concept of weak high/lows and strong highs/lows.
When you find those points all you have to do is trade with the trend then find the last point of supply/demand and take your entry.
Hope this helps.
Part 3 - How to identify Trend Reversal | Trading PlanOnce you have successfully identified previous Price action with Market Structure and SMCs you can now look for potential Entries with the highest possible rewards.
For Bearish Trend: Fib is drawn from Swing high to Swing low
For Bullish Trend: Fib is drawn from Swing low to Swing high.
It's always important to go with the trend and to avoid trading when market is under consolidation.
When making entries, always focus on The main market structure and LTF Market flow. When recent Swing high and swing lows are broken Market flow can be shifted. And you can have a bullish market flow within a bearish market structure. Always trading in corrdination of both.
It's important to understand when to enter the market and its even more important to understand when to exit the market. You can use LTF key levels such as demand and supply zones as your target levels, or else you can also use fib levels as well. Confluence is always the key.
If you have any doubts and further questions, leave a comment below and i will address them.
Retail vs Smart Money ExamplesIn this example, we will look into the parallel channel formed on AUDUSD.
How Retail View the Breakout:
Price broke and re-tested the breakout trendline
Price should now continue bearish after showing signs of rejection
How Smart Money View the Breakout:
Price broke out of the retail trendline, liquidity has now been formed in their stop loss region
Once this area is wiped, we could consider sells from the order block that created it.
Smart Money Concepts Diagram With Wyckoff SchematicsThis is a Smart Money Concepts Diagram With Labeled Wyckoff Accumulation And Distribution Schematics.
These are the main smart money trade setups that you will find in your charts, this is how smart money (big banks, funds, composite man, etc.) manipulate markets to engineer liquidity.
Wyckoff methods teach a bigger picture view of the markets and why they are moving, many times you will see smart money setups inside of bigger picture Wyckoff schematics that form certain parts of the schematic itself.
I hope you find this to be a useful reference diagram for Smart Money trade setups 😁
If you have any questions please comment below and I can make updates to the F.A.Q.
Educational ContentIn this example, we can see that this is a typical trend continuation move.
1. Bullish impulse leg, followed by a "Consolidation before breakout".
2. For those who trade with SMC = Smart Money Concept, you will identify the breakout zone as an ORDER BLOCK .
3. Prices made a Swing High, followed by a "FALLING WEDGE" pattern, forming liquidity beneath the minor swing lows while approaching the ORDER BLOCK .
4. 1st Buy Entry would be at "OB1 - PRIMARY ZONE".
5. 2nd Buy Entry would be a classic "Breakout Retest" retail trading technique.
This is how you combine Retail Logic with Smart Money Concept.