Biggest Mover of March! (13.30%)Hey Traders!
Just like that, another month has flown by, end of the quarter this time, so it's a little bit more special. What I want to do is run through and have a look at the biggest movers to the upside and to the downside of the month. One of them really stood out across all pairs an I think you guys already know which one I'm going to talk about, the Japanese yen.
Looking at our biggest mover of the month, it was AUDJPY and unsurprisingly given how bullish we are looking at the Aussie dollar at the moment and how bearish we were looking at the Japanese yen. As the data unfolded throughout the month, which I talk about momentarily, I am not shocked about this big move but was no expecting a whopping 13.30%. Which was a fantastic move and good to see these types of moves in the Forex market when the volatility comes through. It's bad news obviously for the Japanese yen. Great news for the Aussie dollar. Be interesting to see how it reacts from here.
The Japanese yen was very volatile this month. We have a lot of movement due to the unforeseen circumstances around the world. Looking at the Japanese yen fundamentally, it wasn't a great month. Their unemployment rate increase showing that less people had jobs. The producer price index actually increased too much greater than forecasted, which was good news for the Japanese yen, but that didn't last long with the BSI manufacturing index being a massive shock to the system. While the forecast for it was an 8.2 from its previous of 7.9 (forecasting growth). It came in at a whopping -7.6, which was very bad news. Once we adjusted to that bad news, we were met with the trade balance, which was extremely negative as you can see by the chart put below. You can see where the money started to leave the Japanese yen and flood over to the AUD. From there, the shorting of JPY just carried on and on. We had some news come out, like the Tertiary Industry Activity, it was predicted to be negative, it wasn't as negative as forecasted, but the end of the day it is still slower growth which pushed the price even further down. The unemployment rate increased right at the end of the month. As you can see that the price started to push back in and the news might start flipping to show more strength into the Japanese yen compared to what we had.
We did see also the pound take a bit of a hit as well as the euro. The euro was a very interesting one as it's reacted with how the whole Russia and Ukraine, scenario is unfolding. Keep an eye on that as we proceed with peace talks, making progress supposedly. We might see a volatility coming through these currencies, but overall I have a bearish sentiment moving into April, not too sure how well that's going to hold up in the long run.
And finally, looking at the Swiss franc paired against the US dollar, didn't really make much progress. It was very weak at the start of the month or maybe the US dollar was just wrong. But you can see it moves quite nicely, then we hit the mid point, it's just pulled back into almost where we've opened leaving a very tall top wick on USDCHF. It'll be interesting to see on where we progress from here. Only losing about 0.63% to the US dollar.
Thanks so much for tuning in. I hope you enjoyed this. If there is any questions or anything you would like to ask, please leave a comment and I'll get back to you as soon as possible. Cheers guys. Happy trading.
Z-VALUE

Fundamental and statistical analysis method - ExplainedHi All,
I have been asked by few in comments and personally to post fundamental analysis of few other companies in similar way as that of FB and PYPL (as per linked ideas). Since, I will not be able to take all the requests, I thought I will make a video explaining how to do it yourself :)
⬜ Following things are discussed in the video
🎲 Earnings
Not significant unless the gap is too much. Things to look for are:
If the recent earnings and revenue has met expectation/estimation
If the next earning/revenue estimates are higher/lower than current one.
Cyclical nature of quarterly earnings - check results and estimations of last two years of same quarter
🎲 Quality
Can use open source script Quality-Screen from community library.
Color coded based on standards and very generic method.
May also need to consider that some of these stats may be industry and sector based and may require comparison among similar stocks.
Overall - if green/lime good, if lots of red/orange - bad. Silver - in between.
🎲 Relative Growth
Can use open source script Relative-Growth-Screen from community library.
Applies Bollinger bands/ Keltener channel to define whether they are relatively high or low. Can also use RSI - but, have not tried :)
Measures growth over past few years.
🎲 Drawdown from ATH
Price drawdown from ATH and historical drawdown levels. Can use open source script Drawdown-Range from community library.
Tells what is the current price drawdown from ATH.
Provides details on historical drawdown levels and ranges.
🎲 Drawdown comparison - price vs fundamentals
Percentile-Price-vs-Fundamentals is the utility I built to carry out the comparison. I am not sure if there are any other comparable tools. Tool is useful for comparing if price drawdown is justified with the drop of fundamentals or if this is an overreaction.
⬜ Please note
▶ News events and probability of future potentials are not taken into consideration. Objective here is to work solely based on the readily available stats.
▶ It is unreliable use this method for short term trading as we cannot be sure when the things going to price in or if they have already priced in.
▶ Not a financial advise. Just an idea based on the research I have done so far. Constructive criticism welcome. Happy to learn from others.

GOLD TRADING GAUGE | EASY TO OBSERVEThe 'Why' Insight:
The other way to keep your money is to put it in a savings account or into bonds that aren't very risky and will pay you interest. People who invest in gold lose money when interest rates go up because the yields on savings accounts and bonds also go up, which makes gold less appealing as a long-term investment. It is very important to look at the interest rate when you are trying to figure out how much gold is worth. Storage costs and insurance are two more things to think about. The price of the commodity will be the sum of all of these things.
Thereafter, how the price moves depends on things like the movement of the US Dollar and things like demand and supply.
Warning: This is the broader view, not the detail spesific method for entry.

Open Ocean Cex & Dex aggregatorHi guys recently i found this project and it seems pure gold to me and i was eager to share it with you .
some reasons :
1- Cross Chain Feature
2-Low Market Cap
3-Good Investors
4-Reasonable Roadmap and tokenomic
and the most important reason
5-Brand New Idea in Defi eccosystem
A.H

Enhanced Magic Formula for fundamental analysisThis is an experimental procedure based on fundamentals. Since, there isn't much option to backtest these methodologies, I am trying to create a trade and then measure performance over long period of time.
Magic Formula investing method is invented by Joel Greenblatt . In a nutshell strategy does following:
Rank all the stocks based on Return on Capital
Rank all the stocks based on Earning Yield
Add these ranks to come up with a combined rank.
Invest equally in first 10 stoscks of combined. Rebalance yearly.
Concept here is, earnings yield represents value whereas return on capital represents quality. Combining these two to get the stocks which have best of both.
More information on the methodology is present here: www.investopedia.com
Improved Method :
Since, tradingview does not allow comparing fundamentals or technicals of all stocks, I had to do this in python. Output report can be found here: docs.google.com
Basic Filtering of Stocks:
Basic filtering of stocks is done based on the methods as mentioned in quality screen indicator:
Since the financial data is taken from yahoo for generating report, some of the quality parameters are not included and there can be slight changes in the fundamental values present in tradingview. No other initial filtering is applied.
Derive ranks on several Value, Profitability, Growth and Cashflow parameters:
Value Parameters : P/E, P/S, P/B, P/C, P/FCF, PE-Forwarding, PEG Ratio
Profitability Parameters : ROA, ROE, ROI, GrossMargin, OperatingMargin, ProfitMargin
Growth and Momentum Parameters : Quarterly, Half Yearly and Yearly Performance, Upside Calculated from analyst valuation
Cashflow Parameters : Quick Ratio, Current Ratio, Debt to Equity, Long term Debt to Equity, Debt to Assets, Long term debt to assets.
Derive composite rank for Value, Profitability, Growth and Cashflow based on individual ranks:
For example, Add up all ranks of value parameter to come up with Value Score. And then sort value score in ascending order to get value rank
Derive combination ranks such as value/growth rank, value/profitability rank etc by similar method: Also create combined rank which considers all 4 ranks - value, profitability, growth and cashflow.
Sort the values based on combined rank to get top value/quality stocks - which represents lowest score.
Final stock selection consideration : Instead of picking first 10 stocks, I have picked stocks from different sectors thus sacrificing bit of Magic Formula edge. This is to avoid high concentration on single sector.
Final list of stocks selected:
SBSW - Basic Materials (Gold)
VALE - Basic Materials (Industrial Metals and Mining)
GOOG - Communication Services (Internet and Information)
CROX - Consumer Cyclical (Footwear and Accessories)
ENVA - Financial (Credit Services)
EVR - Financial (Capital Markets)
UTHR - Healthcare (Biotechnology)
LPX - Industrial (Building Products and Equipment)
TER - Technology (Semicondoctor Equipment & Materials)
AMAT - Technology (Semicondoctor Equipment & Materials)

Book Value Per Share - Is it outdated? Attached is my take on Book Value Per Share. Happy Thanksgiving to all Americans out there.
Stock Mentioned:
NASDAQ:BNGO
Best of luck traders,
Brayden

How To Use Financial Ratios To Make Better DecisionsFinancial Ratios help you evaluate a company. Most financial ratios will show you how much money you're paying for a specific piece of the business. Let us give a few examples:
Price-to-Sales Ratio = Market Cap / Sales
The Price-To-Sales ratio or PS ratio tells you how expensive a company is relative to its total sales. The formula is calculated in two different ways: divide the company's market capitalization by its revenue or divide the current stock price by revenue-per-share. Because this ratio is being calculated with live price information, you can also watch it in real-time on the chart as we've shown in this example above.
If a company has a market cap of $10 billion and revenue of $1 billion, well that, that implies a PS ratio of 10. You're paying $10 for every $1 in sales. You can do ratios like this for all aspects of the company. For example, PE ratio or Price-To-Earnings ratio measures the Market Cap / Earnings. This tells you how much you're paying for every dollar of earnings.
Keep in mind that Financial Ratios are not perfect. They are also not a buy or sell recommendation. Instead they are shortcuts, ways to quickly evaluate a company, compare its underlying fundamentals, and study that company relative to other companies. You also must remember that financial metrics can change quickly with a single earnings report. A company's future expectations are also just as important. A company like Apple might have a high PE ratio, but if they're building and growing revenue into the future, their PE ratio could come down over time.
Remember, Financial Ratios and Financial metrics in general paint a picture of the underlying business and its earnings potential. Here are some other resources to get you started:
1. Read more about Financials on TradingView in our Help Center.
2. You can also code your own strategy or indicator using this financial information .
3. We've also created a library in our Help Center so you can learn more about every Financial metric.
Here are some other financial ratios that you may find interesting and how they're calculated:
PE Ratio = Market Cap / Earnings
PB Ratio = Market Cap / Book
PEG Ratio = PE / Earnings Growth
Quick Ratio = (Cash + Cash Equivalents + Current Receivables + Short Term Investments) / Current Liabilities
Dividend Yield = Dividends Per Share / Price
EV Multiple = Enterprise Value / EBITDA
To access all of the Financial Ratios available to you, click the Financials button at the top of your chart. From here, you can select many different Financial metrics and study markets at a deeper level.
More importantly, you can combine the study of Technical and Fundamental analysis at the same time. Meaning you can evaluate the fundamental side of the business including its earnings and valuation while ALSO studying price action and planning a trade.
Please feel free to share your feedback and comments below! Thank you for reading.

When is the Best Time to Buy & Sell ?
📊 When Is The Best Time To Buy & Sell? 📊
━━━━━━━━━━━━━
The two most important decisions an investor will make are when to buy and when to sell. The best time to buy is when others are pessimistic. The best time to sell is when others are actively optimistic. When buying, remember that the prospect of a high return is greater if you buy after its price has fallen rather than after it has risen. But caution should be exercised. For example, after the stock of fictitious Company X declined by 30%, 40% or more, the first question to ask is why. Why did the stock fall as it did? Did other stocks in the same industry experience a decline? If so, was it as severe? Did the entire stock market fall? If the broader market or other stocks in the same industry/sector performed relatively well, there may be a problem specific to Company X. It’s best to adopt a buy/sell discipline and adhere to it. Benjamin Graham, the father of value investing, once said, “The buyer of common stocks must assure himself that he is not making his purchase at a time when the general market level is a definitely high one, as judged by established standards of common-stock values.” His reference was to what we discussed as fair value under the section Stock Valuation above.

Improve your Technical Analysis using Fundamental Analysis!In this video I decided to show you how to use Fundamental Analysis along with Technical Analysis in order to improve your understanding about the market.
Although it is not common, as most people seem to like Tradingview for its price charts/indicators, you can use this platform for fundamental analysis as well . In this video I explain the importance of looking at the fundamentals through a chart.
I hope you'll like the video! In this case, remember to support this idea, and follow me for more content like this.
Have a good week.
Fundamental Indicators used in this video:
- Price to Earnings;
- Net Margin (%);
- Return on Invested Capital (ROIC).

The 5 ways civilizations collapseI watched a great video about the collapse of civilizations and I'd like to comment on it, with a bit more of a focus on the economic reasons and outcomes.
1- Crushed in a war by a far stronger force
Destroyed, or elite destroyed (government & big banks & business owners)
Aztec Inca Baghdad Carthage...
Modern examples include Iraq and Libya. Just look at before and after pictures. Libya was destroyed by the USA and has returned to slavery, Iraq is some sort of warzone with a currency being literally sold as a ponzi scheme (search the Iraqi Dinar scam), he by the way the "it will go up" Dinar crashed so hard a few months ago I wasn't sure if it was worth posting about.
PRO TIP: DO NOT INVEST IN A COUNTRY THE USA ARE ABOUT TO "BRING DEMOCRACY" TO!
2- Too aristocratic
Central American, Andean, Greek, Anatolian, Syrian, Ghana, Zimbabwe, Indus Valley, Khmer civilizations ended in big part because they were too inegalitarian.
(Very) ancient civilizations were all ultra aristocratic with the population getting vampirized by a minority through slavery (wageslavery), ravenous taxes (reminds me of something), human sacrifices. And they went down the same way.
In ~1150 BC all civilizations around the anatolian peninsula (including the famous Mycenaean one in Greece) rapidly collapsed at around the same time.
In some cases tiny barbarian armies were able to wipe out much stronger civilizations. The reason is the population hated their parasitic rulers and did not want to pay heavy taxes for their rulers to waste (ancient elites did not know well how to manipulate a population into submission and even WANTING higher taxes, also people used to have more common sense)
The world entering the iron age meant the plebes could easily get armed, and an unfair government with crushing taxes would simply get killed (like in France in 1789). I wonder why today governments are trying so hard to disarm the population? Probably just a coincidence.
Ancient Egypt near the end had taxes that could get as high as 60%. Huh with 25% corporate taxes plus 20% VAT plus 15% social contributions plus 10-50% income tax plus other taxes we're easily reaching that Egypt max and even going past it.
We do not have that much evidence of bronze age nations, but more recently we know that the American and French revolutions started as tax revolts against unfair privileged governments. Everyone knows this, it's clear, precise, not my opinion, unlike the subjective list Davos made on how civilizations end (link at the bottom of this article).
Inequality also allowed some ruling class to replace the previous one, like with the Caliphates for example.
The population was keen for a change of government.
These bronze nations with crushing taxes I mentioned could never grow very big and collapsed with the iron age (bronze weapons and armors were expensive and slow to make but not iron which allowed the peasants to get armed and not submit). Following their collapse large empires rose, such as the Roman and Persian mega-empires (at its height, 50% of the world population lived in the Persian empire, talk about a beast). Rome only had a 1% wealth tax from what I've read and did not over-rely on slaves. Rome lasted 1000 years and ended because of decadence. Obviously treating the population fairly (mostly with reasonable taxes, that's really all they care about), rather than a population that hates the rulers and would see foreign invaders as saviors, is what allowed these empires to grow and maintain their size.
Modern governments tricked the workers into thinking "only the rich pay" and playing this childish "divide to conquer" tactic, but everyone pays, and people over time slowly figure it out. Some extremely ignorant and stupid members of the population support 90% taxes. Never seen in history. Cool so a company hiring workers will have to charge $10,000 for them, pay $9000, and there's $1000 left as wage minus the owner margin with life being way more expensive (hiring a $2000 wage plumber would cost $20,000). In inflation adjusted terms if basic workers still get charged $3000, rather than getting a wage of $1500 they'll get 10% so $300, minus the boss margin. Brilliant! So they would be totally reliant on welfare. And what? Even more mad at companies that pay them a misery wage? And ask for even higher taxes? Lol how are they falling for this?
This explains why western government are doing everything to prevent people becoming their own boss, or they'd see it first hand.
3- Becoming too conservative
After the great plague this happened:
- MENA became ultra conservative, with Sharia law, and looking for the "return to the golden age". Still to this day they are primitive and ultra conservative. Iran had a ray of light of progress with the shah 50-60 years ago but it was short lived, the medieval backwards religious leaders quickly took over and imposed their rule of darkness.
- India well... They were 40% or more of world GDP before, and they dropped to some unbelievable low number like 1%. They roll themselves in cow dung and bathe in the radioactive Ganga river. And open defecate. The Maharaja and silk road traders would never believe this future. It's beyond, I'd cry if I was indian.
- China: I think most of the great wall was built by the Ming dynasty (1368–1644), or rebuild. They got into isolationist policies, got bureaucratic, corrupt and superstitious and stagnated at best.
- West Africa: At the hand of slavers with primitive superstitions I guess. China still has their bureaucrats. Maybe that's why Africa is so poor, they whole civilizations were centered around slavers, and now they can't do that, meanwhile China is still allowed to have its bureaucrats (some of it works for them it's too much that is bad).
- Russia: Became the third Rome. Went from an area of maybe 1-2 million square kilometer in east Europe and half of France population to this monster of 20 million square km and 3+ times France pop.
- West Europe: Age of Enlightenment, progress and so on. Unlike others that had an unfair ruling class (Brahmins/Priests in India, Slavers in Sahel, Bureaucrats in China, Samurais in Japan, etc), the West had a balance between the monarchy, merchants, warriors and priests. Wealth equality was way greater back then that it is today. Yes the industrial revolution was a big factor.
The conservative "civilizations" like China had contempt for the West, and saw them as irrelevant weirdoes. And then they went through centuries of humiliations and conquests by the West. To this day the (declining) West still makes 50% of world GDP.
A funny example is India in 1000 AD during the muslim domination. The superstitious ruling priests in the face of muslim invasions rather than use taxpayer money to build armies, built... temples... are you serious? Well it did not work.
Before that at the start of the iron age the old bible civs (Babylon, Assyrians...) that were ruled by corrupt and superstitious priests were wiped out by the mighty Persian empire, and Persians were so nice that people actually wanted to live there the priests had no chance of rallying the population and start a rebellion. As I explained in 2-.
Bruh: "Darius allegedly asked his satraps whether the tribute was not too high. When they said it was moderate, Darius ordered that they should pay only half as much.". Another version says he took taxes and returned half of it "back to the people" (tax returns?). The empire was at its greatest extent under his rule which was in the early days of it. He divided taxes by 2 and everyone wanted to join. You don't always need huge armies.
Unlike the modern west, Persia DID NOT PROVIDE AN "US VERSUS THEM" STORY. Can you imagine? A huge empire, and no divide. People actually enjoyed living there. No divide to conquer.
www.oxfordhandbooks.com
4- Becoming too reformist
The flip side of the conservative coin. Look at China with the cultural revolution. They went from what maybe 15% of world GDP to 1%, and they were the poorest country in the world.
Russia in the early 1900s was a big empire, the 4rth world economy (smallest than Canada today) and if their population bred like non communist countries (UK, France, Germany), they'd have a population of at least a quarter of a million, they'd probably be nearly as powerful as the United States.
The marxist reformists hurt Russia so much it's nauseating. They set them back at least a century. Yes there was technological and standard of living progress but of course there was! Even in Somalia. It's worldwide. It's like a super strong uptrend but within that worldwide uptrend they lagged behind.
The reformists have no moral boundaries and work to totally destroy the "old world" to reach their idiotic utopia.
These disgusting creatures are an absolute plague to humanity and set civilizations back centuries.
They love to destroy statues, change constitutions, send people to camps, burn books etc.
Hitler said about Christianity as "We have no sort of use for a fairy story invented by the Jews" and criticized its weakness compared to glorious islam, Catholics were sent to camps (especially Jehovah Witnesses) and moral standards went poof. Germany lost 1/3 of its territory, 15 million Germans were deported, West Europe stopped ruling the world, the USD became the reserve currency, and so on.
Communists are so evil and stupid they dried up the Aral Sea for their "great" irrigation projects, and destroyed entire forests.
The Aral Sea was one of history greatest environmental tragedies. The region economy was devastated, bringing unemployment and hardship, the sea life is gone probably millions of species went extinct, the region is a pollution disaster. And some extremely dumb celebrities (pleonasm) think communism is the solution to save the climate.
"There is so little confidence in Russia's economy that there are more Rubbles outside of it than inside" damn. How long for the confidence to come back? 100 years? more?
The Soviet Union (I quote):
- Destroyed every functioning social system in Russia in order to usher in their glorious revolution and utopia
- Artists were totally controlled
- The Church was wiped out
- The most productive and hardworking members of the population were killed
- The ruling class enslaved people in gulags
- Standards of living were lowered for faster industrialization and make it look like progress, like it was working
- Non Governmental organisations and clubbed were banned
- Labor Unions were banned (the irony)
- People that were 1 minute late to work were eliminated by the secret police, or people feared that was the case
- Makes me want to vomit
Societies are held together by structures such as religion, family, patriotism. The state is not intelligent enough to control and run everything.
The state tries to run the economy it's a catastrophe. The state tries to run a pandemic OH MY GOD. Anything they do is shit and vomit.
I'd say the state is not intelligent enough to not forget to breathe. Oxygen thieves.
The French revolution resulted in The declaration of human rights which says the government must be held responsible via violence if necessary, revolt is not a right but a duty. The Americans that wrote their Bill of Rights literally 6 months later have a similar thing with their amendments or something. Of course these sickening evil creatures that are not Politicians but demagogues with 0 convictions that only care about personal success and power and getting votes have used manipulation and brainwashing to get away with everything, cause great harm, and not get held responsible.
"Extreme reformers aren't smart enough to realize how dumb they are, thinking themselves geniuses (😆) and everything that's not under their control is an evil force that gets in the way of the great plan"
Today the west is obviously at risk. How big is this risk? I can't tell because this would get me mass reported and banned, and maybe even sent to jail. (That answers the question). I cri evertiem.
5- Decadence
Maybe the slowest way to end. How Rome ended but it was accelerated with decadence bringing in destroying armies (1-).
The 3 natural stages: Barbarism, Civilization, Decadence.
Greeks near the end (obviously) saw themselves as "above" earthly matters, and used slaves for work while they enjoyed themselves in "higher" ways.
In other words they were lazy bums that felt morally superior and selfish greedy perverts that took it easy. Disconnected from the real world.
A bit like modern westerners with robots and not wanting to work, and importing much of what they consume. And disconnected from reality, terrified of dying at 80, willing to ban hunting, and much more.
We see low birth rates (there are Roman and Greek texts complaining about this, and blaming the nobles for "having fun" rather than procreate, for "being eager to see their bloodline die").
We see low (or no) economic growth.
We see sexual perversions.
And so on, you get the picture.
An example is when germanic barbarians invaded roman south france (gaul), the local aristocracy claimed there was no danger, barbarian terrorists that cut heads off with massive axes were a tiny number of "lunatics" nothing to worry about and those that wanted to protect the region were far right islamophobes wups I mean germanophobes. The aristocracy smelled their own farts and were stuck inside their own heads and thought it was impossible for these third world barbarians to hurt in anyway their region. Morons. What options do the population have when the ruling class is useless? It's like cutting a serpent's head. Combine being useless to outlawing weapons and spreading propaganda to make sure "radicals" never gain power and you get an inevitable collapse.
So to conclude, you have all these ways for societies to collapse, once great civilizations vanish.
And today:
Point 4 => Who will seriously invest in Russia? So much for marxist progress.
Point 1 => Who will buy Iraqi Dinars or invest in Libya other than fools?
Point 3 => Who will invest in Iran? Who wants to invest in Afghanistan?
Point 2 => Who wants to invest in old Babylon and Egypt. Ye there are no recent examples.
Point 5 => Who wants to invest in the Nikkei 225 since 1990?
But there is 1 thing that survives all these collapses, that keeps its value: It's yellow and shiny 😉
The world economic forum made their own list of reasons definitely not biased, here is a link for a good laugh:
www.weforum.org

How I Use TradingView's Tools to Analyse Stock FundamentalsA short insight into the tools I use to check whether I am investing into a good company fundamentally. Here we look at EBITDA, Free Cash Flow, Price-Earning Ratio & Total Debt.
Please Like / Comment / Share this video with anyone that you think may find it useful.

21 Largest countries by total tradeA few things I notice:
Brazil has all the tools in its hands to, but it does not trade (it's rank 25 to 30).
AUD NZD are overrated (overtraded).
China way underrated but they are new, they were a tiny economy until recently following their cultural revolution.
Canada a bit overtraded but not a big deal.
CHF and USD seem overtraded but that's normal, Switzerland has all the banking and all the big trading firms, the US have the world intl currency (for now) and all investors in the world buy US stocks (for now).
Hehe Turkey is not even there, I think it trades around 400 billions just like Brazil & Australia.
Mexico has a weaker army than Singapore. They're 500,000 btw.
==> No wonder they have drug gangs patrolling the country in trucks with mounted guns and "make examples.
Not impossible drug cartel exports > The country exports.
Russia is a significant world player because of its army. Russia has some major obstacles to growth.
It is rekt by its no access to the world oceans.
==> "Fourteen percent of U.S. counties that are adjacent to the coast produce 45 percent of the nation's gross domestic product (GDP), with over three million jobs (one in 45) directly dependent on the resources of the oceans and Great Lakes.". "One of every 6 jobs in the U.S. is marine-related". "U.S. maritime transport carries 95% of the nation’s foreign trade". "More than 80% of the nation’s economy is supported in coastal states". It's that important.
Not a Russia expert (I don't even trade the Rubble) but I think this explains why Russia top 2 exports:
1- Mineral fuels including oil: US$141.3 billion (42.1% of total exports) - sent by pipelines.
2- Gems, precious metals: $30.4 billion (9%) - For very valuable goods higher transport costs aren't that big of a deal.
The strong army is strategic, it gives indirect advantages it is not just for conquering.
But about the conquering... They have the strongest land force in the world and should they just develop supertrains and anti ice ships or something?
Just give up on world waters? Even if the conquer east Europe they'd still be at the same point.
They're good at hacking for sure. And Yandex, VK, culture, video games... Historically they are an industrial power right?
They are Transitioning towards virtual which you do not need to put on a container ship.
Really not an expert as I said but this seems like common sense, and I'm paying attention from afar.
They've been bagholding attempts to improve the situation for centuries "never give up never surrender".
Either recreate some giant USSR (not going to happen) or cut losses and accept this weakness, develop other things.

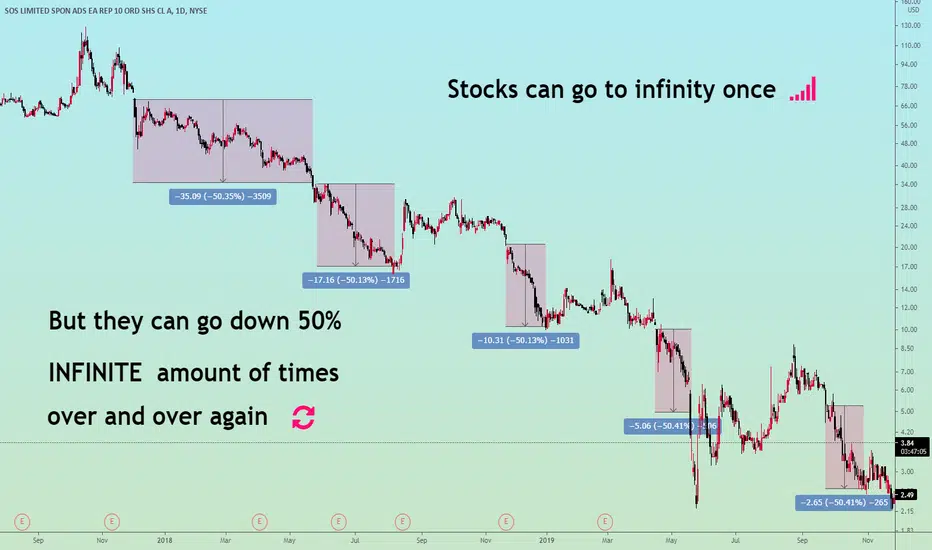
The Power of the Down-TrendStocks can go to infinity on the long side, but they can go down 50% infinite amount of times on the short side.
Never underestimate the power of the downtrend.
Cheap can get a lot cheaper.
Low can get a lot lower.
Go with the trend, the market is always right.
Some of Charlie Munger best savage momentsThe quotes with a bit more detail and context:
About active stock trading & related courses:
If you take the modern world where people are trying to teach you how to come in and trade actively in stocks. Well I regard that as roughly equivalent to trying to induce a bunch of young people to start off on heroin. It is really stupid.
And when you’re already rich to make your money by encouraging people to get rich by trading? And then there are people on the TV, another wonderful place, and they say, “I have this book that will teach you how to make 300 percent a year. All you have to do is pay for shipping and I will mail it to you!”
How likely is it that a person who suddenly found a way to make 300 percent a year would be trying to sell books on the internet to you! It’s ridiculous.
About boards of directors:
Buffett: I've been on 19 boards, and I've never seen a director to whom fees were important object to an acquisition or a CEO's compensation--members of compensation committees act like Chihuahuas, not Great Danes or Dobermans. I hope I'm not insulting any of my friends who are on compensation committees.
Munger: You're insulting the dogs.
About GME:
It's really stupid to have a culture which encourages as much gambling in stocks by people who have the mindset of racetrack bettors. And of course it's going to create trouble, as it did.
It's not generally noticed by the public, but clearinghouses clear all these trades. And when things get as crazy as they were in the event you're talking about, there are threats of clearinghouse failure. So it gets very dangerous.
"Free" brokers:
Robinhood and other brokerages catering to novice individual investors are really supplying “gambling services” and make money in a “dirty way,” Munger said, according to Bloomberg.
It’s most egregious in the momentum trading by novice investors lured in by new types of brokerage operations like Robinhood.
I think all of this activity is regrettable. I think civilization would do better without it.
No one should believe Robinhood trades are free. The frenzy is fed by people who are getting commissions and other revenues out of this new bunch of gamblers.
When you pay for order flow, you're probably charging your customers more in pretending to be free. It's a very dishonorable, low-grade way to talk.
Nobody should believe that Robinhood's trades are free.
On neo-liberal banking deregulations:
People really thought that giving a predatory class of people the ability to do whatever they wanted was free-market enterprise. It wasn't. It was legalized armed robbery. And it was incredibly stupid.
The whole world is better when you don't reduce engineering standards in finance. We skipped a total disaster by a hair's breadth.
I'm a big fan of the people who took us through the crisis. I'm not a big fan of the people who caused the crisis. Some of them deserve to be in the lowest circle of hell.
About Ethanol:
I think running automobiles on corn is one of the dumbest ideas.
Ethanol is quite possibly the stupidest thing ever invented by rational people. The ultimate social safety net -- which is a very good idea, by the way -- is cheap food, and ethanol production is destroying this. It was a monstrously stupid idea like I haven't seen before.
About Bitcoin:
It’s just dementia. And I think the people who are professional traders that go into trading cryptocurrencies, it’s just disgusting. It’s like someone else is trading turds and you decide, ‘I can’t be left out'.

Value vs Growth: Which strategy is the best?Introduction
Hello trading-view! This post aims to find out which trading "technique" is the best; looking for undervaluation or looking for consistent and rapid earnings growth. If you just want an answer skip ahead to the end, but stick with me to get all the information concerning my decision, the advantages and disadvantages each strategy has, as well as a quick summary of both.
------------------------------------------------------------------------------------------------------------------------------------------------------------------------------------
Value: core principles
Value investors aim for the bigger companies that experience a period of unpopularity among the overall public. The bad news each stock has shouldn't be large enough to permanently damage the reputation of the company, halt it's progress for an extended amount of time, or do any lasting destruction. Metrics such as the PE ratio and the PB ratio can help find these stocks. For example; CFG is a bank stock that had plummeted as a result of the Covid 19 pandemic. It's financial were decent, it was undervalued, and overall a solid investment that has increased 39% since I first noticed it. With a market cap of now 16 billion dollars, it isn't a small company either, and shows just how effective this method of picking stocks can be.
------------------------------------------------------------------------------------------------------------------------------------------------------------------------------------
Growth: core principles
Growth investors aim for the exact opposite kind of stock as value investors; small companies that are in a period of unusual growth and popularity. Rising earnings and sales are characteristic of such companies, as well as a consistently high PE ratio. One example of a growth stock (that most people should know about at this point) is tesla, the Elon Musk owned EV maker. Since the beginning of 2020 the price of one share has skyrocketed by 850%, a textbook example of a company with strong public support, room to grow, and rising earnings/sales.
------------------------------------------------------------------------------------------------------------------------------------------------------------------------------------
Value: Advantages/Disadvantages
Advantages
1. Not very risky as long as the issues with the company aren't very big.
2. Value investing mutual funds have, over the long run, beaten out growth stock mutual funds, giving it the historical edge.
Disadvantages
1. Returns may take a long time to materialize depending on when a company becomes favored by wall street again.
2. The returns are less the vast majority of the time, since you are aiming to sell at or slightly above true value, while growth investors want to sell very much above the true value.
------------------------------------------------------------------------------------------------------------------------------------------------------------------------------------
Growth: Advantages/Disadvantages
Advantages
1. The profit potential is greater when growth investing, and extreme spikes to the upside are not unheard of (again, look at tesla and other companies like it).
2. It normally takes less time for profits are realized, although nothing is guaranteed.
3. There certainly isn't a shortage of small companies with room to grow.
Disadvantages
1. If your stock falls out of favor, the value of your holdings may fall as well.
2. Growth investors face high risk and can lose money easily on failed start-ups.
------------------------------------------------------------------------------------------------------------------------------------------------------------------------------------
Which is the best?
Everything depends on you. If you want a *relatively* stable source of income with *relatively* low risk, then you should choose value investing. If you want to be speculative and make more on any one trade, then growth investing is right for you. In the end, there is no one strategy that is the best for everyone; some will like value, and some will prefer growth. Links are down below if you want more in depth explanations of what growth and value investing is, and I will post again soon. Good luck and great trading everyone!
*not financial advice.

Value investing toolkitHello Investors! This educational post is about my toolkit developed for filtering out the almost perfect applicants for further analysis and research in the light of the principals of value investing. The work is based upon Warren Buffett's principals, calculations and recomendations.
After publishing my two previous posts on the "Value investing chart set" and the "Intrinsic value calculation" I have received a lots of positive comments and feedbacks. Alongside the encouraging comments I have received quite a lots of requests to share the chart layout and the other scripts I am using while compiling the chart set I have introduced. I have promised to further develope both tools and come up with an even more powerfull toolkit.
Now it is here! :-) I have combined the already published Intrinsic value calculation script with the Value investing chart set and further developed both on the way! This setup now is way more powerfull and exciting and is loaded with features as described below.
First of all: here is the public link to the shared chart layout setup: www.tradingview.com
Which company could be more adequate for the introduction of a value investing toolkit than Berkshire Hathaway, the company of Warren Buffett? It is not just an honor to use this ticker for educational purposes but aparently -as you can see during the analysis- it makes a perfect long term investment! What a surprise, right? :-)
Here I will only explain all the new features of this chart as there is a very detailed explanation of both the Intrinsic value calculation script and the Value investing chart set in those two posts. You can find the links for them below.
SO! Obviously the biggest developement is poping into your eyes right away: I have programed a value investing analysis tool into the chart so whenever you enter a ticker, the toolkit will supply you with an instant assesment on the given ticker. Of course it is a very basic tool and can only supply you with a preliminary overview on the company and does not, in any way substitute detailed and troughly research before you make any investment decission!
- The assessment is based on the principals Warren Buffett, Ben Graham layed down. Some of Peter Lynch's work has been used, too.
- The tool is using a rather conservative approach as the main goal is to maintain the capital invested and only additional to that to produce adequate gain on the long run
In general: if you see a green labell with the text 'Possible subject for firther research' than you have found a company which passed a conservative test and is worth for further study. Needless to say that if you see a red label with the text 'XX NOT RECOMENDED XX' and a bunch of reasons below, why (overvalued - overpriced - debt risk) do not rush to your broker to put your life savings on it.
To give you an example, here is how Google is evaluated today:
In order to get the green light a company has to meet the following, rather strict criterias:
- Valuation: The current price of the stock has to be below the Intrinsic value. (In this case $224 closing price vs. $426 for the Int. value) This line will precisely tell you how far the price is from the Intrinsic value, in other words, it will tell you your margin of safety when investing to the company on today's price level. In this example it is 90%
- Pricing: The close price has to be below the "Buffetts limit price" indicator. To make it short Graham and Buffet stated that the number you get when multiplying the Price to Earnings (P/E) ratio with the Price to book (P/B) ratio has to be below 22.5 in order to consider the given share cheap. This line will tell you how far the price is from the Buffetts limit price. This case it is 61%. ($224 vs. $361)
- Debt risk: The company has to have much less debt than equity in order to qualify for long term value investing. The limit here is 1, meaning that the company has to have more equity than total debt. If this is not the case, the company fails the test. (This can be taken a little flexible as certain industries, like banking and insuarance by definition deploy a lots of debt instruments without risking their long term profitability or sustainability) In the example of Bershire this is 0,27 meaning that Berkshire has more than 3 times more equity than debt which is needless to say a more than perfect setup. (What do we expect from Mr. B, right?)
These are the first 3 deciding criterias where a company can fail the test. Any of those turn to be out of range, you will get a red labell with a big fat NO recomendation. And most of the time this is going to be the case...
As for the other points you will get more inside peek into the state of the company:
- Price/book: this line will tell you if the price is still below the 1.5 times book value point. This is the highest price what value investors find comfortable paying. If the P/E value is very low for the share you might run into a situation where the Buffetts limit (P/E times P/B) is still low (below 22,5) but the stock is rather overpriced.
You will not get a red labell here, only a 'Caution' warning and a grey label, instead of 'GOOD!'
- Earnings: you will get an opinnion on the earnings here. The main criteria to get a 'GOOD!' evaluation is to have a growing level of EPS in the last 5 years.
- Revenue: It is very important to invest in a company which is able to grow it's revenues steadily. This line will analyse that and will tell you if it wouldn't be so.
- Profit & loss: Although it is not a deciding factor but a value investor should avoid investing to companies that were producing losses in the past decade or so. This line examines the last 5 years in this respect.
- Dividend: The one and only point where Berkshire fails the test! :-) As Warren Buffett used to say: I am not paying income tax, Berkshire doesn't pay dividend... :-) Poor guy! Since we are investing for a very long term it is imperative that we top the gains we might have over the years with the 3-4% dividend p.a. As you can see here, there is a Warning! comment should the company fail in paying dividend.
- Number of shares: Here you will see a quick analysis on the share buyback habits of the company/management. Again, what we examine here is wether the number of shares outstanding is less than 5 years ago or more which means that the company is buying back it's shares thus help investors to maintain equity.
So entering your choosen ticker you should have an instant overview if the company can supply you with the value investing criterias or fails in this field.
One very instructive exercise is to click through the leading blue chip stocks with this valuation toolkit and see how hugely overvalued they are at the moment.
Some further developements I made in the mean time:
- I have automated the calculation of the book value growth with finding the very first data point regardless when it happens. In this way you do not have to enter any parameter and you can simply click conveniently from one ticker to the other without reentering the needed inputs. Hopefully it doesn't matter which pricing structure you are in at TradingView. Free acounts will use 5 years data.
- I have included a 4th pane just below the main pane. This shows the revenue of the company in 3 way: the white line is the anual values, the grey line is the quarterly data and I have also added the red line showing the TTM (trailing twelve month) figure in order to visualise the very recent trends in the revenue of the company.
- The same way I have added the TTM figure on the lowest pane to the EPS figure, for the same reasons.
- I have added explanatory labells to the right of the charts showing the actual value of the indicators, like the Intrinsic value, Buffetts limit, and book value.
- Should either the Book value or the EPS figure be negative for the current year the script will issue a red label without any data regardless the other values as the Buffetts limit can not be calculated. (Negative numbers does not have square roots and that is required to calculate the limit price back from the P/E and the P/B values)
One final remark: this toolkit is as complete as my knowledge is about value investing. It is a purely educational tool, not in any way intented to be investment advice. I do use this tool and for instance I do have position in this example company Bershire Hathaway at the time of writing this post. You have to make your own research and decision when it comes to investing your money.
For further explanation on the Intrinsic value calculation please check my earlier post here:
For further explanation on the Value investing chart set please check my earlier post here:

Value investing chart setI would like to share the set of charts I use to find and analyse candidates for value investing.
It is a rather dense and telling setup where you can find a lots of information. Please allow me to explain them one by one.
(The chart is made on the company Nippon Tel. It is not a recomendation for anybody to buy Nippon Tel, I use this chart for educational purposes only)
So: what can you see in this chart? A LOT! You can, in a glance asses if a company would qualify for value investing or should be avoided. From bottom up here are the panes, charts, indicators explained:
There are 3 panes in this setup.
In the lowest pane you will find the dividend information. There are 3 indicators telling a lot about the company's endurance and discipline. We can see that in our example
- the company has never been missing a dividend payment over the last 15 years (even during the 08 crisis)
- the company has been constantly raising the dividends over the last 15 years
- the company has made an ever growing diluted EPS (earnings per share) over the last 15 years
- the investment in the current price levels would yield 3,69% (bottom right scale)
- the company has been very disciplined to pay out about 50% of the earnings per share and retain the rest within the company resulting growing book value
In the middle pane you can see the net income (green territory) of the company and the number of common shares outstanding (blue line). We can see that in our example
- the company has been constantly making profit over the last 15 years (even during the 08 crisis)
- the company constanly buying its shares back thus helping the existing shareholders to keep/grow the equity per share
Now the top, main pane tells the most about the company and its share. Here is what you can read from this chart:
- the yellow line will show the Debt to Equity ratio
What this is telling you is that the company is ran by vigiliant leaders who are keeping a close eye on the company's long and short therm debt and resist the temptation of today's really cheap loans. As Peter Lynch use to say: it is almost impossible to go bankrupt for a company without excessive debt. The ratio Ben Graham and Warren Buffet (also Peter Lynch) finds healthy here is a 1 to 2 debt to equity ratio. In other words, it is assuring if half of the equity covers all the debt of the company.
In the case of our example the current value of this ratio is 0,415 which is a very good level of debt. (Industry specific figure!) The company has been constantly paying it's debt back over the last 15 years and although the figure has been growing during the last 2 years it is still under a acceptable level.
- the light brown line is the book value or the shareholder1s equity per share
Needless to say the for a value investor it is imperative that the book value is steadily growing, just like in our example from 8,8 to 21. What is even more important is that the current price is below the book value per share or in other words a buyer in these price levels gets a 1 on 1 value for his bucks. Just to give you a comparison: today this value for Apple (AAPL) is 30 to 1! So you pay $ 30 for $ 1 of equity when you buy Apple stock.
In our example the book value of this company is steadily growing and the price is currently below the book value.
- the pink line on the pane is my "invention" as this is the intrinsic value graph which is calculated by the script I have posted already here. I would not explain in details here, please check out my post and all the comments below it for details.
This line shows you what would be a fair value of the stock if you take all the dividends and the book value growth that will happen in the next coming 10 years and discount it back to today's value using the 10 years US Note's yield. This is called the intrinsic value of the company and calculating it is rather art than science, says Buffett.
In the case of the example company the Intrinsic Value is around 43 while the price is a bit above 20 which means that a value investor has a 100% margin of safety when buying this stock.
- the green/red line is another calculated line: Warren's limit price
Ben Graham and Warren Buffett uses a rule of thumb saying that the PE (price earning ratio) multiplied by the Price to Book ratio can not result a higher value than 22.5 to be considered a cheap stock. Here I use the Diluted Earnings figure to calculate the PE ratio to take all the convertible securities (options, prefered stocks, warrants, etc) into consideration.
This line shows if the stock can be valued as cheap or overpriced.
In the case of our example the current price is under the limit price and can be considered an underpriced stock.
As you can see there are lots of fundamental informations you can visualise and asses with this chart setup in order to pick your winning stocks for value investing.

How to chart financials for any companyThis chart shows some key financial metrics for Netflix. We're using the multi-chart layout feature to show the following financial situation:
1. Netflix Quarterly Revenue
2. Netflix Cash & Equivalents
3. Netflix Total Debt
4. Netflix Forward Price-to-Sales ratio
With the financials feature on TradingView, we could chart a lot more than this. Including EPS, R&D, PE ratio, EBITDA, Market cap, and more. We wanted to share this layout with you to demonstrate what's possible. Whether you're a value investor or a short-term trader you can chart the financial situation for a company to better understand the fundamentals that are driving price or telling the story behind a particular asset.
For example, Netflix's cash is growing and so is Netflix's revenue. But this chart layout shows that it's not all good news. Netflix has taken on some massive amounts of debt. Debt continues to rise as content becomes more expensive. This post is not investing or trading advice, instead it is educational. As a TradingView member, this data is available to you right now. You can examine the financial situation for Netflix or other companies.
To get started, click the Financials button located at the top of your chart. The Financials icon looks like the bar chart 📊 emoji. Once you've opened the Financials menu, you can sort by Income Statement, Balance Sheet, Cash Flow, and Statistics. You can also use the search field to find specific financial metrics that are relevant to you.
Before you head to the comments to leave a positive review with some interesting feedback 😁, we have a few more tips to share:
1. When you open the Financials menu, you can hover your mouse over a Financial metric. To the far right of that metric select either Quarterly or Annual. Quarterly will show you the numbers a company reported every 3 months or quarter and annual will show what a company reported every 12 months or full year.
2. For other financial metrics, when you hover your mouse over them, to the far right you will see a question mark icon appear. You can click this question mark to get a definition for that specific financial metric. So if you ever need to learn something new, it's just one click away. Below we've shared some examples:
Price to Sales Ratio
Research and Development
Basic EPS
Free cash flow
Enterprise value
Thanks for reading and following along. If you have any questions or comments, please write us below. You can also leave feedback or product requests. Our team is listening! 💙

HOW TO BUY & SELL GOLD : Part1🏅 CFDS VS ETFS 🏅
➡️ GOLD ETFS (Right Chart)
ETFS PHYSICAL GOLD (ASX:GOLD) offers low-cost access to physical gold via the stock exchange and avoids the need for investors to personally store their own bullion.
Each GOLD unit comes with an entitlement to an amount of "physical bullion". This means : Real Gold, Real Bars.
⬅️ GOLD CFDS (Left Chart)
CFDs on GOLD US$/OZ (TVC:GOLD) (OANDA:XAUUSD)
CFD stands for Contracts for Difference, with the difference being between where you enter a trade and where you exit. Simply put, when the position is closed, you’ll receive the profit or incur the loss on that difference. When you trade a CFD you’re speculating on the movement of the price only, rather than traditional stocks where you purchase a physical asset. You do not ever own any real gold bars.
🤓 CFD TRADE EXAMPLE
The price of gold is measured by its weight. Therefore, the price shows how much it costs for one ounce of gold in US dollars. For example, if the gold (XAUUSD) price is $1600.00, it means an ounce of gold is traded at US$1600.00. Similarly, the price of silver is its price per ounce in USD. If the silver (XAGUSD) price is 28.00, it means that an ounce of silver is traded at US$28.00.
If you have bought gold for $1600, you do not have an ounce of gold that you can hold, but you rather have the obligation to buy XAU at US$1600. When you close your position, you sell the XAU and close your exposure. If you sell it for $1605.00, you have made profit of $5 for every ounce (unit) of gold in your contract. The same concept applies to silver trading. If you have bought silver (XAGUSD) for $28.00 and sell at $28.50, you would have made a profit of $0.50 for every ounce of silver in your contract.
🤔 WHY TRADE CFDS?
If you’re looking to invest in the price movements of instruments, rather than purchasing physical assets
To take advantage of swift fluctuations in the underlying instrument or security. This is popular with short-term investors looking to profit from intra-day and overnight movements in the market
To take advantage of leverage and spread capital across a range of different instruments rather than tie it up in a single investment (note: this approach can increase risk)
As a risk management tool to hedge exposure

Is it cheap? Why "dilution" is a concept you NEED to understandMany newbie investors get in trouble because they don't understand the relationship between share price and share count. If you're new to investing and you've never heard of "dilution," it's very important that you keep reading this post.
If I look at a standard chart of Spirit Airlines's share price, such as a upper chart above, I might conclude that the stock is cheap right now. Spirit shares are trading well below the price they've traded at for the last five years.
This is an illusion. The valuation of a company is its share price times the number of shares outstanding. When a company runs low on cash, it sometimes issues and sells new shares. This "dilutes" the ownership percentage of existing shares.
Imagine I have a pie, and I've invited you and two other people over for a piece. We're each going to get a quarter of a pie-- a really big slice! But then you decide to invite a friend. The size of the pie doesn't change, so now we have to cut it in fifths so your friend can have a slice. Each of us will get a smaller piece.
Issuing new shares works the same way. Since the beginning of the Covid-19 pandemic, Spirit Airlines has issued 29.14 million new shares, increasing its share count by 42.5%. That means that each share now represents a much smaller proportion of the company than it used to. The shares have been "diluted."
Because of dilution, looking at a chart of the price of a single share doesn't tell you how "cheap" or "expensive" a company is compared to its historical valuations. Fortunately, there's a quick and easy way to chart a company's actual valuation.
Share price multiplied by shares outstanding equals the company's total price tag, its "market capitalization" or "market cap." To chart market cap on TradingView, find and click the button labeled "fundamental metrics for stocks" at the top of the chart. Type "market" in the search box, and TradingView will narrow the list of metrics down to the one you want. Clicking on "market capitalization" will add a time series of the stock's market cap to your chart.
When we look at market cap for Spirit Airlines, it doesn't look cheap anymore. Spirit is trading within its price range of the last four years, even though the company is now financially worse off in every way. With earnings negative and sales nearly cut in half, Spirit is priced as if the pandemic had never happened. By charting market cap, you've adjusted for dilution and gained a much better understanding of the asking price.

What is Value Investing? (Value Investing Tutorial)Intro:
Value investing is an under appreciated form of investing, so much so that, in some places, people call it “dead”. This is far from the truth, and in reality, value investing provides great returns for patient investors. Read on to find out just what it is, how to find value in a company, and how to differentiate value plays from value traps.
——————————————————————————————————————————————————————————————
What exactly is “value investing”?
Value investing is simply the buying of companies (or securities) that are priced below their fair value and the selling of those companies when they become priced above their fair value. A very simple concept to understand, and an effective one, considering it’s rewarded legendary investors such as Benjamin Graham and warren buffet the gift of financial freedom (warren buffet is currently the fourth richest person in the world, and was the richest at one point. I also recommend “the intelligent investor” by Benjamin Graham to anyone who wants to learn how to fully master value investing). The only difficult thing is the execution of this strategy, which a surprisingly large amount of people get wrong.
——————————————————————————————————————————————————————————————
How do you value a company?
You can value a company in many ways, but the two simplest metrics I found that immediately tell you whether or not a stock is under or overvalued are the PE and PB ratio. The PE ratio is the one I expect most people to know about, and it measures the price of a companies stock relative to its EPS (earnings per share). A rule of thumb is any PE rating below 15 indicates a buying opportunity for the value investor (when paired with other metrics), and any PE rating above 25 indicates a selling opportunity (when paired with other metrics). However, other strategies have different rules (growth stocks nearly always have a high PE ratio since you are paying a premium for their higher rates of growth), but for value investing that is the rule. Moving onto the PB ratio, or the price to book ratio, it measures the stock price relative to the book value of the company per share. The rule for this metric is any rating below 1 is a indicative of undervaluation, and any rating above one is indicative of overvaluation (which deep value investors avoid buying into at all costs).
——————————————————————————————————————————————————————————————
What differentiates a value play from a value trap?
Value plays are true value stocks that have good balance sheets (little debt in proportion to equity, more assets than liabilities, and positive net income) and are relatively large companies (10 billion dollars and up is best, but if you find an opportunity at 2 billion, then go for it. Nothing below that, though). Value traps are fake value stocks that have some of the same attributes as a value play (like low PE and PB ratio’s) but are down for a larger reason other than being unpopular (like looming bankruptcy, negative net income, and unlawful business practices). These can be avoided, however, by doing thorough research into a company, and it’s something every long term investor should do anyways.
—————————————————————————————————————————————————————————————
Final thoughts:
Value investing is a potentially lucrative trading strategy, but it does have one major downside. Any stock a value investor buys could take years to become overvalued, and so it isn’t for people who will need the money in the foreseeable future. For those, I present growth investing, which I will do an educational post on soon. It makes as much sense as value investing (in that trading strategy you invest in companies which have had growth for the past 5-10 years) and returns take a shorter time to materialize, although it can still take awhile. Anyways, I hope you enjoyed this insight into value investing, and will do more research into the strategy. Good luck and great trading!

first test run: psychological effect range theory applied to fibMost things are written on the chart. I have hidden the reference fib itself as it is specifically edited for a certain purpose, but I base it on the psychological effect range theory (should be easy to figure out my methodology just knowing that) as well as the silver ratio for highs rather than the somewhat misused golden ratio (it's not really that prevalent in things, but... the silver ratio is). If it pans out I will show it perhaps
If you are not familiar with the silver ratio it is 1+sqrt(2), or 2.4142~. It is an irrational number. It is an infinitely descending series of 2 + 1 over itself. i.imgur.com image so it makes more sense
First we need to know why fib is naturally flawed (a fib haha!) as a tool. phi (yawn trdvw wont let me post the greek letter), phi = 1 + sqrt(5) / 2. Now, this seems to be too complex needlessly to me. Nature is simplistic in its foundation, but simple in its own way. It is highly irrational when it begins to contend with shapes that are not squares. A circle by definition is irrational, since it is made of an infinite number of angles, and this concept is best described as an o.
But regardless of how people talk about it it's not proven in any measure to be truthful, BUT can be used it certain ways to frame one's set of planning, better than no planning and all.
so what makes more sense for a deterministic chart
1+sqrt(5)/2 or 1+sqrt(2)?
trick question, neither does.
However, I am using it as my upper range in regards to the fib retracement tool. It is the 'end goal'- of the bull run. this happens to be 25k, if you don't zoom around the chart. the first target, however, is the sqrt(2), 1.4142. that's at 20,400, and completely reasonable to blow past should the psychological barrier of 20k (which is 2/3rd of the way from the line below sqrt(2) and the previous line, btw).
There is the math behind the levels being picked, but really, the concept underlies effect range theory, in that most people tend to over or underreact to situations, and if in a median approach, tend to end up in another one before too long.
The trend sections on my (not shown, but published privately yesterday for honesty's sake) chart show the channels of interest mostly lining up with profit/loss; if a range is being overused, it won't want to stay in that range, otherwise what's the point? you're trading the same amounts for the same amounts.
I am rather new to financial markets but not new to analysis so I welcome anyone who can lead me to those that already decided/figured some of these out. I am still studying and trying to learn.

The major Exchange Traded DerivativesChina continues to privatize companies, open its markets to foreign investors, and develop relations around the future silk road.
In 1 month China is launching its international Copper future. It sounds interesting but I do not know if individual investors care enough for this future to be available with my broker, maybe IG will have it.
As the USA declines (and perhaps Europe), China might become the "hub" for commodity derivatives (thinking of industrial metals and agri),
if this is the case I expect retail traders and their brokers to catch up in only a decade or two (seriously).
For this occasion let's look at the most traded derivatives around the world.
1- Agriculture
*It is a non-profit, self-regulating and membership legal entity established on February 28, 1993 (when China opened itself to the free markets and emerged out of poverty). Non-profit because that's evil capitalism. Nothing is free though. So who pays? The average chinese factory worker? Haha!
Back in 2018 they started opening up to foreign investors (Iron Ore, a little after their Oil contract that was the first one ever open to foreigners), the exchange also has an english website:
www.chinadaily.com.cn
**The Zhengzhou Commodity Exchange (ZCE) is China's first futures exchange,
Zhengzhou Airport Economy Zone is China's first Airport Economy Zone.
Zhengzhou is not a SPECIAL economic zone, it is only an economic zone.
Unsurprisingly China is not big on "financial" products (interest rates & equity index) but they are big on more basic things: Agriculture & Mining.
2- Energy
So ye Moscow, NYMEX (CME), and London ICE mostly.
3- Metals
4- Equity Index
How many contracts would you want? Yes.
India and Brazil are at the top of the list.
India is famous for its overvaluations and many gambling bagholders, and Brazil for its large numbers of gambling day traders.
Stocks and stock indexes (and ETFs) have by far the most individual investors, as those are supposed to be more noob friendly due to having a much lower skill floor.
Think of it (lol players) as Yasuo, Master Yi and Volibear mains. For HOMM the equivalent is 3 months afk farm Necro on a giant map.
They have been convinced that it was a positive sum game where everyone can make easy money.
There are 2 major categories of retail investors: bagholders & day gamblers. They both consistently lose.
Due to the power of compounding day gamblers lose money much faster than bagholders, which is why people advise individual investors to stick to bagholding.
Bagholding also gives people more time to think it through and quit with some of their money left, while day gamblers will have lost most of their money before the initial excitement has waned off.
5- FX
6- Rates
7- Other
No idea what all of this mess is.
For my part I only trade a couple of those: 3 grains, 2 metals (Gold Copper), Texas Oil & NatGas, all on the CME (7 total, with some correlations).
Sometimes I look at softs on the ICE and Nickel on the LME but I don't really touch them much.
Rarely will get into indices, I do follow where they are going from far away.
I actually am active in the smallest derivatives that make 7.4%, 5%, 4.9%, 1.6% and 1% while avoiding equities that make 50% :D
But I do Forex alot, got around 10 currencies in my watchlist. With correlations and everything I would say FX is about twice to thrice as big as commodities for me.
There is already plenty to do and plenty of good uncorrelated opportunities to go for. With on top of that the occasional Bitcoin or major indice or stock bet, I'd say that's about as far as someone can push it with just being coinflipping.
I know that professionals hold stocks for quarters or years, Forex for a few days or a few weeks, retail just day trades everything, and I do not know for indices and commodities and rates. But I know commodities sort of behave much more like FX than equities and open interest fluctuates similarly so I would say we are looking at weeks to month in my opinion, for professionals of course, retail just day trades everything they'd day trade overnight swaps and EOD indexes if they found a way.
There are alot of those futures. More than enough to have your hands full. Might have some bubbles in China in the future and if this is the case I'll be the first to know way before mainstreet gets all excited and rushes in at the top (and push it higher) as they often do.
In July 2019 ZCE Apples (bigger than CME Corn) gapped down by 40%. I am not ready for this. Unless they have some "fair and profit-free" options :D
I wouldn't mind getting some surprise 40% infinite gains with tiny limited losses. I guess they are not big on "evil profit driven too abstract for me to understand" speculation.
Haha so how are their behinds after that 40% gap with no speculator to absorb the risk? 😉
There HAS to be broken flaws to exploit in the future. Maybe when that happens they will rollback all trades "for fairness" silly commies.
Well too early to tell, we will see.
