AI Breakout Bands (Zeiierman)█ Overview
AI Breakout Bands (Zeiierman) is an adaptive trend and breakout detection system that combines Kalman filtering with advanced K-Nearest Neighbor (KNN) smoothing. The result is a smart, self-adjusting band structure that adapts to dynamic market behavior, identifying breakout conditions with precision and visual clarity.
At its core, this indicator estimates price behavior using a two-dimensional Kalman filter (position + velocity), then enhances the smoothing process with a nonlinear, similarity-based KNN filter. This unique blend enables it to handle noisy markets and directional shifts with both speed and stability — providing breakout traders and trend followers a reliable framework to act on.
Whether you're identifying volatility expansions, capturing trend continuations, or spotting early breakout conditions, AI Breakout Bands gives you a mathematically grounded, visually adaptive roadmap of real-time market structure.
█ How It Works
⚪ Kalman Filter Engine
The Kalman filter models price movement as a state system with two components:
Position (price)
Velocity (trend direction)
It recursively updates predictions using real-time price as a noisy observation, balancing responsiveness with smoothness.
Process Noise (Position) controls sensitivity to sudden moves.
Process Noise (Velocity) controls smoothing of directional flow.
Measurement Noise (R) defines how much the filter "trusts" live price data.
This component alone creates a responsive yet stable estimate of the market’s center of gravity.
⚪ Advanced K-Neighbor Smoothing
After the Kalman estimate is computed, the script applies a custom K-Nearest Neighbor (KNN) smoother.
Rather than averaging raw values, this method:
Finds K most similar past Kalman values
Weighs them by similarity (inverse of absolute distance)
Produces a smoother that emphasizes structural similarity
This nonlinear approach gives the indicator an AI feature — reacting fast when needed, yet staying calm in consolidation.
█ How to Use
⚪ Trend Recognition
The line color shifts dynamically based on slope direction and breakout confirmation.
Bullish conditions: price above the mid band with positive slope
Bearish conditions: price below the mid band with negative slope
⚪ Breakout Signals
Price breaking above or below the bands may signal momentum acceleration.
Combine with your own volume or momentum confirmation for stronger entries.
Bands adapt to market noise, helping filter out low-quality whipsaws.
█ Settings
Process Noise (Position): Controls Kalman filter’s sensitivity to price changes.
Process Noise (Velocity): Controls smoothing of directional component.
Measurement Noise (R): Defines how much trust is placed in price data.
K-Neighbor Length: Number of historical Kalman values considered for smoothing.
Slope Calculation Window: Number of bars used to compute trend slope of the smoothed Kalman.
Band Lookback (MAE): Rolling period for average absolute error.
Band Multiplier: Multiplies MAE to determine band width.
-----------------
Disclaimer
The content provided in my scripts, indicators, ideas, algorithms, and systems is for educational and informational purposes only. It does not constitute financial advice, investment recommendations, or a solicitation to buy or sell any financial instruments. I will not accept liability for any loss or damage, including without limitation any loss of profit, which may arise directly or indirectly from the use of or reliance on such information.
All investments involve risk, and the past performance of a security, industry, sector, market, financial product, trading strategy, backtest, or individual's trading does not guarantee future results or returns. Investors are fully responsible for any investment decisions they make. Such decisions should be based solely on an evaluation of their financial circumstances, investment objectives, risk tolerance, and liquidity needs.
Bands and Channels

Trend Buy/Sell Fibonacci Range - KLTThe Trend Buy/Sell Fibonacci Range – KLT indicator identifies bullish and bearish trends based on where the closing price is located within a Fibonacci range calculated from the last N candles (default is 10). Instead of analyzing individual candles, this tool takes a broader view of price action using Fibonacci retracement levels across a dynamic multi-candle range.
How It Works:
Range Calculation
The indicator calculates the highest high and lowest low over the last N candles to define the active price range (default: 10 bars).
Fibonacci Levels
Within this range, Fibonacci levels (0.236, 0.382, 0.5, 0.618, 0.786) are dynamically computed. These levels act as internal thresholds to evaluate bullish or bearish pressure.
Trend Identification (via Close Position):
If the closing price is above the 0.618 level, it indicates strong buy pressure → the candle turns green and an upward triangle appears.
If the closing price is below the 0.382 level, it suggests strong sell pressure → the candle turns red and a downward triangle is displayed.
If the close lies between 0.382 and 0.618, the market is considered neutral, and the candle is gray.
Visual Elements:
Colored candles to immediately spot trend conditions.
Triangle signals (optional) for clear Buy/Sell markers.
Fibonacci level lines plotted on the chart for full context (can be toggled on/off).
Customization Options:
Lookback period (number of candles to calculate the range)
Fibonacci threshold levels (upper/lower)
Show/hide arrows and Fibonacci lines
Why Use This Indicator?
This tool is perfect for traders who want a simple visual method to assess trend strength based on price structure, not indicators derived from lagging moving averages. It offers:
Cleaner market structure analysis
Objective trend zones
Customizable sensitivity
Recommended Use:
Works well in conjunction with support/resistance zones, volume, or momentum indicators.
Applicable to any asset class or timeframe.
Credits:
Developed by KLT, combining structure-based logic with Fibonacci precision.

VPT Ribbon (Fixed V6-Compatible)A visual ribbon of EMAs (Exponential Moving Averages) applied to the Volume Price Trend (VPT) line.
It helps you see volume-backed momentum trends — not just price.
---
📈 What VPT Does:
VPT = cumulative sum of (volume × percentage price change)
It rises sharply when price increases on high volume = strong buying
It falls when price decreases on high volume = strong selling
Flat movement = low conviction
---
🧠 What the Ribbon Shows:
Each line in the ribbon is an EMA of the VPT line, colored like this:
Color Meaning
Green shades Strong uptrend supported by volume
Lime Early signs of weakening or pause
Orange Neutral to bearish transition zone
Red shades Strong volume-backed downtrend
When the lines spread and point upward → strong bullish volume momentum.
When the ribbon compresses or flips down → weakening or bearish trend.
---
✅ How to Use:
Observation Interpretation
All EMAs rising + green tones Bullish volume trend
Ribbon narrowing + lime/orange emerging Caution – possible reversal or slowdown
Red tones + EMAs turning downward Bearish volume momentum

Khalid's Custom Forecastthis is very very improved indicator for daly trading .
please analysis and note the S & R
DA Cloud - DynamicDA Cloud - Dynamic | Detailed Overview
🌟 What Makes This Indicator Special
The DA Cloud - Dynamic is an advanced technical analysis tool that creates adaptive support and resistance zones that expand and contract based on market volatility. Unlike traditional static indicators, this cloud system "breathes" with the market, providing dynamic levels that adjust to changing market conditions.
📊 Core Components
1. Multi-Layered Cloud Structure
Resistance Cloud (Red): Three dynamic resistance levels (RL1, RL2, RL3) with intermediate channels (RC1, RC2)
Support Cloud (Green): Three dynamic support levels (SL1, SL2, SL3) with intermediate channels (SC1, SC2)
Trend Cloud (Blue): Five trend lines (TU2, TU1, TM, TL1, TL2) that flow through the center
Confirmation Line (Purple): A fast-reacting line that confirms trend changes
2. Forward Displacement Technology
The entire cloud system is projected 21 bars into the future (Fibonacci number), allowing traders to see potential support and resistance levels before price reaches them. This predictive element is inspired by Ichimoku Cloud theory but enhanced with modern volatility dynamics.
🔬 How It Works (Without Revealing the Secret Sauce)
Volatility-Responsive Design
The indicator continuously measures market volatility across multiple timeframes
During high volatility periods (like major breakouts), clouds expand dramatically
During consolidation, clouds contract and tighten around price
This creates a "breathing" effect that adapts to market conditions
Multi-Timeframe Analysis
Incorporates Fibonacci sequence periods (3, 13, 21, 34, 55) for calculations
Blends short-term responsiveness with long-term stability
Creates smooth, flowing lines that filter out market noise
Dynamic Level Calculation
Levels are not fixed percentages or static bands
Each level adapts based on current market structure and volatility
Channel lines (RC1, RC2, SC1, SC2) provide intermediate support/resistance
🎯 Key Features
1. Touch Point Detection
Colored dots appear when price touches key levels
Red dots = resistance touch
Green dots = support touch
Blue dots = trend median touch
2. Entry/Exit Signals
"Cloud Entry" labels when confirmation line crosses above SL1
"Cloud Exit" labels when confirmation line crosses below RL1
Background color changes based on bullish/bearish bias
3. Information Table
Real-time display of key levels (RL1, TM, SL1)
Current bias indicator (BULLISH/BEARISH)
Updates dynamically as market moves
⚙️ Customization Options
Main Controls:
Sensitivity (5-50): How responsive clouds are to price movements
Smoothing (1-50): Controls the flow and smoothness of cloud lines
Forward Displacement (0-50): How many bars to project the cloud forward
Advanced Volatility Settings:
Volatility Lookback (50-1000): Period for establishing volatility baseline
Volatility Smoothing (1-50): Reduces spikes in volatility expansion
Expansion Power (0.1-2.0): Controls how dramatically clouds expand
Range Divisor (1.0-20.0): Master control for overall cloud width
Level Spacing:
Individual multipliers for each resistance and support level
Allows fine-tuning of cloud structure to match different markets
Trend Spacing:
Separate controls for inner and outer trend bands
Customize the trend cloud density
📈 Trading Applications
1. Trend Identification
Price above TM (Trend Median) = Bullish bias
Price below TM = Bearish bias
Cloud color and width indicate trend strength
2. Support/Resistance Trading
Use RL1/SL1 as primary targets and reversal zones
RC1/RC2 and SC1/SC2 provide intermediate levels
RL3/SL3 mark extreme levels often seen at major tops/bottoms
3. Volatility Analysis
Expanding clouds signal increasing volatility and potential big moves
Contracting clouds indicate consolidation and potential breakout setup
Cloud width helps with position sizing and risk management
4. Multi-Timeframe Confirmation
Works on all timeframes from 1-minute to monthly
Higher timeframes show major market structure
Lower timeframes provide precise entry/exit points
🎓 Best Practices
Combine with Volume: High volume at cloud levels increases reliability
Watch for Touch Clusters: Multiple touches at a level indicate strength
Monitor Cloud Expansion: Sudden expansion often precedes major moves
Use Multiple Timeframes: Confirm signals across different time periods
Respect the Trend Median: This is often the most important level
⚡ Performance Notes
Optimized for up to 2000 bars of historical data
Smooth performance with 500+ lines and labels
Works on all markets: Crypto, Forex, Stocks, Commodities
📝 Version Info
Current Version: 1.0
Dynamic volatility expansion system
Full customization suite
Touch point detection
Entry/exit signals
Forward displacement projection


NEOs TDI + Sharkfin ScannerTDI + alert scanner for sharkfins use with Fibs and or support resistance for confluence

N-Pattern Detector (Advanced Logic)Introduction
The N-Pattern Detector (Advanced Logic) is a powerful Pine Script-based tool designed to identify a specific price structure known as the "N-pattern", which often indicates trend continuation or potential breakout points in the market. This pattern combines zigzag pivot logic, retracement filters, volume confirmation, and trend alignment, offering high-probability trading signals.
It is ideal for traders who want to automate pattern detection while applying smart filters to reduce false signals in various markets — including stocks, forex, crypto, and indices.
What is the N-Pattern?
The N-pattern is a 3-leg price formation consisting of points A-B-C-D. It typically follows this structure:
Bullish N-Pattern:
A → Low Pivot
B → Higher High (Impulse)
C → Higher Low (Retracement)
D → Breakout above B (Confirmation)
Bearish N-Pattern:
A → High Pivot
B → Lower Low (Impulse)
C → Lower High (Retracement)
D → Breakdown below B (Confirmation)
The pattern essentially reflects a trend–pullback–breakout structure, making it suitable for continuation trades.
Key Features
1. Intelligent ZigZag Pivot Detection
Uses pivot highs/lows to define key swing points (A, B, C).
Adjustable ZigZag depth to control pattern sensitivity.
Filters noise and avoids false signals in volatile markets.
2. Retracement Validation
Validates the B→C leg as a proper pullback using Fibonacci-based thresholds.
User-defined min and max retracement settings (e.g., 38.2% to 78.6% of A→B leg).
3. Trend Filter via EMA
Filters patterns based on trend direction using a customizable EMA (e.g., 200 EMA).
Only detects bullish patterns above EMA and bearish patterns below EMA (optional).
4. Volume Confirmation
Ensures that impulse legs (A→B, C→D) are supported by stronger volume than the correction leg (B→C).
Adds another layer of confirmation and reliability to detected patterns.
5. Target Projections
Automatically draws 100% A→B projected target from point C.
Optional Fibonacci extensions at 1.272 and 1.618 levels for take-profit planning.
Visually plotted on the chart with colored dashed/dotted lines.
6. Clear Visuals & Labels
Connects all pattern points with colored lines.
Clearly labels points A, B, C, D on the chart.
Uses customizable colors for bullish and bearish patterns.
Includes real-time alerts when a valid pattern is detected.
How to Use It
Add to Chart
Apply the indicator to any chart and time frame. It works across all asset classes.
Adjust Inputs (Optional)
Set ZigZag Depth to control pivot detection sensitivity.
Define Min/Max Retracement levels to match your trading style.
Enable or disable Trend and Volume filters for cleaner signals.
Customize EMA length (default: 200) for trend validation.
Wait for Pattern Confirmation
The indicator constantly scans for valid N-patterns.
A pattern is confirmed only after point D forms (breakout or breakdown).
You’ll see the full pattern drawn with target levels.
Set Alerts
Alerts trigger automatically on confirmation of a bullish or bearish pattern.
You can customize these in TradingView’s alerts panel.

Momentum & stoch rsimomentum and stochastic rsi indicator ideal for day trading. momenum is set to 80 for a smooth and safe analysis.

Ultimate JLines & MTF EMA (Configurable, Labels)## Ultimate JLines & MTF EMA (Configurable, Labels) — Script Overview
This Pine Script is a comprehensive, multi-timeframe indicator based on J Trader concepts. It overlays various Exponential Moving Averages (EMAs), VWAP, inside bar highlights, and dynamic labels onto price charts. The script is highly configurable, allowing users to tailor which elements are displayed and how they appear.
### Key Features
#### 1. **Multi-Timeframe JLines**
- **JLines** are pairs of EMAs (default lengths: 72 and 89) calculated on several timeframes:
- 1 minute (1m)
- 3 minutes (3m)
- 5 minutes (5m)
- 1 hour (1h)
- Custom timeframe (user-selectable)
- Each pair can be visualized as individual lines and as a "cloud" (shaded area between the two EMAs).
- Colors and opacity for each timeframe are user-configurable.
#### 2. **200 EMA on Multiple Timeframes**
- Plots the 200-period EMA on selectable timeframes: 1m, 3m, 5m, 15m, and 1h.
- Each can be toggled independently and colored as desired.
#### 3. **9 EMA and VWAP**
- Plots a 9-period EMA, either on the chart’s current timeframe or a user-specified one.
- Plots VWAP (Volume-Weighted Average Price) for additional trend context.
#### 4. **5/15 EMA Cross Cloud (5min)**
- Calculates and optionally displays a shaded "cloud" between the 5-period and 15-period EMAs on the 5-minute chart.
- Highlights bullish (5 EMA above 15 EMA) and bearish (5 EMA below 15 EMA) conditions with different colors.
- Optionally displays the 5 and 15 EMA lines themselves.
#### 5. **Inside Bar Highlighting**
- Highlights bars where the current high is less than or equal to the previous high and the low is greater than or equal to the previous low (inside bars).
- Color is user-configurable.
#### 6. **9 EMA / VWAP Cross Arrows**
- Plots up/down arrows when the 9 EMA crosses above or below the VWAP.
- Arrow colors and visibility are configurable.
#### 7. **Dynamic Labels**
- On the most recent bar, displays labels for each enabled line (EMAs, VWAP), offset to the right for clarity.
- Labels include the timeframe, type, and current value.
### Customization Options
- **Visibility:** Each plot (line, cloud, arrow, label) can be individually toggled on/off.
- **Colors:** All lines, clouds, and arrows can be colored to user preference, including opacity for clouds.
- **Timeframes:** JLines and EMAs can be calculated on different timeframes, including a custom one.
- **Label Text:** Labels dynamically reflect current indicator values and are color-coded to match their lines.
### Technical Implementation Highlights
- **Helper Functions:** Functions abstract away the logic for multi-timeframe EMA calculation.
- **Security Calls:** Uses `request.security` to fetch data from other timeframes, ensuring accurate multi-timeframe plotting.
- **Efficient Label Management:** Deletes old labels and creates new ones only on the last bar to avoid clutter and maintain performance.
- **Conditional Plotting:** All visual elements are conditionally plotted based on user input, making the indicator highly flexible.
### Use Cases
- **Trend Identification:** Multiple EMAs and VWAP help traders quickly identify trend direction and strength across timeframes.
- **Support/Resistance:** 200 EMA and JLines often act as dynamic support/resistance levels.
- **Entry/Exit Signals:** Crosses between 9 EMA and VWAP, as well as 5/15 EMA clouds, can signal potential trade entries or exits.
- **Pattern Recognition:** Inside bar highlights aid in spotting consolidation and breakout patterns.
### Summary Table of Configurable Elements
| Feature | Timeframes | Cloud Option | Label Option | Color Customizable | Description |
|----------------------------|-------------------|--------------|--------------|--------------------|-----------------------------------------------|
| JLines (72/89 EMA) | 1m, 3m, 5m, 1h, Custom | Yes | Yes | Yes | Key trend-following EMAs with cloud fill |
| 200 EMA | 1m, 3m, 5m, 15m, 1h | No | Yes | Yes | Long-term trend indicator |
| 9 EMA | Any | No | Yes | Yes | Short-term trend indicator |
| VWAP | Chart TF | No | Yes | Yes | Volume-weighted average price |
| 5/15 EMA Cloud (5m) | 5m | Yes | No | Yes | Bullish/bearish cloud between 5/15 EMAs |
| Inside Bar Highlight | Chart TF | No | N/A | Yes | Highlights price consolidation |
| 9 EMA / VWAP Cross Arrows | Chart TF | No | N/A | Yes | Marks EMA/VWAP crossovers with arrows |
This script is ideal for traders seeking a robust, multi-timeframe overlay that combines trend, momentum, and pattern signals in a single, highly customizable indicator. I do not advocate to subscribe to JTrades or the system they tout. This is based on my own observations and not a copy of any JTrades scripts. It is open source to allow full transparency.

SMA Crossover with Background ShadingThis application is to identify when to buy or when to sell upon satisfying the condition on this script.

D15 Precision IndicatorD15 Precision Indicator
The D15 Precision Indicator is a high-accuracy intraday trading tool optimized for 15-minute charts. It identifies precise BUY and SELL signals only when all key conditions align:
✅ Price above/below EMA 21 & EMA 50
✅ Price above/below VWAP
✅ Price within predefined support/resistance zones
✅ Break of Structure (BOS) confirmed by pivot levels
✅ High-volume breakout candle
✅ Optional confirmation from previous candles for added precision
The script includes:
Clear visual arrows (BUY/SELL)
Dynamic background highlights for signals
Support/Resistance zone boxes
All key indicators plotted (EMA, VWAP, zones)
Ideal for disciplined traders aiming for 80%+ win rate through strict signal filtering and visual clarity.


Standard Deviation Oscillator with Average and Static LinesStandard Deviation Oscillator with adjustable average and static lines

Détecteur de Bougies 9h30 / 15h30 (Heure de Paris)Détecteur de Bougies 9h30 / 15h30 (Heure de Paris) pour OPR

TeeLek-BestPositionThis indicator is used to indicate the best buying and selling points.
This indicator will calculate the best buying points (blue) and selling points (orange). The working principle is that the blue point is the point where the RSI is Over Sold, the orange point is the point where the RSI is Over Bought. After that, we will use the Highest Line 100 and Lowest Line 100 to filter the points another layer. And because when Over Bought/Over Sold occurs, there will be continuous signals that are repeated, causing confusion. Therefore, there is a feature to leave a time frame. Set the default value to 24 hours. If a signal occurs, it will be left out.
The appropriate point for buying is:
The point where Over Sold occurs and Closes lower than the Lowest Line 100.
Leave a time frame for 24 hours before a new signal occurs.
The appropriate point for selling is:
The point where Over Bought occurs and Closes higher than the Highest Line 100.
Leave a time frame for 24 hours before a new signal occurs.
It helps us to gradually buy and collect/sell for profit easily without confusion.
อินดิเคเตอร์นี้ใช้ สำหรับบอกจุดซื้อจุดขายที่ดีที่สุด
อินดิเคเตอร์นี้ จะคำนวณจุดซื้อ (สีฟ้า) และจุดขาย (สีส้ม) ที่ดีที่สุดมาให้ โดยหลักการทำงาน คือ จุดสีฟ้า คือจุดที่ RSI Over Sold จุดสีส้ม คือจุดที่ RSI Over Bought หลังจากนั้นเราจะใช้เส้น Highest Line 100 และ Lowest Line 100 เพื่อกรองจุดอีกชั้นหนึ่ง และเนื่องจากเมื่อเกิด Over Bought/Over Sold แล้ว มันจะเกิดสัญญาณต่อเนื่องซ้ำๆ ทำให้สับสน จึงได้มีฟีเจอร์ในการเว้นระยะเวลา ตั้งค่าไว้เริ่มต้นที่ 24 ชั่วโมง ถ้าเกิดสัญญาณแล้วก็จะเว้นระยะออกไป
จุดที่เหมาะสมกับการซื้อ คือ
จุดที่เกิด Over Sold และ Close ต่ำกว่าเส้น Lowest Line 100
เว้นระยะไป 24 ชั่วโมงจึงจะเกิดสัญญาณใหม่อีกครั้ง
จุดที่เหมาะสมกับการขาย คือ
จุดที่เกิด Over Bought และ Close สูงกว่าเส้น Highest Line 100
เว้นระยะไป 24 ชั่วโมงจึงจะเกิดสัญญาณใหม่อีกครั้ง
ช่วยให้เราสามารถ ทยอยซื้อเก็บสะสม/ทยอยขายทำกำไร ได้ง่ายไม่สับสน

PK's Buffer Zones with Extra Zone + EMA + VWAPuse as support and resistance. for any market and stocks.

VPT Ribbon on Price Chart (Normalized)
📊 Volume Price Trend (VPT) Ribbon – Explained
🔷 What it Is:
A visual ribbon of EMAs (Exponential Moving Averages) applied to the Volume Price Trend (VPT) line.
It helps you see volume-backed momentum trends — not just price.
---
📈 What VPT Does:
VPT = cumulative sum of (volume × percentage price change)
It rises sharply when price increases on high volume = strong buying
It falls when price decreases on high volume = strong selling
Flat movement = low conviction
---
🧠 What the Ribbon Shows:
Each line in the ribbon is an EMA of the VPT line, colored like this:
Color Meaning
Green shades Strong uptrend supported by volume
Lime Early signs of weakening or pause
Orange Neutral to bearish transition zone
Red shades Strong volume-backed downtrend
When the lines spread and point upward → strong bullish volume momentum.
When the ribbon compresses or flips down → weakening or bearish trend.
---
✅ How to Use:
Observation Interpretation
All EMAs rising + green tones Bullish volume trend
Ribbon narrowing + lime/orange emerging Caution – possible reversal or slowdown
Red tones + EMAs turning downward Bearish volume momentum
---

Custom Spread Linesthis indicator is designed to mimic the spread of the price for the brokers.
by using this indicator you can see two parallel lines indication the price spread

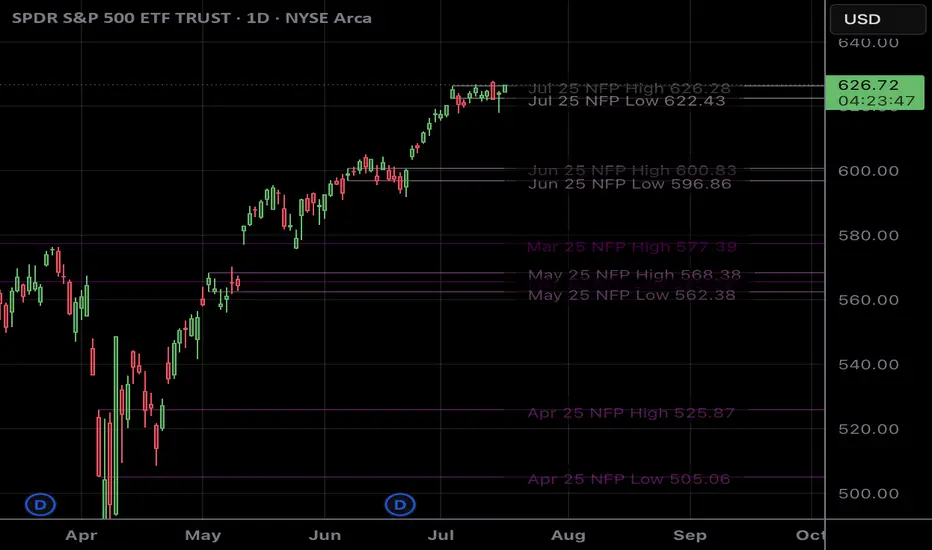
NFP RangesPlots the NFP daily ranges for NFP days. Includes extended hours ranges when the time frame is sub 1D, otherwise, only the daily range is taken.
NFP Dates are pre-populated through 2029 and historically through 2022. Will update script to include farther-out dates before they become necessary.

EMA và SMA kết hợp
SMA 20 (Simple Moving Average – a slower and more stable average)
EMA 34 (Exponential Moving Average – a faster and more responsive average)
These help traders analyze the price trend:
When the EMA crosses above the SMA → it can be a buy signal.
When the EMA crosses below the SMA → it can be a sell signal.
