Custom ETF with Dynamic Weights & RatioHi,
Want to create your own ETF from your portfolio?
This script lets you:
Add up to 10 stocks to form an ETF.
Assign weightings to each stock.
Create a second ETF to compare with your first ETF.
Compare both ETFs to determine which performs best.
Forecasting

Market Generated InformationCredits
Original Author: mcthatsme
Remixed to add in London's High and Low
Overview
The Market Generated Information (MGI Levels v2) is a comprehensive technical analysis. It overlays key price levels from daily, weekly, and monthly timeframes on a chart, providing traders with critical market reference points such as Open, High, Low, Close, Volume Weighted Average Price (VWAP), and standard deviation bands. These levels help traders identify potential support, resistance, and pivot points for intraday and longer-term trading strategies. The indicator is highly customizable, allowing users to tailor the displayed levels, colors, line styles, and label settings to their preferences.
Features
Multi-Timeframe Levels: Displays key price levels from daily, weekly, and monthly sessions, including Open, High, Low, Close, VWAP, and VWAP standard deviation bands (SD1, SD2, SD3).
Session-Based Calculations: Supports Regular Trading Hours (RTH) and Extended Trading Hours (ETH) for stocks and futures, with specific session times for New York, London, and overnight sessions.
Customizable Display: Users can toggle the visibility of specific levels, adjust line styles (solid, dashed, dotted), colors, thicknesses, and label settings (size, offset, and price inclusion).
Opening Range and Initial Balance: Plots the Opening Range (default: 9:30–10:00 AM EST) and Initial Balance (default: 9:30–10:30 AM EST) for intraday traders.
Tested Level Tracking: Optionally tracks untested or tested levels, hiding or showing them based on user preferences.
Overnight and T+2 Levels: Includes overnight high/low and T+2 (two days prior) levels for additional context.
VWAP Calculations: Computes VWAP and its standard deviation bands for daily, weekly, and monthly periods.
Holiday and Session Filters: Adjusts for market-specific conditions, such as Good Friday or shortened trading sessions.
Inputs and Customization
The indicator is organized into three main groups: Daily Levels, Weekly Levels, and Monthly Levels. Each group allows users to configure the following:
Visibility: Toggle whether to show levels (e.g., Show Daily Levels, Show Weekly Levels).
Session Times: Define session ranges (e.g., New York RTH: 9:30 AM–4:00 PM EST, Opening Range: 9:30–10:00 AM EST).
Line and Label Settings: Customize line colors, styles (solid, dashed, dotted), thickness, label text size (Tiny, Small, Normal, Large, Huge), label offset, and whether to include price values in labels.
Number of Periods: Specify how many previous days (1–40), weeks (1–20), or months (1–12) to display.
Tested/Untested Levels: Choose to keep untested levels or show tested levels (Open, High, Low, Close).
Timeframe for Calculations: Option to use a 30-second or 1-minute timeframe for Opening Range and Initial Balance calculations to accommodate different TradingView plans.
Key Levels
Daily Levels: Includes Current Day High/Low, Previous Day High/Low, Opening Range High/Mid/Low, Initial Balance High/Mid/Low, Globex Open, RTH Open, Midnight Open, London Open/Close/High/Low, Previous Day 50% (HL2/OC2), T+2 Open/Close/High/Low, Overnight High/Low, RTH Close, 5 PM Close, and VWAP with standard deviation bands.
Weekly Levels: Previous Week High/Low, 50% (HL2/OC2), Current Week Open, Previous Week Close, and VWAP with standard deviation bands.
Monthly Levels: Previous Month High/Low, 50% (HL2/OC2), Current Month Open, Previous Month Close, and VWAP with standard deviation bands.
Troubleshooting
Levels Not Displaying: Check if the timeframe is ≤ 30 minutes for daily levels and ensure session times are correct for your market.
Incorrect Prices: Verify that extended hours are enabled for ETH charts or disabled for RTH-only charts.
Too Many Lines/Labels: Reduce the number of previous days/weeks/months or disable unneeded levels.
Session Errors: Ensure session times are in UTC-5 (New York time) and match your asset’s trading hours.
License
This script is licensed under the Mozilla Public License 2.0. See mozilla.org for details.

PE Bands w/ Persistent EPS ProxyThis Pine Script is a valuation overlay for any stock or index, built around the idea of tracking and projecting P/E (Price-to-Earnings) multiple bands using trailing EPS and a growth assumption. Here's a full breakdown:
🔍 Purpose:
To visualize price bands based on valuation multiples (like 16x, 18x, 20x, etc.) of forward EPS, estimated from actual reported EPS over the last 4 quarters.
🧱 Core Components:
✅ @version=6
Specifies the latest Pine Script version (v6), ensuring compatibility with the newest syntax.
✅ indicator(...)
Declares a chart overlay indicator titled 'PE Bands w/ Persistent EPS Proxy', meaning the plots will appear on top of the price chart.
1. 📈 Growth Assumption Input
pinescript
Copy
Edit
Growth = input.float(1.08, 'Growth')
User input for projected forward EPS growth (default: +8%). This models earnings growth from trailing 12 months to forward 12 months.
2. 🧮 Retrieve EPS Data
pinescript
Copy
Edit
epsRaw = request.earnings(syminfo.tickerid, earnings.actual, gaps = barmerge.gaps_off)
Uses the built-in request.earnings() function to fetch actual EPS.
Works with any symbol that supports earnings data.
barmerge.gaps_off ensures EPS only shows on report bars (not filled in between).
3. 🧠 Persistent Memory for Last 4 EPS Values
pinescript
Copy
Edit
var float eps1 = na
...
if not na(epsRaw)
eps4 := eps3
eps3 := eps2
eps2 := eps1
eps1 := epsRaw
Implements a shift register: keeps track of the last 4 quarterly EPS values, so it can compute a full TTM (trailing 12-month) EPS even though epsRaw only updates quarterly.
4. 📊 Trailing 12-Month EPS
pinescript
Copy
Edit
epsTTM = na(eps1) or na(eps2) or na(eps3) or na(eps4) ? na : eps1 + eps2 + eps3 + eps4
Sums the most recent 4 quarters to get a TTM earnings proxy.
If any value is still na, the result is na.
5. 🔮 Forward EPS Estimation
pinescript
Copy
Edit
fwdEPS = epsTTM * Growth
Projects forward EPS using a growth multiplier (1.08 = +8%).
You could customize this to vary over time (e.g., macro-modelled growth).
6. 📐 Valuation Bands
pinescript
Copy
Edit
pe16 = fwdEPS * 16
...
pe24 = fwdEPS * 24
Calculates price levels the stock/index would be trading at under different valuation multiples of forward EPS.
These become bands: 16x, 18x, 20x, etc.
7. 📉 Plot Bands
pinescript
Copy
Edit
plot(pe16, ...)
...
plot(pe24, ...)
Draws horizontal or sloped bands that reflect valuation ranges.
If SPX is above the 22x or 24x band, you might consider the market overvalued.
If it’s near 16x, potentially undervalued (depending on forward EPS quality).
✅ Summary:
This is a dynamic, earnings-based valuation overlay for use on equity or index charts. It uses:
Real EPS data (as it gets reported)
Persistent memory to calculate trailing 12M EPS
Growth modeling to estimate forward EPS
Price targets for different forward P/E multiples

Market Strength Dashboard🚀 What It Does:
The indicator gives you a real-time dashboard showing three things:
✅ Trend Direction
Uses EMA 50 vs EMA 200.
Bullish: EMA 50 is above EMA 200 → Price favors upside swing.
Bearish: EMA 50 is below EMA 200 → Price favors downside swing.
Neutral: EMAs are equal → No clear trend.
✅ Momentum Strength
Uses RSI (Relative Strength Index).
Strong Bullish: RSI > 55 → Buyers in control.
Strong Bearish: RSI < 45 → Sellers in control.
Neutral: RSI between 45–55 → No strong momentum, usually sideways or uncertain.
✅ Volatility State (Expansion/Consolidation)
Uses Bollinger Band Width.
Measures if price is:
Expanding: BB Width increasing → Market opening up, volatility rising, often precedes large moves or breakouts.
Contracting: BB Width shrinking → Market compressing, often leads to tight ranges or consolidation.
Stable: No change in BB Width → Range behavior or calm trend.
🔥 How It Works Behind the Scenes:
EMA Cross Check:
→ Looks at whether the faster EMA (50) is above or below the slower EMA (200).
RSI Scan:
→ Reads current RSI level to determine momentum strength.
Bollinger Band Width Scan:
→ Calculates the distance between the upper and lower Bollinger Bands to detect if price is expanding or compressing.
Dashboard Output:
→ Combines all this into a floating label on the chart like:
“Trend: Bullish | Momentum: Strong Bullish | Volatility: Expanding”
🏆 How to Use It — Simple Rules for Swing or Day Trading:
🔥 Ideal Swing Trade Setup:
→ ✅ Trend: Bullish
→ ✅ Momentum: Strong Bullish
→ ✅ Volatility: Expanding
→ → Take long setups → pullbacks to EMA50 or previous highs → ride the trend.
→ ❌ If Trend is Neutral or Volatility is Contracting, skip the trade — market is chopping.
🔥 Ideal Day Trade Setup:
Look for Volatility Expanding → confirms active session/move.
Pair it with either Trend Bullish + Momentum Bullish for longs
→ Or Trend Bearish + Momentum Bearish for shorts.
🔥 When Not to Trade:
Trend Neutral + Momentum Neutral + Contracting Volatility → Sideways chop → No trade zone.
🔥 Breakout Watch Strategy:
When volatility shifts from Contracting → Expanding, expect a breakout.
→ Look for the first candle that pushes away from the Bollinger squeeze.
📊 How To Combine With Other Setups:
→ ✅ Add this dashboard to any chart to instantly know:
Should I be thinking up, down, or neither?
Is this market about to move big or stay stuck?
Pair it with:
Your price action entries.
Support/resistance levels.
Candle patterns.
Trendline or liquidity breaks.
🧠 Bottom Line:
→ This is a market condition scanner, not a signal generator.
→ It tells you: “Should I trade? What’s the direction? Is the market moving or stuck?”
→ You still choose the entry — this tool tells you when conditions are ideal or not.

Doji Ashi v2.0Doji Ashi v2.0
A versatile intraday trading indicator designed for both stocks and crypto, based on real trader feedback and tested principles.
...
Introduction & Acknowledgements
This script was made possible thanks to the ongoing feedback and live testing by the TradingView and Reddit communities. Special thanks to:
Nathan_Drake_000
Disastrous-Stand4613
Lalelulilo_ph
Jtri25
Each provided insights that directly shaped the filters, presets, and signal logic found in this release.
Much of the philosophy behind this indicator is inspired by the free Reddit PDF:
The Damn Wiki
I highly recommend reading it to better understand the edge this indicator is trying to provide.
...
What is Doji Ashi v2.0?
This indicator is designed for short-term intraday momentum trading, offering Buy and Sell signals based on a refined combination of filters including:
Trend alignment with daily SMAs
Momentum confirmation using EMA 3/8 cross
Relative volume to identify activity spikes
VWAP positioning to confirm trend consistency
Time filters to avoid unreliable early market chop
It adapts dynamically depending on whether you’re trading Stocks or Crypto, with appropriate filters toggled automatically.
...
How the Script Works
Core Logic:
A Buy signal appears when:
The price is in an uptrend (via SMAs)
VWAP and volume confirm momentum
EMA 3 crosses above EMA 8
Relative strength is strong (if enabled)
Market opens past first 30 mins
A Sell signal appears when:
The asset shows weakness across these same filters, in reverse
You’ll see green “BUY” or red “SELL” markers on your chart instantly when the full condition set is met. This script does not repaint.
Entry Logic Options:
Choose between:
"Cross" mode: Signals appear on 3/8 EMA crossover
"Above/Below" mode: Persistent signal while 3 EMA stays above/below 8 EMA
...
Strategy for Consistent Gains
This script works best on liquid stocks such as LUNR, ASTS and PLUG. It also works with Crypto. Make sure you choose the correct indicator setup type (Stocks or Crypto) in the setting before testing.
If you don't see any signals the default settings may be too strict for your chosen stock. Have a play with the settings to find the right balance for you. The default settings follow the strategy below for what I believe are currently the best results.
Alerts for buy/sell signals can be set from the alerts menu. For best results, make sure you set the alert to action on close of bar.
This indicator is most effective when:
Used with liquid stocks or crypto
Entries are confirmed with VWAP, not counter-trend
Signals are filtered by volume spikes and trend direction
Example strategy:
Buy a Call when you see a BUY signal with high volume, in an uptrend
Exit on a cross back to VWAP (the orange line) or a quick 1% profit
Do the opposite with PUTs on a SELL signal
This is ideal for quick day trades (scalps or trend moves), and avoids the choppy, uncertain zones at market open.
...
Optimizing via Settings
There are additional, stricter filters in the settings. Please adapt to your preference.
Presets:
Stocks (Default): Applies all filters but lets you disable them as needed
Crypto: Disables stock-specific filters (SPY comparison, RS, Daily trend)
Filters:
Daily Trend Filter: Helps align trades with higher timeframe direction (recommended ON for stocks)
Market Trend & RS: Filters based on SPY and relative performance (test enabling for SPY-following tickers)
VWAP Entry Filter: Keeps you from fighting the dominant intraday trend
Ignore First 30 Minutes: Avoids false signals at the open
Experiment with toggling filters ON/OFF to match your asset class and volatility conditions.
...
Finally
The best way to master this indicator is to understand the trading mindset it came from.
Read The Damn Wiki — it’s free, comprehensive, and packed with wisdom that this script distills into a usable tool.
If you would like to adapt this indicator you are very welcome to do so. All I ask in return is that you share your findings with the wider community.
...
Happy trading. May your entries be sharp and your exits cleaner.
~ @SassyStonks

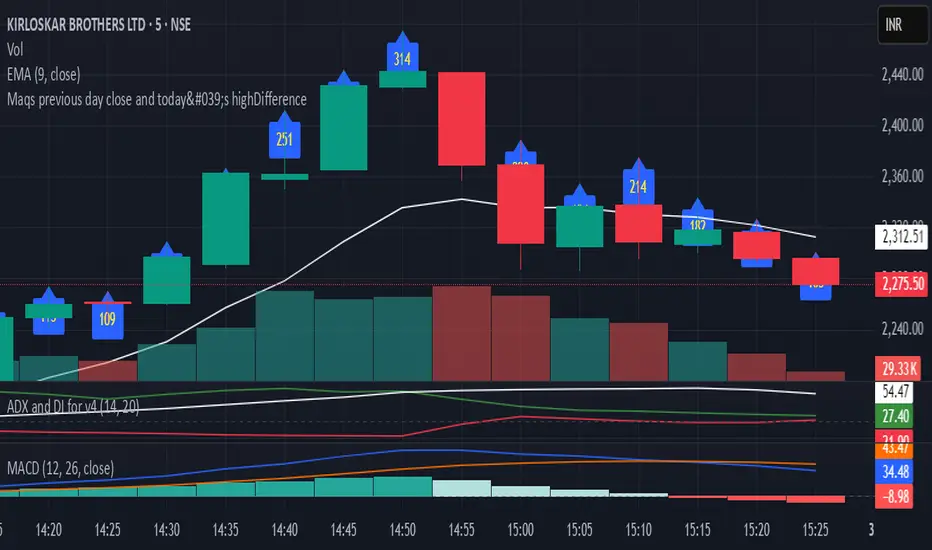
Maqs previous day close and today's highDifferenceIt gives previous day close and today's high Difference and hence capacity of the stock
Opening Range Breakout (ORB) with Fib RetracementOverview
“ORB with Fib Retracement” is a Pine Script indicator that anchors a full Fibonacci framework to the first minutes of the trading day (the opening-range breakout, or ORB).
After the ORB window closes the script:
Locks-in that session’s high and low.
Calculates a complete ladder of Fibonacci retracement levels between them (0 → 100 %).
Projects symmetric extension levels above and below the range (±1.618, ±2.618, ±3.618, ±4.618 by default).
Sub-divides every extension slice with additional 23.6 %, 38.2 %, 50 %, 61.8 % and 78.6 % mid-lines so each “zone” has its own inner fib grid.
Plots the whole structure and—optionally—extends every line into the future for ongoing reference.
**Session time / timezone** – Defines the ORB window (defaults 09:30–09:45 EST).
**Show All Fib Levels** – Toggles every retracement and extension line on or off.
**Show Extended Lines** – Draws dotted, extend-right projections of every level.
**Color group** – Assigns colors to buy-side (green), sell-side (red), and internal fibs (gray).
**Extension value inputs** – Allows custom +/- 1.618 to 4.618 fib levels for personalized projection zones.

RSI OB/OS THEDU 999//@version=6
indicator("RSI OB/OS THEDU 999", overlay=false)
//#region Inputs Section
// ================================
// Inputs Section
// ================================
// Time Settings Inputs
startTime = input.time(timestamp("1 Jan 1900"), "Start Time", group="Time Settings")
endTime = input.time(timestamp("1 Jan 2099"), "End Time", group="Time Settings")
isTimeWindow = time >= startTime and time <= endTime
// Table Settings Inputs
showTable = input.bool(true, "Show Table", group="Table Settings")
fontSize = input.string("Auto", "Font Size", options= , group="Table Settings")
// Strategy Settings Inputs
tradeDirection = input.string("Long", "Trade Direction", options= , group="Strategy Settings")
entryStrategy = input.string("Revert Cross", "Entry Strategy", options= , group="Strategy Settings")
barLookback = input.int(10, "Bar Lookback", minval=1, maxval=20, group="Strategy Settings")
// RSI Settings Inputs
rsiPeriod = input.int(14, "RSI Period", minval=1, group="RSI Settings")
overboughtLevel = input.int(70, "Overbought Level", group="RSI Settings")
oversoldLevel = input.int(30, "Oversold Level", group="RSI Settings")
//#endregion
//#region Font Size Mapping
// ================================
// Font Size Mapping
// ================================
fontSizeMap = fontSize == "Auto" ? size.auto : fontSize == "Small" ? size.small : fontSize == "Normal" ? size.normal : fontSize == "Large" ? size.large : na
//#endregion
//#region RSI Calculation
// ================================
// RSI Calculation
// ================================
rsiValue = ta.rsi(close, rsiPeriod)
plot(rsiValue, "RSI", color=color.yellow)
hline(overboughtLevel, "OB Level", color=color.gray)
hline(oversoldLevel, "OS Level", color=color.gray)
//#endregion
//#region Entry Conditions
// ================================
// Entry Conditions
// ================================
buyCondition = entryStrategy == "Revert Cross" ? ta.crossover(rsiValue, oversoldLevel) : ta.crossunder(rsiValue, oversoldLevel)
sellCondition = entryStrategy == "Revert Cross" ? ta.crossunder(rsiValue, overboughtLevel) : ta.crossover(rsiValue, overboughtLevel)
// Plotting buy/sell signals
plotshape(buyCondition ? oversoldLevel : na, title="Buy", location=location.absolute, color=color.green, style=shape.labelup, text="BUY", textcolor=color.white, size=size.small)
plotshape(sellCondition ? overboughtLevel : na, title="Sell", location=location.absolute, color=color.red, style=shape.labeldown, text="SELL", textcolor=color.white, size=size.small)
// Plotting buy/sell signals on the chart
plotshape(buyCondition, title="Buy", location=location.belowbar, color=color.green, style=shape.triangleup, text="BUY", textcolor=color.white, size=size.small , force_overlay = true)
plotshape(sellCondition, title="Sell", location=location.abovebar, color=color.red, style=shape.triangledown, text="SELL", textcolor=color.white, size=size.small, force_overlay = true)
//#endregion
//#region Returns Matrix Calculation
// ================================
// Returns Matrix Calculation
// ================================
var returnsMatrix = matrix.new(0, barLookback, 0.0)
if (tradeDirection == "Long" ? buyCondition : sellCondition ) and isTimeWindow
newRow = array.new_float(barLookback)
for i = 0 to barLookback - 1
entryPrice = close
futurePrice = close
ret = (futurePrice - entryPrice) / entryPrice * 100
array.set(newRow, i, math.round(ret, 4))
matrix.add_row(returnsMatrix, matrix.rows(returnsMatrix), newRow)
//#endregion
//#region Display Table
// ================================
// Display Table
// ================================
var table statsTable = na
if barstate.islastconfirmedhistory and showTable
statsTable := table.new(position.top_right, barLookback + 1, 4, border_width=1, force_overlay=true)
// Table Headers
table.cell(statsTable, 0, 1, "Win Rate %", bgcolor=color.rgb(45, 45, 48), text_color=color.white, text_size=fontSizeMap)
table.cell(statsTable, 0, 2, "Mean Return %", bgcolor=color.rgb(45, 45, 48), text_color=color.white, text_size=fontSizeMap)
table.cell(statsTable, 0, 3, "Median Return %", bgcolor=color.rgb(45, 45, 48), text_color=color.white, text_size=fontSizeMap)
// Row Headers
for i = 1 to barLookback
table.cell(statsTable, i, 0, str.format("{0} Bar Return", i), bgcolor=color.rgb(45, 45, 48), text_color=color.white, text_size=fontSizeMap)
// Calculate Statistics
meanReturns = array.new_float()
medianReturns = array.new_float()
for col = 0 to matrix.columns(returnsMatrix) - 1
colData = matrix.col(returnsMatrix, col)
array.push(meanReturns, array.avg(colData))
array.push(medianReturns, array.median(colData))
// Populate Table
for col = 0 to matrix.columns(returnsMatrix) - 1
colData = matrix.col(returnsMatrix, col)
positiveCount = 0
for val in colData
if val > 0
positiveCount += 1
winRate = positiveCount / array.size(colData)
meanRet = array.avg(colData)
medianRet = array.median(colData)
// Color Logic
winRateColor = winRate == 0.5 ? color.rgb(58, 58, 60) : (winRate > 0.5 ? color.rgb(76, 175, 80) : color.rgb(244, 67, 54))
meanBullCol = color.from_gradient(meanRet, 0, array.max(meanReturns), color.rgb(76, 175, 80), color.rgb(0, 128, 0))
meanBearCol = color.from_gradient(meanRet, array.min(meanReturns), 0, color.rgb(255, 0, 0), color.rgb(255, 99, 71))
medianBullCol = color.from_gradient(medianRet, 0, array.max(medianReturns), color.rgb(76, 175, 80), color.rgb(0, 128, 0))
medianBearCol = color.from_gradient(medianRet, array.min(medianReturns), 0, color.rgb(255, 0, 0), color.rgb(255, 99, 71))
table.cell(statsTable, col + 1, 1, str.format("{0,number,#.##%}", winRate), text_color=color.white, bgcolor=winRateColor, text_size=fontSizeMap)
table.cell(statsTable, col + 1, 2, str.format("{0,number,#.###}%", meanRet), text_color=color.white, bgcolor=meanRet > 0 ? meanBullCol : meanBearCol, text_size=fontSizeMap)
table.cell(statsTable, col + 1, 3, str.format("{0,number,#.###}%", medianRet), text_color=color.white, bgcolor=medianRet > 0 ? medianBullCol : medianBearCol, text_size=fontSizeMap)
//#endregion
// Background color for OB/OS regions
bgcolor(rsiValue >= overboughtLevel ? color.new(color.red, 90) : rsiValue <= oversoldLevel ? color.new(color.green, 90) : na)

Gold M1 Ultra Smart Strategy by RifaatThe script automatically adapts to the market strength for gold on the M1 timeframe
It loosens or tightens the RSI, MACD, and Bollinger Bands conditions based on the market condition
It reduces false signals and increases the accuracy of entry and exit points

Target Trend – Ultra Upgrade by RifaatFalse Signal Filtering using a confirmation filter (RSI + ATR filter).
More Reliable Entry Logic by requiring stronger breakouts.
Refined Trend Change Detection to reduce whipsaws.
Visual Clean-up for clarity and fewer distractions.
Optional Filters Toggle for advanced users.


EPS and Sales Magic Indicator V2EPS and Sales Magic Indicator V2
EPS and Sales Magic Indicator V2
Short Title: EPS V2
Author: Trading_Tomm
Platform: TradingView (Pine Script v6)
License: Free for public use under fair usage guidelines
Overview
The EPS and Sales Magic Indicator V2 is a powerful stock fundamental visualization tool built specifically for TradingView users who wish to incorporate earnings intelligence directly onto their price chart. Designed and developed by Trading_Tomm, this upgraded version of the original 'EPS and Sales Magic Indicator' includes an enriched and more insightful presentation of company performance metrics — now with TTM EPS support, advanced color-coding, label sizing, and refined control options.
This indicator is tailored for retail traders, swing investors, and long-term fundamental analysts who need to view Quarter-over-Quarter (QoQ) earnings and revenue changes directly on the price chart without switching tabs or breaking focus.
What Does It Display?
The EPS and Sales Magic Indicator V2 intelligently detects quarterly financial updates and displays the following data points via labels:
1. EPS (Earnings Per Share) – Current Quarterly Value
This is the most recent Diluted EPS published by the company, fetched using TradingView’s request.financial() function.
Displayed in the format: EPS: ₹20.45
2. EPS QoQ Percentage Change
Shows the percentage change in EPS compared to the previous quarter.
Highlights improvement or decline using arrows (up for improvement, down for decline).
Displayed in the format: EPS: ₹20.45 (up 15.3 percent)
3. Sales (Revenue) – Current Quarterly Value
Fetches and displays Total Revenue of the company in ₹Crores for easier Indian-market readability.
Displayed in the format: Sales: ₹460Cr
4. Sales QoQ Percentage Change
Measures and presents the quarter-over-quarter percentage change in total revenue.
Uses arrows to indicate growth or contraction.
Displayed in the format: Sales: ₹460Cr (down 3.8 percent)
5. EPS TTM (Trailing Twelve Months)
You now get the TTM EPS — the sum of the last four quarterly EPS values.
This value provides a better long-term earnings snapshot compared to a single quarter.
Displayed in the format: TTM EPS: ₹78.12
All of these values are automatically calculated and displayed only on the bars where a new financial report is detected, keeping your chart clean and insightful.
Customization Features
This indicator is built with user control in mind, allowing you to personalize how and what you want to see:
Show EPS in Label: Enable or disable the display of EPS and EPS QoQ values.
Show Sales in Label: Toggle the visibility of revenue and sales change percentage.
Color Options for Label Themes: The label background color is automatically determined based on performance.
Green: Both EPS and Sales increased QoQ.
Red: Both decreased.
Orange: One increased and the other decreased.
Gray: Default color (if values are unavailable or mixed).
Label Text Size: Choose from Tiny, Small (default), or Normal.
Visual Design
Placement: The labels are positioned just below the candlesticks using yloc.belowbar, so they do not obstruct price action or interfere with technical indicators.
Anchor: Aligned precisely with the financial reporting bars to maintain clarity in historical comparisons.
Background Style: Clean, semi-transparent styling with soft text colors for comfortable viewing.
How It Works
The indicator relies on TradingView’s powerful request.financial() function to extract fiscal quarterly financials (FQ). Internally, it uses detection logic to identify fresh data updates by comparing current vs. previous values, arithmetic to compute QoQ percentage changes in EPS and Sales, logic to build formatted labels dynamically based on user selections, and conditional color and sizing logic to enhance interpretability.
Use Cases
For Long-Term Investors: Quickly identify if a company’s profitability and revenue are improving over time.
For Swing Traders: Combine recent earnings trends with price action to evaluate if post-result momentum has real backing.
For Technical and Fundamental Traders: Layer it with moving averages, RSI, or volume to create a hybrid analysis environment.
Limitations and Notes
Financial data is provided by TradingView’s financial API, and occasional missing values may occur for less-covered stocks.
This tool does not repaint but depends on the timing of the official financial updates.
All values are rounded and formatted to prioritize readability.
Works best on Daily or higher timeframes (weekly or monthly also supported).
License and Fair Use
This script is free to use and share under TradingView’s open-use guidelines. You may copy, fork, and build upon this indicator for personal or educational purposes, but commercial usage requires attribution to the author: Trading_Tomm.
Future Enhancements (Planned)
Addition of Net Profit (QoQ and TTM)
Inclusion of Operating Margin, Profit Margin, and Book Value
Option to switch between numeric and graphical display (table mode)
Alerts on extreme earnings deviation or sales slumps
Final Thoughts
The EPS and Sales Magic Indicator V2 represents a clean, visual, and smart way to monitor a company’s core performance from your chart screen. It helps you align fundamental strength with technical strategies and provides instant financial clarity, which is especially vital in today’s fast-moving markets.
Whether you’re preparing for an earnings season or scanning past performance to pick your next investment, this indicator saves time, enhances insights, and sharpens decisions.

Rolling Correlation (Forex)//@version=5
indicator("Rolling Correlation (Forex)", shorttitle="ρ-Corr", overlay = false)
// ── User inputs ────────────────────────────────────────────────────────────────
sym1 = input.symbol("FX_IDC:EURUSD", "First symbol") // Change if your broker uses another prefix
sym2 = input.symbol("FX_IDC:GBPUSD", "Second symbol")
len = input.int(20, "Look-back length", minval = 2)
// ── Pull closing prices from both symbols on the chart’s timeframe ────────────
p1 = request.security(sym1, timeframe.period, close,
barmerge.gaps_off, barmerge.lookahead_on)
p2 = request.security(sym2, timeframe.period, close,
barmerge.gaps_off, barmerge.lookahead_on)
// ── Convert to log-returns (removes price-level bias) ─────────────────────────
r1 = math.log(p1 / p1 )
r2 = math.log(p2 / p2 )
// ── Rolling Pearson correlation ───────────────────────────────────────────────
corr = ta.correlation(r1, r2, len)
// ── Plot ──────────────────────────────────────────────────────────────────────
plot(corr, title = "ρ", linewidth = 2)
hline( 1, "+1 (perfect)", color = color.green)
hline( 0, "0", color = color.gray)
hline(-1, "-1 (inverse)", color = color.red)

NEIROCTO Impulse Watcher (Alert Ready)
📡 Zazulya Radar — Full System
This indicator combines key elements for short-term trend identification and volume-driven impulse detection:
- EMA 9 and EMA 21 for trend phase analysis
- VWAP for intraday price equilibrium
- Bollinger Bands for volatility breakout zones
- RSI for identifying overbought/oversold moments
- Volume + SMA(20) for accumulation/distribution patterns
Perfect for scalping, grid trading and sniper entries in volatile markets.

NEIROCTO Impulse Watcher (Alert Ready)//@version=5
indicator("NEIROCTO Combo Watcher (Pump vs Dump)", overlay=true)
// === RSI и его производные ===
rsi = ta.rsi(close, 14)
rsi_sma = ta.sma(rsi, 5)
rsi_up = rsi > rsi_sma
rsi_down = rsi < rsi_sma
// === Волатильность ===
volatility = math.abs(close - close ) / close * 100
volatility_trigger = volatility > 3
// === Объёмы ===
volume_sma = ta.sma(volume, 20)
volume_up = volume > volume_sma
// === Условие пампа ===
pump_condition = rsi > 45 and rsi_up and volatility_trigger and volume_up
// === Условие отката ===
dump_condition = rsi < 40 and rsi_down and volatility_trigger and volume_up
// === Фон ===
bgcolor(pump_condition ? color.new(color.green, 85) : na)
bgcolor(dump_condition ? color.new(color.red, 85) : na)
// === Метки ===
plotshape(pump_condition, title="🚀 PUMP Signal", location=location.belowbar, color=color.green, style=shape.labelup, text="🚀")
plotshape(dump_condition, title="⚠️ DUMP Signal", location=location.abovebar, color=color.red, style=shape.labeldown, text="⚠️")
// === Алерты ===
alertcondition(pump_condition, title="🚀 NEIROCTO: Возможен памп!", message="🚀 RSI ↑, Волатильность >3%, Объёмы высокие — возможен памп!")
alertcondition(dump_condition, title="⚠️ NEIROCTO: Возможен откат!", message="⚠️ RSI ↓, Волатильность >3%, объёмы растут — возможен откат!")

Initial balance - weeklyWeekly Initial Balance (IB) — Indicator Description
The Weekly Initial Balance (IB) is the price range (High–Low) established during the week’s first trading session (most commonly Monday). You can measure it over the entire day or just the first X hours (e.g. 60 or 120 minutes). Once that session ends, the IB High and IB Low define the key levels where the initial weekly range formed.
Why Measure the Weekly IB?
Week-Opening Sentiment:
Monday’s range often sets the tone for the rest of the week. Trading above the IB High signals bullish control; trading below the IB Low signals bearish control.
Key Liquidity Zones:
Large institutions tend to place orders around these extremes, so you’ll frequently see tests, breakouts, or rejections at these levels.
Support & Resistance:
The IB High and IB Low become natural barriers. Price will often return to them, bounce off them, or break through them—ideal spots for entries and exits.
Volatility Forecast:
The width of the IB (High minus Low) indicates whether to expect a volatile week (wide IB) or a quieter one (narrow IB).
Significance of IB Levels
Breakout:
A clear break above the IB High (for longs) or below the IB Low (for shorts) can ignite a strong trending move.
Fade:
A rejection off the IB High/Low during low momentum (e.g. low volume or pin-bar formations) offers a high-probability reversal trade.
Mid-Point:
The 50% level of the IB range often “magnetizes” price back to it, providing entry points for continuation or reversal strategies.
Three Core Monday IB Strategies
A. Breakout (Open-Range Breakout)
Entry: Wait for 1–2 candles (e.g. 5-minute) to close above IB High (long) or below IB Low (short).
Stop-Loss: A few pips below IB High (long) or above IB Low (short).
Profit-Target: 2–3× your risk (Reward:Risk ≥ 2:1).
Best When: You spot a clear impulse—such as a strong pre-open volume spike or news-driven move.
B. Fade (Reversal at Extremes)
Entry: When price tests IB High but shows weakening momentum (shrinking volume, upper-wick candles), enter short; vice versa for IB Low and longs.
Stop-Loss: Just beyond the IB extreme you’re fading.
Profit-Target: Back toward the IB mid-point (50% level) or all the way to the opposite IB extreme.
Best When: Monday’s action is range-bound and lacks a clear directional trend.
C. Mid-Point Trading
Entry: When price returns to the 50% level of the IB range.
In an up-trend: buy if it bounces off mid-point back toward IB High.
In a down-trend: sell if it reverses off mid-point back toward IB Low.
Stop-Loss: Just below the nearest swing-low (for longs) or above the nearest swing-high (for shorts).
Profit-Target: To the corresponding IB extreme (High or Low).
Best When: You see a strong initial move away from the IB, followed by a pullback to the mid-point.
Usage Steps
Configure your session: Measure IB over your chosen Monday timeframe (whole day or first X hours).
Choose your strategy: Align Breakout, Fade, or Mid-Point entries with the current market context (trend vs. range).
Manage risk: Keep risk per trade ≤ 1% of account and maintain at least a 2:1 Reward:Risk ratio.
Backtest & forward-test: Verify performance over multiple Mondays and in a paper-trading environment before going live.

Candle Closer Levels & TP Zones📝 Description:
This indicator is designed to provide intrabar trade levels for high-speed execution strategies, such as scalping and intraday momentum trading.
🧩 Key Features:
Plots High, Low, Mid, and two Quarter Levels on the current candle only, keeping charts clean
Take Profit (TP) lines are calculated as a percentage of candle range, not fixed ticks — this makes it highly adaptable for futures like NQ/ES or volatile markets like crypto
Supports both long and short setups via a simple toggle
Customizable colors, line thickness, and length
Each TP level can be enabled or muted individually
📈 Use Case:
Apply this tool to spot candle-based breakouts or rejections. You can scale TPs dynamically based on the strength of the current candle. This is especially helpful in assets where volatility fluctuates greatly intrabar.
This is not a repackaged built-in indicator — it’s purpose-built for real-time tactical level plotting without historical noise.

Multi-Position DashMulti-Position Dash — Risk Dashboard for Forex, Stocks & Indices
Overview:
The Multi-Position Dash is a highly customizable trading dashboard designed to help active traders manage up to 8 simultaneous positions across Forex, Stocks, and Indices. Whether you're trading single entries, layering positions, using DCA (Dollar Cost Averaging), or running complex hedging setups, this tool provides essential, real-time risk and P&L insights—directly on your chart.
Key Features:
✔️ Supports Forex, Stocks, Indices — with automatic pip and contract conversions
✔️ Track up to 8 manual positions, each with customizable direction, lot size or contracts, entry price, Take Profit, and Stop Loss
✔️ Full GBP-based P&L and risk calculation, including automatic USD-to-GBP conversion for non-FX assets
✔️ Real-time display of:
Total potential Take Profit (GBP)
Total potential Stop Loss (GBP)
Risk % relative to account balance
Live P&L (GBP) based on current price
✔️ Breakeven price calculation, even across mixed-direction positions (DCA & hedging aware)
✔️ Visual breakeven line, live P&L arrows, and entry price markers
✔️ Shared Stop Loss option for all positions — perfect for DCA traders
✔️ Easy export strings for logging trades to external tools like spreadsheets
Ideal For:
✅ Forex traders using lot-based risk models
✅ Stock & Index traders wanting simplified contract-based position tracking
✅ Traders managing multiple active positions, with or without hedging
✅ Anyone needing at-a-glance P&L and risk monitoring, independent of broker platforms
Notes & Usage:
This is a manual tracking tool—you enter your positions, TP, SL levels, etc., and the dashboard calculates the rest. It does not place or manage live orders.
Supports both Long and Short positions.
All calculations are based on your inputs and market price—accuracy depends on maintaining your inputs properly.
Shared Stop Loss feature applies a single, unified stop across all active positions for simplified risk control in DCA setups.
GBP is used as the account currency—USD-to-GBP conversion is applied to stocks and indices as needed.
Disclaimer:
This tool is for educational and planning purposes only. It does not place or manage live trades, and is not a substitute for broker risk management tools. Always double-check your own position sizing and risk before placing live orders.

ATR FX DashboardATR FX Dashboard – Multi-Timeframe Volatility Monitor
Overview:
The ATR FX Dashboard provides a quick, at-a-glance view of market volatility across multiple timeframes for any forex pair. It uses the well-known Average True Range (ATR) indicator to display real-time volatility information in both pips and percentage terms, helping traders assess potential risk, position sizing, and market conditions.
How It Works:
This dashboard displays:
✔ ATR in Pips — The average price movement over a given timeframe, converted to pips for easy interpretation, automatically adjusting for JPY pairs.
✔ ATR as a Percentage of Price — Shows how significant the ATR is relative to the current price. Higher percentages often signal higher volatility or more active markets.
✔ Color-Coded Volatility Highlights — On the daily timeframe, ATR % cells are color-coded:
Green: High volatility
Orange: Moderate volatility
Red: Low volatility
Timeframes Displayed:
15 Minutes
1 Hour
4 Hour
Daily
This gives traders a clear, multi-timeframe view of short-term and broader market volatility conditions, directly on the chart.
Ideal For:
✅ Forex traders seeking quick, reliable volatility reference points
✅ Day traders and swing traders needing help with risk assessment and position sizing
✅ Anyone using ATR-based strategies or simply wanting to stay aware of changing market conditions
Additional Features:
Toggle option to display or hide ATR % relative to price
Automatic pip conversion for JPY pairs
Simple, clean table layout in the bottom-right corner of the chart
Supports all forex symbols
Disclaimer:
This tool is for informational purposes only and is not financial advice. As with all technical indicators, it should be used in conjunction with other tools and proper risk management.

M2 Liquidity Divergence ModelM2 Liquidity Divergence Model
The M2 Liquidity Divergence Model is a macro-aware visualization tool designed to compare shifts in global liquidity (M2) against the performance of a benchmark asset (default: Bitcoin). This script captures liquidity flows across major global economies and highlights whether price action is aligned ("Agreement") or diverging ("Divergence") from macro trends.
🔍 Core Features
M2 Global Liquidity Index (GLI):
Aggregates M2 money supply from major global economies, FX-adjusted, including extended contributors like India, Brazil, and South Africa. The slope of this composite is used to infer macro liquidity trends.
Lag Offset Control:
Allows the M2 signal to lead benchmark asset price by a configurable number of days (Lag Offset), useful for modeling the forward-looking nature of macro flows.
Gradient Macro Context (Background):
Displays a color-gradient background—aqua for expansionary liquidity, fuchsia for contraction—based on the slope and volatility of M2. This contextual backdrop helps users visually anchor price action within macro shifts.
Divergence Histogram (Optional):
Plots a histogram showing dynamic correlation or divergence between the liquidity index and the selected benchmark.
Agreement Mode: M2 and asset are moving together.
Divergence Mode: Highlights break in expected macro-asset alignment.
Adaptive Transparency Scaling:
Histogram and background gradients scale their visual intensity based on statistical deviation to emphasize stronger signals.
Toggle Options:
Show/hide the M2 Liquidity Index line.
Show/hide divergence histogram.
Enable/disable visual offset of M2 to benchmark.
🧠 Suggested Usage
Macro Positioning: Use the background context to align directional trades with macro liquidity flows.
Disagreement as Signal: Use divergence plots to identify when price moves against macro expectations—potential reversal or exhaustion zones.
Time-Based Alignment: Adjust Lag Offset to synchronize M2 signals with asset price behavior across different market conditions.
⚠️ Disclaimer
This indicator is designed for educational and analytical purposes only. It does not constitute financial advice or an investment recommendation. Always conduct your own research and consult a licensed financial advisor before making trading decisions.

MNQ/NQ Risk Management ToolThis tool helps MNQ and NQ futures traders automatically calculate position size based on either a fixed dollar risk or a percentage of account balance.
Simply enter your stop loss level and choose whether to risk a set dollar amount or a percentage of your account. The script will display how many contracts to trade based on your setup.
Features:
Calculates contracts based on stop loss and risk size
Toggle between dollar-based or percent-of-account risk
Works with both MNQ ($2/point) and NQ ($20/point)
Automatically updates based on current price and direction (long or short)
Displays a clean info box on your chart with risk, contracts, and settings
This tool is ideal for intraday or swing traders who want to stay consistent with risk management across trades.

Bitcoin Power Law Clock [LuxAlgo]The Bitcoin Power Law Clock is a unique representation of Bitcoin prices proposed by famous Bitcoin analyst and modeler Giovanni Santostasi.
It displays a clock-like figure with the Bitcoin price and average lines as spirals, as well as the 12, 3, 6, and 9 hour marks as key points in the cycle.
🔶 USAGE
Giovanni Santostasi, Ph.D., is the creator and discoverer of the Bitcoin Power Law Theory. He is passionate about Bitcoin and has 12 years of experience analyzing it and creating price models.
As we can see in the above chart, the tool is super intuitive. It displays a clock-like figure with the current Bitcoin price at 10:20 on a 12-hour scale.
This tool only works on the 1D INDEX:BTCUSD chart. The ticker and timeframe must be exact to ensure proper functionality.
According to the Bitcoin Power Law Theory, the key cycle points are marked at the extremes of the clock: 12, 3, 6, and 9 hours. According to the theory, the current Bitcoin prices are in a frenzied bull market on their way to the top of the cycle.
🔹 Enable/Disable Elements
All of the elements on the clock can be disabled. If you disable them all, only an empty space will remain.
The different charts above show various combinations. Traders can customize the tool to their needs.
🔹 Auto scale
The clock has an auto-scale feature that is enabled by default. Traders can adjust the size of the clock by disabling this feature and setting the size in the settings panel.
The image above shows different configurations of this feature.
🔶 SETTINGS
🔹 Price
Price: Enable/disable price spiral, select color, and enable/disable curved mode
Average: Enable/disable average spiral, select color, and enable/disable curved mode
🔹 Style
Auto scale: Enable/disable automatic scaling or set manual fixed scaling for the spirals
Lines width: Width of each spiral line
Text Size: Select text size for date tags and price scales
Prices: Enable/disable price scales on the x-axis
Handle: Enable/disable clock handle
Halvings: Enable/disable Halvings
Hours: Enable/disable hours and key cycle points
🔹 Time & Price Dashboard
Show Time & Price: Enable/disable time & price dashboard
Location: Dashboard location
Size: Dashboard size
