Oscillator Evaluator (Analysis tool)Oscillator Evaluator (Analysis tool)
The oscillator evaluator is a tool that will help you analyse and compare the oscillator of your choice to another 2 oscillators.
By selecting the strategy with which you will analyze the oscillators, you will be able to see the behaviour of the oscillators in different aspects.
First there is a moving average increase or decrease strategy, that will give you a good idea of the correlation of the oscillator with the price.
The second is a commom 2 MA crossover strategy, that will give you and idea of the validaty of that oscillator as a strategy or as a trend filter.
The third strategy is a cross over 0 signal, that will go long on a crossover of 0 and short on a crossunder 0. This helps you see how good is the oscillator at evaluating suport and resistance areas and give you an idea of its balance.
The forth strategy is a Buy/Sell on extremes of the oscillator and will let you know how good is your strategy at spotting good places to buy and sell.
The fith strategy is to evaluate how goood the oscillator is as a mean reversion filter or how good it is at spotting small price changes.
The sixth strategy is similar to the last but is focused on how good is the oscillator spotting good places to take profits on trending strategies.
The 6 strategies in the script produce signals from the oscillator and from the oscillator only.
In conclusion this tool can be used to measure your oscillator and see if it really is as good as you think in comparison to others.
This script is not intended to be used as a full strategy but as a tool.
Oscillators

MA Divergences StrategyThis is the Strategy version of the Study I published. It is a Moving Average that can be applied to any plot to plot divergences on any oscillator, as well as perform backtesting. You'll need a REALLY good oscillator to perform live trades using this alone, but I think it is a valuable tool and had the Strategy hanging around and for some reason didn't upload it yet.
So here it is.
Turn Length to 1 to follow the oscillator without lag. Turn Length up if you are getting too many false signals or tweak the original oscillator settings.
RSI of MACD Strategy [Long only]This strategy uses the RSI on MACD indicator.
BUY
====
When RSI indicator crossing over 30 or 35 line and price above slow ema
Note: when the position already taken, you may reenter on the purple candle
Partial Exit
==========
Partial profit taking option is available in settings. If this is selected , 1/3 position exited when RSI indicator crossing down 80 line
Close
=====
When RSI indicator crossing below 15
Stop Loss
=========
I havent used hard stop loss in this strategy. Reason is , when price going down , indicator may go up ... so just wanted to ride along with indicator ...
Stop loss mentioned in the settings is used in calculation of how many units can be be purchased based on risk level
Tested with SPY and QQQ ETFs on hourly chart
Warning
=========
For the eductional purposes only ...
This is not a financial advise. please do your own research before taking any trading decission

Super Momentum StrategyThis is a strategy utilizing multiple of Evergets RMI (thanks to him for permission to publish) and a Chance Momentum.
It buys when 4 of the RMIs are below their thresholds and sells when they are above. There is a 5th one I added last night that works in Reverse - buy when its above and sell when below, which should work better for pyramiding strats by using it at the right rate to set the overall trend.
Very basic sample below, I could have set it up better as my example but just want to publish.

Combo Backtest 123 Reversal & Market Facilitation Index This is combo strategies for get a cumulative signal.
First strategy
This System was created from the Book "How I Tripled My Money In The
Futures Market" by Ulf Jensen, Page 183. This is reverse type of strategies.
The strategy buys at market, if close price is higher than the previous close
during 2 days and the meaning of 9-days Stochastic Slow Oscillator is lower than 50.
The strategy sells at market, if close price is lower than the previous close price
during 2 days and the meaning of 9-days Stochastic Fast Oscillator is higher than 50.
Second strategy
The Market Facilitation Index is an indicator that relates price range to
volume and measures the efficency of price movement. Use the indicator to
determine if the market is trending. If the Market Facilitation Index increased,
then the market is facilitating trade and is more efficient, implying that the
market is trending. If the Market Facilitation Index decreased, then the market
is becoming less efficient, which may indicate a trading range is developing that
may be a trend reversal.
WARNING:
- For purpose educate only
- This script to change bars colors.

RMI + Triple HMRSI + Double EVWRSI + TERSI + CMO StrategyThis is a strange experimental strategy WIP that I decided to upload an early version to share some of what I am working on. Just one script of a few.
It combines Chande Momentum with RMI and some weird ones I am experimenting with - Triple Hull MA RSI, Double Exponential + Volume Weighted RSI, Triple Exponential RSI. And to top it off, a final oscillator that combines the THMRSI with the RMI.
The main intention here, currently, is to test the usefulness of each on different timeframes and values. Currently it is considered to buy when all are below their threshold and sell when all are above, with the chande momentum crossing its line as the final confirmation.
For now there is no individual for each of the unique elements included. I am going to likely use this is a working house project to test other experimental indicators in the future.
It may be some of these are better suited for long term but I do think they have valid uses in checking short and long term momentum at the very least.
I copied the RMI from Everget.

Chande Momentum Strat (Crossover)This is a Chande Momentum strategy that buys and sells when the line crosses the buy and sell lines. Different signal then the other Chande Momentum strategy. In my opinion they both work better at different time frames and possibly commodities.

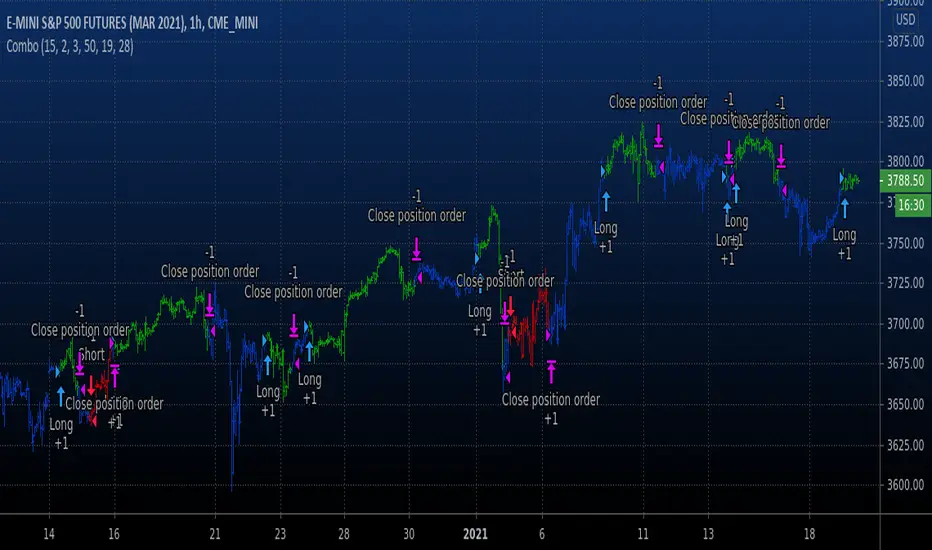
[DS]Entry_Exit_TRADE.V01-StrategyThe proposal of this script is to show the possible trading points of BUY and SELL based on the 15-minute chart of the Nasdaq Future Index. The start point of the strategy was schedule for 2021/01/01 and until the time of this publication (2021/01/31), for 1 index contract the results presented area a Gross Profit of 2.97% with a Net Profit of 1.35%.
█ FEATURES
The indicator shows on the graph the position of the MACD and TSI indicators that are the places of strength among Buyers and Sellers.
It's possible to observe a sharp fall or rise in the price of these positions.
On the current candle, a label is displayed containing the value of the William %R Mod indicator, which will display the OverBought position (dark red) and OverSold position (dark green). The other colors like light red and green are the regions where the price makes the decision of which direction to go.
There are also other indicators:
a) The positions of the BUY (light green) and SELL areas (light red);
b) The label with the position of BUY (dark green) and SELL (dark red) with the line that connects these points;
c) DEMA 72 (orange);
d) EmaOchl4 in the color green for BULL and red for BEAR market;
e) Pivots high and low
f) Maximum (purple light) and minimum areas (blue light)
█ FUNCTIONS AND SETTINGS
The indicator uses the following functions:
(1) DEMA - Double Exponential Moving Average (08,17,34, 72)
(2) ema () - Exponential Moving Averge (72, ohlc4)
(3) plot()
(4) barcolor()
(5) cross()
(6) pivots ()
(7) William R% Md (OverBought = -7, OverSold=-93)
(8) Maximum and Minimum Value
(9) fill()
(10) macd () - Moving Average Convergence Divergence (Fast Lengt=12, Slow Length=26, Source=close, Signal Smoothing=9)
(11) tsi() - Trading Strenght Indicator==> Índice de Força Real ( IFR ) (Long Length=72, Short Length=17, Signal Length=17)
(12) Buy and Sell TRADE Points
█ PERFORMANCE AND ERRORS
The positions of BUY and SELL points are defined through the crossing of the Dema 34 candles with the Ema Ohcl4. As it is an indicator, it can present different positions from de market direction. Thus there is a need to observe the direction of the market in order to verify whether the indicate decision is really acceptable. The decision to BUY or SELL an asset must be well studied to avoid financial losses. The indicator will only help you in this decision, is your responsibility the decision of entering or leaving an asset.
█ THANKS TO
PineCoders for all they do, all the tools and help they provide, and their involvement in making a better community. All the PineCoders, Pine Pros, and Pine Wizards, people who share their work and knowledge for the sake of it and helping others, I'm very happy and grate full indeed.
█ NOTE
If you have any suggestions for improving the script or need help using it, please send a message in the comments

MACD controlled risk strategy exampleUsing a basic MACD as a signal this code is an example of how to base strategies around stops and calculated risk per trade rather than the more common approach of 'equity flipping' long and short for every trade and using an arbitrary %age stop which can leave you a bit exposed, lead to excessive drawdown and miss out on bigger sized positions for more profits.
scalping against trapped countertrendAbstract
This script attempts to find the end of countertrend.
This script uses oscillators to measure long term and short period trends. When the long term trend keeps positive and clear short term period is over, this script provides a buy signal.
This script does not contain pullback, cut loss and re-enter. You need to add it manually.
Introduction
Many traders want to buy when long term trend is bullish and short term pullback is over.
This is because we can take advantage to the emotion of countertrend traders.
Countertrend traders realizes their profit is finite and therefore want to protect their profit well and limit their loss.
This script is inspired by a searchable trading strategy video.
The video mentioned 4 points.
(1) long term trend. The video did not spend much ink on this point. You can use any method to observe.
(2) clear pullback bar (at least 50% body)
(3) weak bar after clear pullback
(4) entry trigger buy stop
This script attempts to quantize these points to determine trading direction.
This script is originally designed for timeframes lower than examples in the video but you can apply it on any timeframe.
Computing and Adjusting
(1) long term trend
This script uses smoothed stochastic.
(2) clear pullback bar
Since this script is originally designed for timeframes lower than examples in the video, so the condition becomes:
RSI is low enough
(3) weak bar after clear pullback
RSI goes back from low level.
(4) entry trigger buy stop
This script does not include this condition.
You can decide enter when buy stop or pullback.
Parameters
x_src : the value for computing oscillators
x_len_a : how many bars for measuring short term trend
x_len_b : how many bars for measuring long term trend
x_k_b : smooth long term trend, the average value of stochastic values
x_changk = check if clear short term pullback appears recently. 1 means do not use, larger numbers means how long of periods to check.
x_rsi_ct : threshold of short term pullback clear
x_rsi_ft : threshold of short term pullback end
Reading numbers in Strategy Tester
Most possible loss :
(1) to find rational pullback. Generally 1/3 to 2/3 atr.
(2) to find cut loss distance. Generally 1 to 2 atr.
Most possible profit :
to find if trading the opposite direction against this script is profitable.
Conclusion
This script can suggest us trading direction.
Waiting for pullback can reduce risk, compared to buy stop.
This script does not provide good signals in sideways markets.
Reference
A searchable trading strategy video

Combo Backtest 123 Reversal & Line Regression Intercept This is combo strategies for get a cumulative signal.
First strategy
This System was created from the Book "How I Tripled My Money In The
Futures Market" by Ulf Jensen, Page 183. This is reverse type of strategies.
The strategy buys at market, if close price is higher than the previous close
during 2 days and the meaning of 9-days Stochastic Slow Oscillator is lower than 50.
The strategy sells at market, if close price is lower than the previous close price
during 2 days and the meaning of 9-days Stochastic Fast Oscillator is higher than 50.
Second strategy
Linear Regression Intercept is one of the indicators calculated by using the
Linear Regression technique. Linear regression indicates the value of the Y
(generally the price) when the value of X (the time series) is 0. Linear
Regression Intercept is used along with the Linear Regression Slope to create
the Linear Regression Line. The Linear Regression Intercept along with the Slope
creates the Regression line.
WARNING:
- For purpose educate only
- This script to change bars colors.

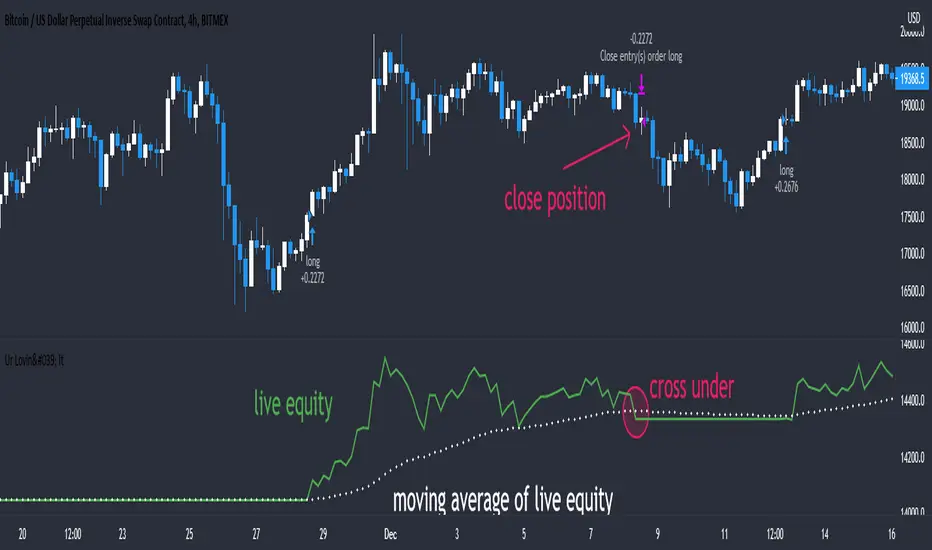
TradingView Alerts to MT4 MT5 - Forex, indices, commoditiesHowdy Algo-Traders! This example script has been created for educational purposes - to present how to use and automatically execute TradingView Alerts on real markets.
I'm posting this script today for a reason. TradingView has just released a new feature of the PineScript language - ALERT() function. Why is it important? It is finally possible to set alerts inside PineScript strategy-type script, without the need to convert the script into study-type. You may say triggering alerts straight from strategies was possible in PineScript before (since June 2020), but it had its limitations. Starting today you can attach alert to any custom event you might want to include in your PineScript code.
With the new feature, it is easier not only to execute strategies, but to maintain codebase - having to update 2 versions of the code with each single modification was... ahem... inconvenient. Moreover, the need to convert strategy into study also meant it was required to rip the code from all strategy...() calls, which carried a lot of useful information, like entry price, position size, and more, definitely influencing results calculated by strategy backtest. So the strategy without these features very likely produced different results than with them. While it was possible to convert these features into study with some advanced "coding gymnastics", it was also quite difficult to test whether those gymnastics didn't introduce serious, bankrupting bugs.
//////
How does this new feature work? It is really simple. On your custom events in the code like "GoLong" or "GoShort", create a string variable containing all the values you need inside your alert and this string variable will be your alert's message. Then, invoke brand new alert() function and that's it (see lines 67 onwards in the script). Set it up in CreateAlert popup and enjoy. Alerts will trigger on candle close as freq= parameter specifies. Detailed specification of the new alert() function can be found in TradingView's PineScript Reference (www.tradingview.com), but there's nothing more than message= and freq= parameters. Nothing else is needed, it is very simple. Yet powerful :)
//////
Alert syntax in this script is prepared to work with TradingConnector. Strategy here is not too complex, but also not the most basic one: it includes full exits, partial exits, stop-losses and it also utilizes dynamic variables calculated by the code (such as stop-loss price). This is only an example use case, because you could handle variety of other functionalities as well: conditional entries, pending entries, pyramiding, hedging, moving stop-loss to break-even, delivering alerts to multiple brokers and more.
//////
This script is a spin-off from my previous work, posted over a year ago here: Some comments on strategy parameters have been discussed there, but let me copy-paste most important points:
* Commission is taken into consideration.
* Slippage is intentionally left at 0. Due to shorter than 1 second delivery time of TradingConnector, slippage is practically non-existing.
* This strategy is NON-REPAINTING and uses NO TRAILING-STOP or any other feature known to be causing problems.
* The strategy was backtested on EURUSD 6h timeframe, will perform differently on other markets and timeframes.
Despite the fact this strategy seems to be still profitable, it is not guaranteed it will continue to perform well in the future. Remember the no.1 rule of backtesting - no matter how profitable and good looking a script is, it only tells about the past. There is zero guarantee the same strategy will get similar results in the future.
Full specs of TradingView alerts and how to set them up can be found here: www.tradingview.com

cRSI + Waves Strategy with VWMA overlayStrategy based on my cRSI with motive/corrective wave indicator. Please note that it is far from perfect. I use it mostly to help me identify good entry and exit points when combined with my other technical analysis. It misses some obvious points, but on average it does pretty well. The challenge often is indicating when you have sufficient change in the cRSI to know that the trend has changed, that means sometimes it can be a little early or late. It definitely helps take a lot of the guess work out of things. It works better on some equities than others and better on some time frames than others. You just have to play with it. At the minimum, it is a good template to learn how to write your own.

Combo Backtest 123 Reversal & Laguerre-based RSI This is combo strategies for get a cumulative signal.
First strategy
This System was created from the Book "How I Tripled My Money In The
Futures Market" by Ulf Jensen, Page 183. This is reverse type of strategies.
The strategy buys at market, if close price is higher than the previous close
during 2 days and the meaning of 9-days Stochastic Slow Oscillator is lower than 50.
The strategy sells at market, if close price is lower than the previous close price
during 2 days and the meaning of 9-days Stochastic Fast Oscillator is higher than 50.
Second strategy
This is RSI indicator which is more sesitive to price changes.
It is based upon a modern math tool - Laguerre transform filter.
With help of Laguerre filter one becomes able to create superior
indicators using very short data lengths as well. The use of shorter
data lengths means you can make the indicators more responsive to
changes in the price.
WARNING:
- For purpose educate only
- This script to change bars colors.

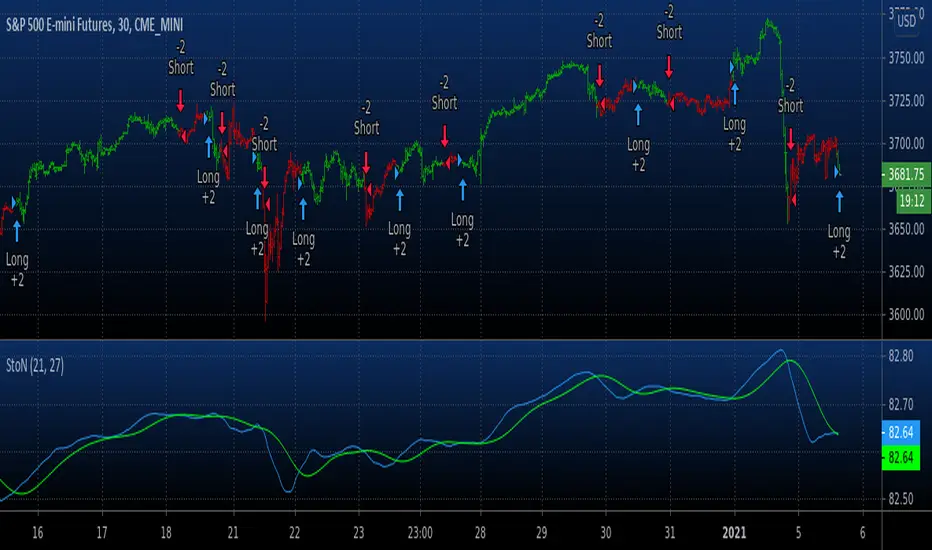
Combo Backtest 123 Reversal & Signal To Noise This is combo strategies for get a cumulative signal.
First strategy
This System was created from the Book "How I Tripled My Money In The
Futures Market" by Ulf Jensen, Page 183. This is reverse type of strategies.
The strategy buys at market, if close price is higher than the previous close
during 2 days and the meaning of 9-days Stochastic Slow Oscillator is lower than 50.
The strategy sells at market, if close price is lower than the previous close price
during 2 days and the meaning of 9-days Stochastic Fast Oscillator is higher than 50.
Second strategy
The signal-to-noise (S/N) ratio.
And Simple Moving Average.
WARNING:
- For purpose educate only
- This script to change bars colors.
Strategy- Double Decker RSIThis Strategy was LIVE coded during a webinar conducted by the author on 16-Jan-21 titled Backtesting in Tradingview. The system is named " Double Decker RSI ".
The rules of this strategy are:
LONG - RSI(5)>70 and RSI(14)>50 -- EXIT: RSI(5)<55
SHORT - RSI(5)<40 and RSI(14)<50 -- EXIT: RSI(5)>45
Instrument - BANKNIFTY - 1 HR Chart
The code is open source for you to edit and make changes as needed. For details on the strategy and webinar, you can refer to the website in signature of this strategy.

Ultimate Oscillator [Long] StrategyAfter I published Short Selling strategy with RSIofUO , I have been working for Long side strategy with same indicator.
but for Long strategy , I have used only the Ultimate Oscillator ... (Not the RSI of UO)
Logic behind this is , when UO goes below oversold level , high chance of possible reversal from there ...
Ultimate Oscialltor values , I have used are 5, 10 and 15
Signal Line 9
Above values are best/defaulted based on testing the strategy multiple symbols
BUY
when UO crossing up buyLine and close > open ( if the cross over is already done , it will wait for 3 candles to see a green bar i.e close>open )
Note when the bar color changes to orange , that means startegy is ready to take LONG position on next bar. But dont jump here , waith for the startegy take the Long Position :-)
Add
Signal appears when there is divergence (marked in yellow color ) ... strategy doesnt add the position , it is ony indicating you could add to existing OR if you missed the BUY signal you could enter here
Partial Exit
when UO crossing down partial exit level
Exit
When UO crossing down sell line
StopLoss
stop loss defaulted to 3%
Please note , I have slightly modified stop loss exit in this strategy.
Even though price hits 3% stoploss , strategy wont wind up the position ...
First , it will check if RSIofUO is above 30 , then it will hold on to the Long position.
Very reason behind this is , price is falling down and UO is going up ... That means there is bullish divergence here .. so it might turn this losing position to profitable one or will exit you with less than 3% loss.
Tested with SPY , QQQ , TSLA on 30mins to 4hrs. Though winning rate is average , net profit is exponential ...
Best working on 30 mins and 1 HR chart for QQQ
Warning
For the eductional purposes only ...
This is not a financial advise , before taking trading decission please do your own research

scalping low lag tema etalCredit for original idea goes to 1 min forex scalping by mikegoryunov
Changes include several lower lag filters (See line 3 for a list)
and values for profit, loss, and trail_points (See lines 48:53)
a, b, & c represent fast, medium, and slow filters. Basic idea is to monitor
crossovers of the three filters to determine buy/sells. Exits occur quickly within
the next time interval.
Note that this may be used for stocks and forex. The time interval can vary widely.
I have concerns about how to incorporate transaction costs with so many transactions.

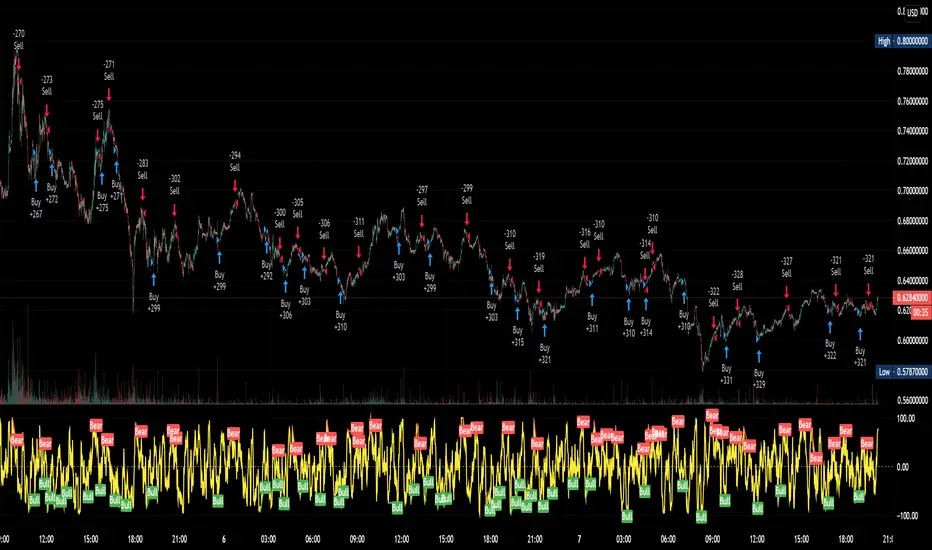
Momentum Strategy (BTC/USDT; 30m) - STOCH RSI (with source code)Here's a strategy for low time frames (30min suggested) for BTC , based on momentum Analysis using Stochastic RSI
By default the strategy will use the 50% of the specified capital for each trade; if "Gamble Sizing" is enabled, it will add the specified amount of capital (25% by default, until reaching the 100% limit or lower) for the next trade after having detected a loss in the previous trade; if the next trade is successful, the size for the next trade comes back to 50%
• Trend Filter LONG: If the fast exponential moving average is UNDER the slow exponential moving average , it won't open LONG positions
• Trend Filter SHORT: If the fast exponential moving average is ABOVE the slow exponential moving average , it won't open SHORT positions
• Bars delay: the strategy will wait the specified amount of bars before closing the current position; the counter is triggered as soon as the closing trade condition is verified
BY MAKING USE OF THIS STRATEGY, YOU ACKNOWLEDGE AND AGREE THAT: (1) YOU ARE AWARE OF THE RISKS ASSOCIATED WITH TRANSACTIONS OF DIGITAL CURRENCIES AND THEIR DERIVATIVES; (2) YOU SHALL ASSUME ALL RISKS RELATED TO THE USE OF THIS STRATEGY AND TRANSACTIONS OF DIGITAL CURRENCIES AND THEIR DERIVATIVES; AND (3) I SHALL NOT BE LIABLE FOR ANY SUCH RISKS OR ADVERSE OUTCOMES.
SOURCE CODE BELOW

Backtest Signal To Noise This source code is subject to the terms of the Mozilla Public License 2.0 at mozilla.org
© HPotter 05/01/2021
The signal-to-noise (S/N) ratio.
And Simple Moving Average.
Thank you for idea BlockchainYahoo
WARNING:
- For purpose educate only
- This script to change bars colors.
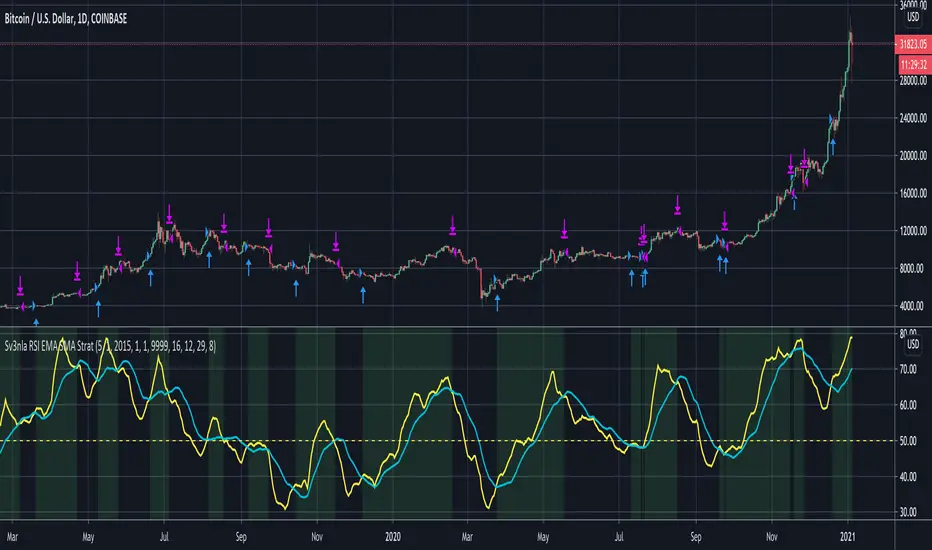
RSI EMA SMA StratThis script looks at the RSI EMA and RSI SMA crossovers when above a certain price EMA
It was mainly written for swingtrading and only for long positions on a daily timeframe for BTC and ETH. They idea is to have a script that indicates when to convert your BTC /ETC to a stable coin and when to buy in again.
You could try to use it for other positions (short, long, etc..) and other coins but I didn't test these.
When the RSI EMA & SMA hover around 50 for a few days in flat lines and you get a buy signal it may be best to wait a few days longer to see what direction they take.
The default values for RSI EMA , RSI SMA and price EMA gave the best return (start out with an amount of x coins in 2015 and end up with the biggest possible amount of coins today). Again, this was only tested on daily. Feel free to tweak these when using other timeframes or other coins
CHOP Zone Entry Strategy + DMI/PSAR ExitThis is a Strategy with associated visual indicators and Long/Short and Reverse/Close Position Alerts for the Choppiness Index (CHOP) . It is used to determine if the market is choppy (trading sideways) or not choppy (trading within a trend in either direction). CHOP is not directional, so a DMI script was ported into this strategy to allow for trend confirmation and direction determination; it consists of an Average Directional Index (ADX) , Plus Directional Indicator (+DI) and Minus Directional Indicator (-DI) . In addition, a Parabolic SAR is also included to act as a trailing stop during any strong trends.
Development Notes
---------------------------
This indicator, and most of the descriptions below, were derived largely from the TradingView reference manual. Feedback and suggestions for improvement are more than welcome, as well are recommended Input settings and best practices for use.
www.tradingview.com
www.tradingview.com
www.tradingview.com
Recommend using the below DMI and PSAR indicators in conjunction with this script to fully visualize and understand how entry and exit conditions are chosen. Variable inputs should correlate between the scripts for uniformity and visual compatibility.
THANKS to LazyBear and his Momentum Squeeze script for helping me quickly develop a momentum state model for coloring the Chop line by trend.
Strategy Description
---------------------------
CHOP produces values that determine whether the market is choppy or trending . The closer the value is to 100 , the higher the choppiness levels , while the closer it is to 0 , the stronger the market is trending . Territories for both levels, and their associated upper and lower thresholds, are popularly defined using the Fibonacci Retracements, 61.8 and 38.2.
Basic Use
---------------------------
CHOP is often used to confirm the market condition to help you stay out of sideways markets and only enter when there is movement or imminent explosions. When readings are above the upper threshold, continued sideways movement may be expected, while readings below the lower threshold are typically indicative of a continuing trend. It is also used to anticipate upcoming trendiness changes, with the general belief that extended periods of consolidation (sideways movement) are followed by extended periods of strong, trending, directional movement, and vice versa.
One limitation in this index is that you must be cautious in deciding whether the range or trend will likely continue, or if it will reverse.
Confidence in price action and trend is higher when two or more indicators are in agreement -- while this strategy combines CHOP with both DMI and PSAR, we would still recommend pairing with other indicators to determine entry or exit trade opportunities.
Recommend also choosing 'Once Per Bar Close' when creating alerts.
Inputs
---------------------------
Strategy Direction - an option to only trade Short, Long, Both, or only in the direction of the Trend (Follow Trend is the Default).
Sensitivity - an incremental variable to test whether the past n candles are in the same trend state before triggering a delayed long or short alert (1 is the Default). Can help filter out noise and reduces active alerts.
Show Chop Index - two visual styles are provided for user preference, a visible Chop line with a background overlay, or a compact column and label only view.
Chop Lookback Period - the time period to be used in calculating CHOP (14 is the Default).
Chop Offset - changing this number will move the CHOP either forwards or backwards relative to the current market (0 is the Default).
Smooth Chop Line and Length - if enabled, the entered time period will be used in calculating a smooth average of the index (Enabled and 4 are the Defaults).
Color Line to Trend Direction - toggles whether the index line is colored to visually depict the current trend direction (Enabled is the Default).
Color Background - toggles the visibility of a background color based on the index state (Enabled is the Default).
Enable DMI Option - if enabled, then entry will be confirmed by and dependent on the ADX Key Level, with any close or reversal confirmed by both ADX and +/-DI to determine whether there is a strong trend present or not (Enabled is the Default).
ADX Smoothing - the time period to be used in calculating the ADX which has a smoothing component (14 is the Default).
DI Length - the time period to be used in calculating the DI (14 is the Default).
ADX Key Level - any trade with the ADX above the key level is a strong indicator that it is trending (23 to 25 is the suggested setting).
Enable PSAR Option - enables trailing stop loss orders (Enabled is the Default).
PSAR Start - the starting value for the Acceleration Force (0.015 is our chosen Default, 0.02 is more common).
PSAR Increment - the increment in which the Acceleration Force will move (0.001 is our chosen Default, 0.02 is more common).
PSAR Max Value - the maximum value of the Acceleration Factor (0.2 is the Default).
Color Candles Option - an option to transpose the CHOP condition levels to the main candle bars. Note that the outer red and green border will still be distinguished by whether each individual candle is bearish or bullish during the specified timeframe.
Note too that if both DMI and PSAR are deselected, then close determinations will default to a CHOP reversal strategy (e.g., close long when below 38.2 and close short when above 61.8). Though if either DMI or PSAR are enabled, then the CHOP reversal for close determination will automatically be disabled.
Indicator Visuals
---------------------------
For the candle colors, black indicates tight chop (45 to 55), yellow is loose chop (38.2 to 45 and 55 to 61.8), dark purple is trending down (< 38.2), and dark blue is trending up (> 61.8).
The background color has additional shades to differentiate a wider range of more levels…
• < 30 is dark purple
• 30 to 38.2 is purple
• 38.2 to 45 is light purple
• 45 to 55 is black
• 55 to 61.8 is light blue
• 61.8 to 70 is blue
• > 70 is dark blue
Long, Short, Close, and Reverse labels are plotted on the Chop line, which itself can be colored based on the trend. The chop line can also be hidden for a clean and compact, columnar view, which is my preferred option (see example image below).
Visual cues are intended to improve analysis and decrease interpretation time during trading, as well as to aid in understanding the purpose of this strategy and how its inclusion can benefit a comprehensive trading plan.
DMI and Trend Strength
---------------------------
To analyze trend strength, the focus should be on the ADX line and not the +DI or -DI lines. An ADX reading above 25 indicates a strong trend , while a reading below 20 indicates a weak or non-existent trend . A reading between those two values would be considered indeterminable. Though what is truly a strong trend or a weak trend depends on the financial instrument being examined; historical analysis can assist in determining appropriate values.
DMI exits trade when ADX is below the user selected key level (e.g., default is 25) and when the +/- DI lines cross (e.g., -DI > +DI exits long position and +DI > -DI exits short position).
PSAR and Trailing Stop
---------------------------
PSAR is a time and price based indicator that excels at measuring direction and duration, though not the actual strength of a trend, which is why we use this in conjunction with DMI. It is also included in this script as a trailing stop option to maximize gains during strong trends and to mitigate any false ADX strengthening signals.
This creates a parabola that is located below the candle during a Bullish trend and above during a Bearish trend. A buy or reversal is signaled when the price crosses above or below the Parabolic SAR.
Long/Short Entry
---------------------------
1. CHOP must be over 61.8 (long) or under 38.2 (short).
2. If DMI is enabled, then the ADX signal line must be above the user selected Key Level (default is 25).
3. If Sensitivity is selected, then that past candle must meet the criteria in step 1, as well as all the intermediate candles in between.
4. If "Follow Trend" is selected and PSAR is enabled, then a long position can only open when the momentum and PSAR are in an uptrend, or short when both are in a downtrend, to include all intermediate candles if the Sensitivity option is set on a past candle.
Close/Reverse
---------------------------
1. If DMI is enabled, then a close flag will be raised when the ADX signal drops below the Key Level (of 25), and -DI crosses over +DI (if long), or +DI crosses over -DI (if short).
2. If PSAR is enabled, then a close flag will be raised when the current trend state is opposite the last state.
3. If both DMI and PSAR are disabled, then a close flag will be raised if the Chop line drops under 38.2 (if long) or goes over 61.8 (if short).
4. If a Long or Short Entry is triggered on the same candle as any of the above close flags, then the position will be reversed, else the position will be closed.
Strategy Alerts
---------------------------
1. Long Entry
2. Short Entry
3. Reverse
4. Close
The provided backtest result is based on a position sizing of 10% equity with 100k initial capital. When testing SPX, disabling the DMI performed the best, but EURUSD performed poorly without it enabled, and TSLA had a small reduction in net profit. Timeframe likewise differed between commodities with TSLA performing best at 30M, SPX at 15M, and EURUSD at 4H. I do not plan on using this as a standalone strategy, but I also was expecting better results with the inclusion of EMI and PSAR to compliment the CHOP. Key elements of this script will likely be included in future, more holistic strategies.
Disclaimer
---------------------------
Past performance may not be indicative of future results. Due to various factors, including changing market conditions, the strategy may no longer perform as well as in historical backtesting. This post and the script are not intended to provide any financial advice. Trade at your own risk.
No known repainting, though there may be if an offset is introduced in the Inputs. I did my best not to code any other variables that repaint, but cannot fully attest to this fact.

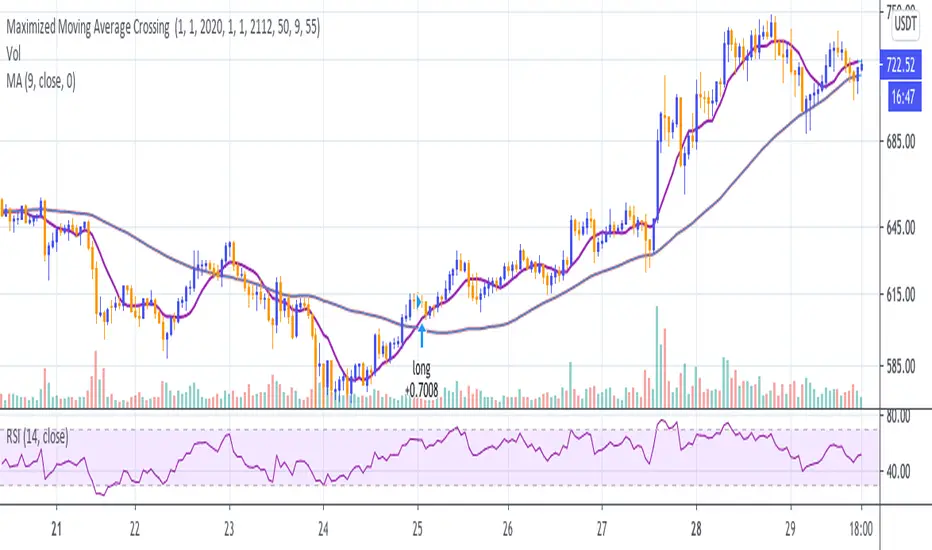
Maximized Moving Average Crossing (by Coinrule)Using the crossings of two Moving Averages to trade in a trading strategy is a Trend-Following approach. As the name would suggest, to be successful, it requires the asset to be on-trend.
The general limit of a common strategy based on Moving Averages is that they underperform when the market is less volatile or trading sideways. When volatility compresses, the indicators get very close one to another, crossing each other very often. That's exactly the condition when trend-following strategies underperform.
To improve this strategy, it's useful to filter the buy signal using the RSI. When the RSI is close to overbought conditions, that means that the coin is likely trading in an uptrend. Strong uptrends usually come with RSI values that stay overbought for long periods, creating interesting opportunities.
Setup
Buy condition: the MA9 crosses above the MA50, and at the same time, the RSI has a value greater than 55.
Sell condition: the MA9 crosses below the MA50.
The strategy is optimized to provide better results on the 1-hr time frame, but it could work well also on higher time frames, such as the 4-hrs.
The strategy assumes each order to trade 30% of the available capital and opens a trade at a time. A trading fee of 0.1% is taken into account.