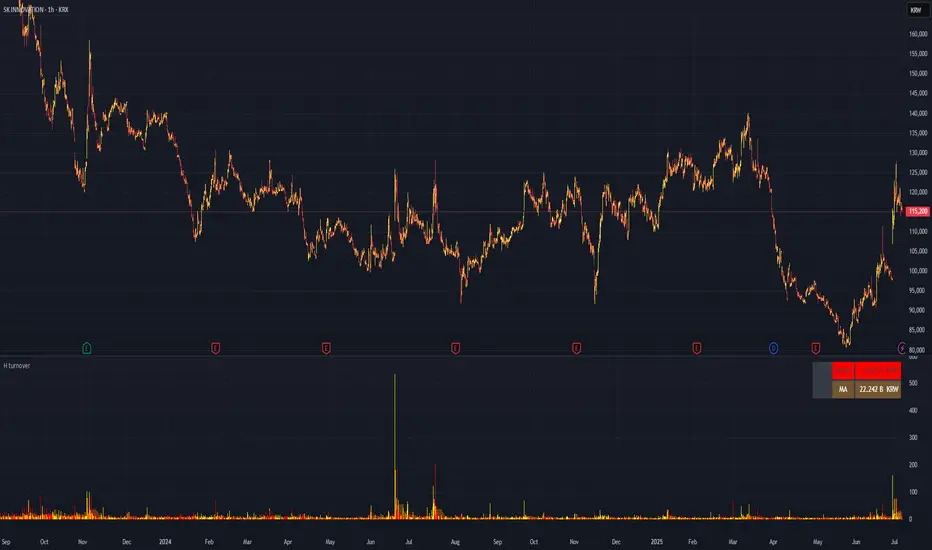
H turnoverTrading Value refers to the total monetary amount of all transactions for a particular stock or the entire market over a specific period. It is calculated by multiplying the trading volume (the number of shares traded) by the price at which they were traded. For example, if 10,000 shares of a stock are traded in a day at an average price of 50,000 KRW, the trading value for that day would be 500,000,000 KRW.
Key points about trading value:
Market Activity and Liquidity: A high trading value indicates an active and liquid market.
Flow of Investment Funds: Increasing trading value suggests more money is flowing into the market or a particular stock.
Relationship with Price Movements: When both trading value and price rise together, it often signals strong buying interest. Conversely, significant price changes with low trading value may be less reliable.
Market Sentiment Indicator: Changes in trading value can reflect shifts in investor interest and sentiment.
In summary, trading value is the total amount of money exchanged in trades and serves as an important indicator of market activity, liquidity, and investor sentiment.
Z-VALUE
Greer Book Value Yield📘 Script Title
Greer Book Value Yield – Valuation Insight Based on Balance Sheet Strength
🧾 Description
Greer Book Value Yield is a valuation-focused indicator in the Greer Financial Toolkit, designed to evaluate how much net asset value (book value) a company provides per share relative to its current market price. This script calculates the Book Value Per Share Yield (BV%) using the formula:
Book Value Yield (%) = Book Value Per Share ÷ Stock Price × 100
This yield helps investors assess whether a stock is trading at a discount or premium to its underlying assets. It dynamically highlights when the yield is:
🟢 Above its historical average (potentially undervalued)
🔴 Below its historical average (potentially overvalued)
🔍 Use Case
Analyze valuation through asset-based metrics
Identify buy opportunities when book value yield is historically high
Combine with other scripts in the Greer Financial Toolkit:
📘 Greer Value – Tracks year-over-year growth consistency across six key metrics
📊 Greer Value Yields Dashboard – Visualizes multiple valuation-based yields
🟢 Greer BuyZone – Highlights long-term technical buy zones
🛠️ Inputs & Data
Uses Book Value Per Share (BVPS) from TradingView’s financial database (Fiscal Year)
Calculates and compares against a static average yield to assess historical valuation
Clean visual feedback via dynamic coloring and overlays
⚠️ Disclaimer
This tool is for educational and informational purposes only and should not be considered financial advice. Always conduct your own research before making investment decisions.

Greer EPS Yield📘 Script Title
Greer EPS Yield – Valuation Insight Based on Earnings Productivity
🧾 Description
Greer EPS Yield is a valuation-focused indicator from the Greer Financial Toolkit, designed to evaluate how efficiently a company generates earnings relative to its current stock price. This script calculates the Earnings Per Share Yield (EPS%), using the formula:
EPS Yield (%) = Earnings Per Share ÷ Stock Price × 100
This yield metric provides a quick snapshot of valuation through the lens of profitability per share. It dynamically highlights when the EPS yield is:
🟢 Above its historical average (potentially undervalued)
🔴 Below its historical average (potentially overvalued)
🔍 Use Case
Quickly assess valuation attractiveness based on earnings yield.
Identify potential buy opportunities when EPS% is above its long-term average.
Combine with other indicators in the Greer Financial Toolkit for a fundamentals-driven investment strategy:
📘 Greer Value – Tracks year-over-year growth consistency across six key metrics
📊 Greer Value Yields Dashboard – Visualizes valuation-based yield metrics
🟢 Greer BuyZone – Highlights long-term technical buy zones
🛠️ Inputs & Data
Uses fiscal year EPS data from TradingView’s built-in financial database.
Tracks a static average EPS Yield to compare current valuation to historical norms.
Clean, intuitive visual with automatic color coding.
⚠️ Disclaimer
This tool is for educational and informational purposes only and should not be considered financial advice. Always conduct your own research before making investment decisions.

Lazarus Surge 1.0The "Lazarus Surge 1.0" Pine Script (version 6) is a TradingView indicator designed for detecting key market signals with a modern, edgy vibe. It identifies:
- Break of Structure (BOS): Plots "Long" (green, tiny, below candle) and "Short" (red, tiny, above candle) labels when price breaks pivot highs (in downtrends) or lows (in uptrends), with SL/TP levels (1:2 risk-reward). New BOS signals are suppressed for 23 candles to avoid clutter.
- Fair Value Gaps (FVG): Displays green (bullish) and red (bearish) boxes for price gaps, with adjustable sensitivity (0.05%) and optional removal when price fills the gap.
- Support/Resistance (S/R): Marks pivot lows with green "Support" labels/lines and pivot highs with purple "Resistance" labels/lines, persisting for 50 bars.
- Reversals: Shows "BLSH RVSL" (blue, tiny, below candle) and "BRSH RVSL" (orange, tiny, above candle) for engulfing or rejection patterns.
Features:
>No pivot points plotted, only used internally.
>All labels/lines scale with chart zoom.
>Signals clean up after ~2 hours (timeframe-adjusted), except S/R (50 bars).
>Uses max_boxes_count=500 to manage FVG rendering.
>Includes debug labels ("Bull FVG"/"Bear FVG") to confirm gap detection.
*This indicator is still under development. Use it at your own risk*

Dynamic VWAP: Fair Value & Divergence SuiteDynamic VWAP: Fair Value & Divergence Suite
Dynamic VWAP: Fair Value & Divergence Suite is a comprehensive tool for tracking contextual valuation, overextension, and potential reversal signals in trending markets. Unlike traditional VWAP that anchors to the start of a session or a fixed period, this indicator dynamically resets the VWAP anchor to the most recent swing low. This design allows you to monitor how far price has extended from the most recent significant low, helping identify zones of potential profit-taking or reversion.
Deviation bands (standard deviations above the anchored VWAP) provide a clear visual framework to assess whether price is in a fair value zone (±1σ), moderately extended (+2σ), or in zones of extreme extension (+3σ to +5σ). The indicator also highlights contextual divergence signals, including slope deceleration, weak-volume retests, and deviation failures—giving you actionable confluence around potential reversal points.
Because the anchor updates dynamically, this tool is particularly well suited for trend-following assets like BTC or stocks in sustained moves, where price rarely returns to deep negative deviation zones. For this reason, the indicator focuses on upside extension rather than symmetrical reversion to a long-term mean.
🎯 Key Features
✅ Dynamic Swing Low Anchoring
Continuously re-anchors VWAP to the most recent swing low based on your chosen lookback period.
Provides context for trend progression and overextension relative to structural lows.
✅ Standard Deviation Bands
Plots up to +5σ deviation bands to visualize levels of overextension.
Extended bands (+3σ to +5σ) can be toggled for simplicity.
✅ Conditional Zone Fills
Colored background fills show when price is inside each valuation zone.
Helps you immediately see if price is in fair value, moderately extended, or highly stretched territory.
✅ Divergence Detection
VWAP Slope Divergence: Flags when price makes a higher high but VWAP slope decelerates.
Low Volume Retest: Highlights weak re-tests of VWAP on low volume.
Deviation Failure: Identifies when price reverts back inside +1σ after closing beyond +3σ.
✅ Volume Fallback
If volume is unavailable, uses high-low range as a proxy.
✅ Highly Customizable
Adjust lookbacks, show/hide extended bands, toggle fills, and enable or disable divergences.
🛠️ How to Use
Identify Buy and Sell Zones
Price in the fair value band (±1σ) suggests equilibrium.
Reaching +2σ to +3σ signals increasing overextension and potential areas to take profits.
+4σ to +5σ zones can be used to watch for exhaustion or mean-reversion setups.
Monitor Divergence Signals
Use slope divergence and deviation failures to look for confluence with overextension.
Low volume retests can flag rallies lacking conviction.
Adapt Swing Lookback
30–50 bars: Faster re-anchoring for swing trading.
75–100 bars: More stable anchors for longer-term trends.
🧭 Best Practices
Combine the anchored VWAP with higher timeframe structure.
Confirm signals with other tools (momentum, volume profiles, or trend filters).
Use extended deviation zones as context, not as standalone signals.
⚠️ Disclaimer
This script is for educational and informational purposes only. It does not constitute financial advice or a recommendation to buy or sell any security or asset. Always do your own research and consult a qualified financial professional before making any trading decisions. Past performance does not guarantee future results.

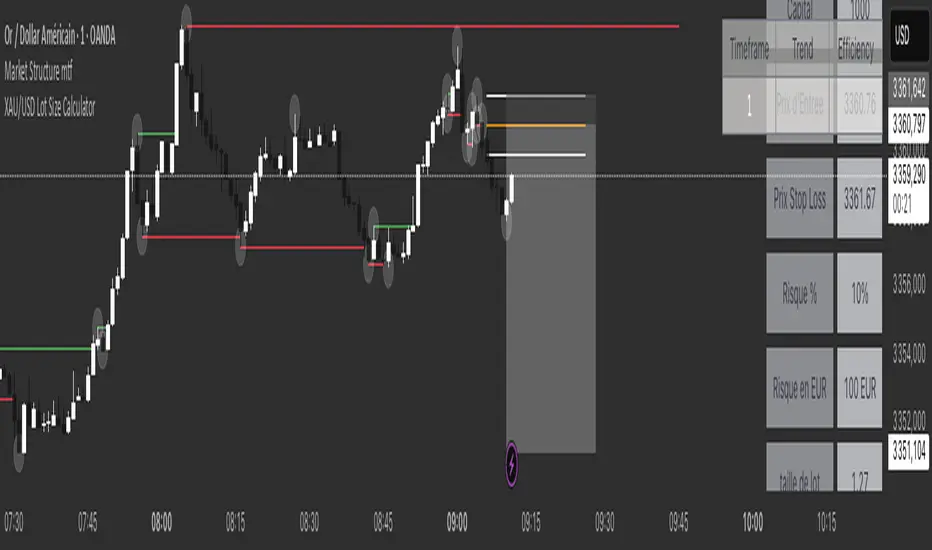
XAU/USD Lot Size CalculatorThis indicator automatically calculates the optimal lot size for XAUUSD (gold) based on the level of risk the trader wants to take. It is designed for traders using MetaTrader 4 or 5 and helps adjust position size according to the specific volatility of gold. The user can set the percentage of capital they are willing to risk on a single trade, for example 1%. The indicator also takes into account the stop loss level, which can be entered in pips or in dollars, as well as the account size (balance or equity).
Based on these parameters, it calculates the exact lot size that matches the risk amount. It then displays on the chart the recommended lot size, the risk amount in dollars, the pip value for XAUUSD, and a confirmation of the stop loss level. This type of indicator is useful for maintaining disciplined risk management and avoiding position sizing errors, especially on a highly volatile asset like gold.
Multi Horizontal Lines 1000 Bars
This indicator is not my code, I have copied this from another user and extened the lines so they go back 1000 bars for back testing.
I use this indicator to trade Crude Oil and set the horizontal lines to 20 cents increments, 0.2 is 20 cents. You can change the horizontal lines to any price distance to suit your style of trading.
My idea is when price crosses over a horizontal line I will enter a trade long or short looking to secure 20 cents.

[DEM] % Off High % Off High calculates and plots the percentage difference between the current closing price and the all-time high of the given ticker observed since the indicator started calculating. It is displayed as a percentage, formatted with two decimal places.

Fair value - NASDAQ - 1WUS100 true value based on underlying top stocks. It gives you insight into the true trend of the index. Use in combination with other indicators (such as EMA and enter ideally 200-400 ticks below highest imbalance).
Familiarise yourself with it, it's not a magic wand and won't instantly help you unless you know how to use it properly.

TPO[Fixed Range, Anchored, Bars Back]TPO Bars Back, Fixed Range and Anchored
Overview
The TPO Profile (Time Price Opportunity Profile) is a powerful market profile indicator that displays the amount of time price spent at different levels during a specified period. Unlike traditional volume profile indicators that show volume distribution, TPO Profile shows time distribution , providing insights into where price has spent the most time and identifying key support and resistance levels.
Key Advantages Over TradingView's Built-in TPO
Simplified Composite Creation : Automatically creates TPO profiles for any time range without manual split/merge operations
Instant Value Area Calculation : Immediately shows Value Area, POC, VAH, and VAL for your selected period
No Manual Assembly Required : TradingView's native TPO requires you to manually split sessions and merge them to create composites - this indicator does it automatically
Flexible Time Ranges : Create composites for any custom time period (multiple days, weeks, specific events) with a few clicks
Real-time Composite Updates : Anchor mode creates live composites that update as new data arrives
Multiple Composite Analysis : Easily compare different time periods without the tedious manual process
Key Features
Core Functionality
Time-Based Analysis : Shows time spent at each price level rather than volume
Configurable Time Blocks : Use any timeframe for TPO counting (30min, 1H, 4H, etc.)
Multiple Price Levels : Adjustable from 5 to 200 levels for granular analysis
Point of Control (POC) : Automatically identifies the price level with highest time activity
Value Area Calculation : Shows the price range containing 70% (configurable) of time activity
Automatic Composite Generation : Creates multi-session composites without manual intervention
Three Operating Modes
1. Bars Back Mode
Analyzes the last N bars from the current bar
Perfect for recent market activity analysis
Range: 10-500 bars
Use Case : Intraday analysis, recent session review
2. Fixed Range Mode
Analyzes a specific time period between start and end times
Ideal for historical analysis of specific events
Creates perfect composites for multi-day periods
Use Case : Earnings periods, news events, specific trading sessions, weekly/monthly composites
3. Anchor Mode (NEW)
Starts from a specific time and extends to the current bar
Dynamically updates as new bars form
Perfect for building live composites from any starting point
Use Case : Live session monitoring, event-based analysis from a specific point, growing composites
Visual Elements
TPO Bars
Horizontal bars showing time distribution at each price level
Longer bars = more time spent at that level
Color-coded to distinguish Value Area from outlying levels
Point of Control (POC)
Red line marking the price level with highest time activity
Most significant support/resistance level
Configurable line style (Solid/Dashed/Dotted) and width
Value Area High/Low (VAH/VAL)
Green and Orange lines marking the boundaries of the Value Area
Shows the price range containing the specified percentage of time activity
Optional display with customizable line styles
Single Print Detection
Identifies price levels touched by only one time block
Display options: Lines or Boxes
Purple color highlighting these significant levels
Often act as strong support/resistance in future trading
Customization Options
Time Block Configuration
Block Time : Choose timeframe for TPO counting (30min, 1H, 4H, etc.)
Allows analysis at different time granularities
Higher timeframes = broader perspective, Lower timeframes = finer detail
Visual Styling
Line Styles : Solid, Dashed, or Dotted for all line elements
Line Widths : 1-5 pixels for POC, VAH, and VAL lines
Colors : Fully customizable colors for all elements
Transparency : Adjustable transparency for better chart readability
Label Management
Show/Hide Labels : Toggle POC, VAH, VAL labels
Font Sizes : Tiny, Small, Normal, Large, Huge
Label Positioning : 8 different position options relative to lines
Offset Controls : Fine-tune label positioning
Line Extension
Level Offset Right : Controls how far lines extend
Smart extension logic:
Value ≤ 0: Infinite extension (extend.right)
Value ≥ 1: Extends exactly N bars ahead
Trading Applications
Support & Resistance
POC often acts as strong support/resistance
Value Area boundaries provide key levels
Single prints frequently become significant levels
Market Structure Analysis
Identify areas of price acceptance (thick TPO bars)
Spot areas of price rejection (thin TPO bars)
Understand where market participants are comfortable trading
Composite Profile Analysis
Create multi-day, weekly, or monthly composites instantly
Compare different composite periods without manual work
Analyze longer-term price acceptance levels
Build composites around specific events or announcements
Session Analysis
Monitor intraday session development in real-time
Compare different sessions (London, New York, Asia)
Track how profiles change throughout the trading day
Build live composites across multiple sessions
Event Analysis
Use Fixed Range mode for earnings, news events
Use Anchor mode to track price development from specific events
Compare pre/post event price acceptance levels
Create event-based composites automatically
Input Parameters
Mode Selection
Mode : Bars Back | Fixed Range | Anchor
Bars Back : Number of bars to analyze (10-500)
Start Time : Beginning time for Fixed Range and Anchor modes
End Time : Ending time for Fixed Range mode only
Analysis Configuration
Block Time : Timeframe for TPO blocks (e.g., "30" for 30-minute blocks)
TPO Levels : Number of price levels (5-200)
Value Area % : Percentage for Value Area calculation (50-95%)
Display Options
Show POC : Display Point of Control line
Show Value Area : Display Value Area box
Show VAH/VAL Lines : Display Value Area boundary lines
Show Single Prints : Display single print detection
Single Print Style : Lines or Boxes
Styling Controls
Colors : TPO, POC, Value Area, VAH, VAL, Single Print colors
Line Styles : POC, VAH, VAL line styles
Line Widths : POC, VAH, VAL line widths
Labels : Show/hide, font size, position, offset controls
Technical Details
Calculation Method
Divides the price range into equal levels based on TPO Levels setting
For each time block, determines which price levels it crosses
Adds +1 count to each crossed level
Identifies POC as the level with highest count
Calculates Value Area by expanding from POC until target percentage is reached
Performance Considerations
Historical data limited to prevent buffer overflow errors
Smart bounds checking for different timeframes
Optimized cleanup routines to prevent drawing object accumulation
Pine Script Version
Built on Pine Script v6
Uses modern Pine Script best practices
Efficient array handling and drawing object management
Best Practices
Timeframe Selection
Block Time = Chart Timeframe : Traditional TPO approach
Block Time > Chart Timeframe : Smoother, broader perspective
Block Time < Chart Timeframe : More granular, detailed analysis
Level Count Guidelines
Low levels (10-20) : Better for swing trading, major levels
High levels (50-100) : Better for scalping, precise entries
Very high levels (100+) : For very detailed analysis
Mode Selection
Bars Back : Daily analysis, recent activity
Fixed Range : Historical events, specific periods, manual composites
Anchor : Live monitoring, event-based analysis, growing composites
Composite Creation Workflow
Select Fixed Range or Anchor mode
Set your desired start time (and end time for Fixed Range)
Adjust TPO Levels for desired granularity
Enable VAH/VAL lines to see Value Area boundaries
The composite profile generates automatically with all key levels
This indicator eliminates the tedious manual process of creating composite TPO profiles in TradingView. Instead of splitting sessions and manually merging them, you get instant composite analysis with automatic Value Area calculation, POC identification, and single print detection. The combination of time-based analysis, multiple operating modes, and extensive customization options makes it a powerful tool for understanding market structure and price acceptance levels across any time period.

Visual SL/TP con ATR + Pips/TicksThis indicator automatically displays the current ATR size along with suggested SL (Stop Loss) and TP (Take Profit) values, expressed in key units such as pips and ticks.
✅ Compatible with:
Forex (e.g., EURUSD)
Indices (e.g., NAS100, US30)
Gold (XAUUSD)
Cryptocurrencies (e.g., XRPUSDT)
🎯 Ideal for scalping, intraday, or swing trading.
🧠 Saves calculation time and improves trading speed.
Includes:
Automatic SL/TP calculation based on ATR multiples
Conversion to pips and ticks for quick reading
Dynamic support for different instrument types
📌 Tip: Use this indicator alongside your entry strategy with EMAs or volume for more precise trading.

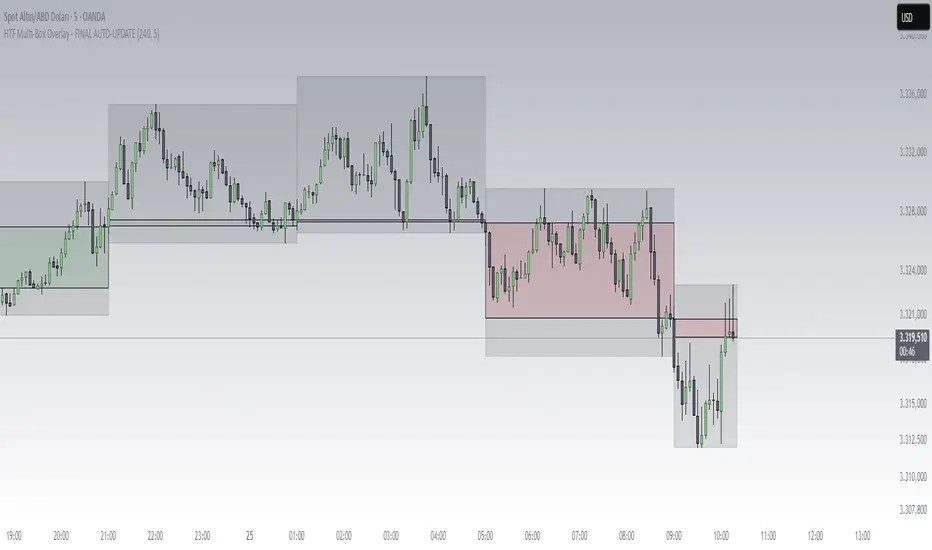
HTF Box Range Overlay - FIXEDThis script overlays higher timeframe candles (e.g. 4H) onto lower timeframe charts (e.g. 5min), showing both the body and wick ranges of the last N HTF candles.
Features:
✔ Displays both candle body and wick as separate shaded boxes
✔ Fully customizable for bullish/bearish colors and wick appearance
✔ Supports any higher timeframe (15m, 1H, 4H, 1D, etc.)
✔ Clean overlay with no performance lag
✔ Automatically adjusts in real-time as new candles form
Great for traders using HTF zones, supply/demand, or structure-based confluence. Works best when used on intraday charts.
Greer Revenue Yield📊 Greer Revenue Yield – RPS%
Author: Sean Lee Greer
Date Published: June 23, 2025
🔍 Overview
The Greer Revenue Yield indicator evaluates a stock's Revenue Per Share Yield (RPS%), giving investors a unique lens into how much top-line revenue a company produces per share relative to its stock price. This can help identify under- or over-valued conditions based on fundamental efficiency.
Revenue per Share = Total Revenue ÷ Shares Outstanding
Revenue Yield (%) = Revenue per Share ÷ Stock Price × 100
A simple yet powerful valuation metric, dynamically visualized with smart coloring:
🟢 Green = Yield is above average (potential value opportunity)
🔴 Red = Yield is below average (potentially overvalued)
🧠 Use Case
Use this tool to assess whether a company’s price justifies its revenue output on a per-share basis. Especially useful in combination with other indicators in the Greer Financial Toolkit:
📘 Greer Value – Tracks year-over-year growth consistency across 6 key financial metrics
📊 Greer Value Yields Dashboard – Visualizes multiple valuation-based yields
🟢 Greer BuyZone – Identifies long-term technical entry points based on trend cycles and valuation zones
⚠️ Disclaimer
This script is for educational purposes only and should not be considered financial advice. Always conduct your own research or consult a financial advisor before making investment decisions.

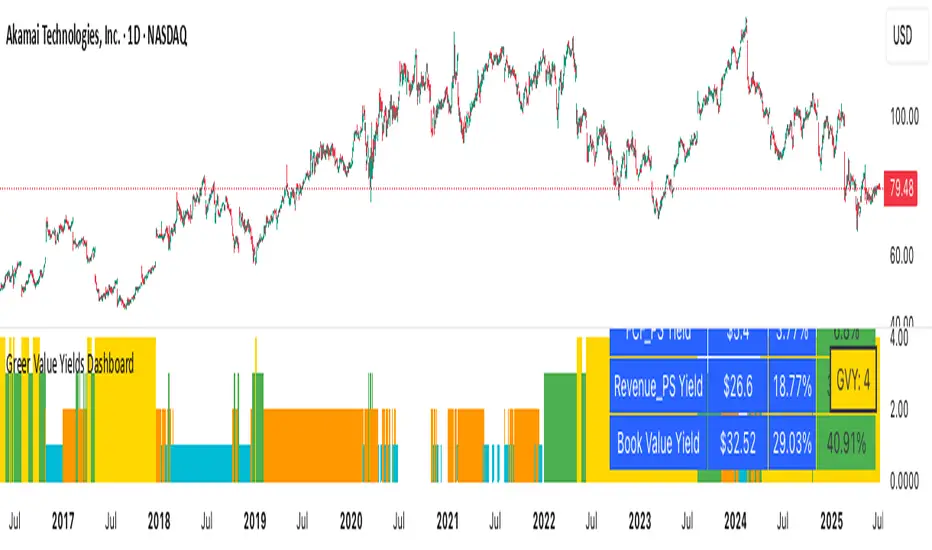
Greer Value Yields Dashboard🧾 Greer Value Yields Dashboard – v1.0
Author: Sean Lee Greer
Release Date: June 22, 2025
🧠 Overview
The Greer Value Yields Dashboard visualizes and evaluates four powerful valuation metrics for any publicly traded company:
📘 Earnings per Share Yield
💵 Free Cash Flow Yield
💰 Revenue Yield
🏦 Book Value Yield
Each yield is measured as a percentage of current stock price and compared against its historical average. The script assigns 1 point per metric when the current yield exceeds its long-term average. The total score (0 to 4) is displayed as a color-coded column chart, helping long-term investors quickly assess fundamental valuation strength.
✅ Key Features
📊 Real-time calculation of 4 yield-based valuation metrics
⚖ Historical average tracking for each yield
🎯 Visual scoring system:
🟥 0–1 = Weak
🟨 2 = Neutral
🟩 4 = Strong (all metrics above average)
🎛️ Toggle visibility of each yield independently
🧮 Fully compatible with other Greer Financial Toolkit indicators
🛠 Ideal For
Long-term value investors
Dividend and cash-flow-focused investors
Analysts seeking clean yield visualizations
Greer Toolkit users combining with Greer Value and BuyZone
Greer Free Cash Flow Yield✅ Title
Greer Free Cash Flow Yield (FCF%) — Long-Term Value Signal
📝 Description
The Greer Free Cash Flow Yield indicator is part of the Greer Financial Toolkit, designed to help long-term investors identify fundamentally strong and potentially undervalued companies.
📊 What It Does
Calculates Free Cash Flow Per Share (FY) from official financial reports
Divides by the current stock price to produce Free Cash Flow Yield %
Tracks a static average across all available financial years
Color-codes the yield line:
🟩 Green when above average (stronger value signal)
🟥 Red when below average (weaker value signal)
💼 Why It Matters
FCF Yield is a powerful metric that reveals how efficiently a company turns revenue into usable cash. This can be a better long-term value indicator than earnings yield or P/E ratios, especially in capital-intensive industries.
✅ Best used in combination with:
📘 Greer Value (fundamental growth score)
🟢 Greer BuyZone (technical buy zone detection)
🔍 Designed for:
Fundamental investors
Value screeners
Dividend and FCF-focused strategies
📌 This tool is for informational and educational use only. Always do your own research before investing.

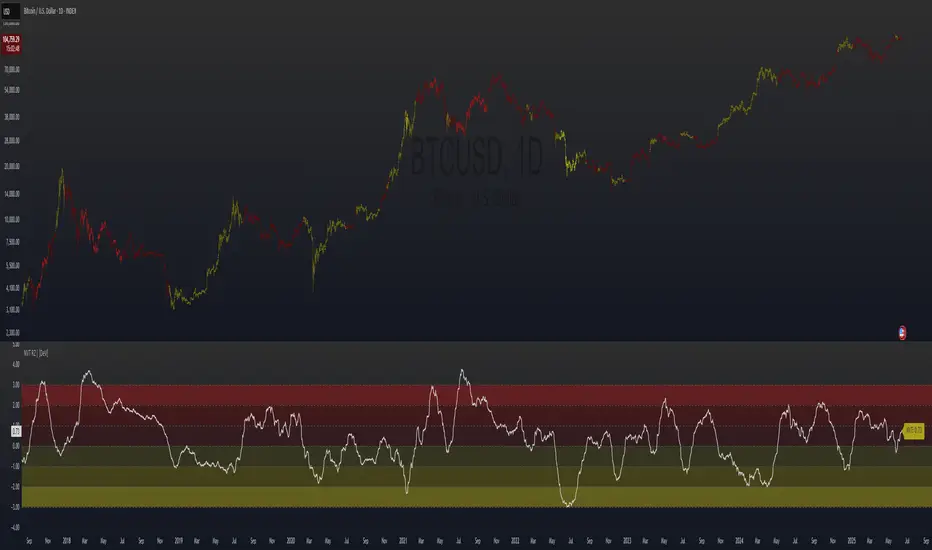
NVT Ratio Z-Score | [DeV]** DISCLAIMER: This indicator is not trend following, so it SHOULD NOT be a buy/sell signal or used as a stand alone indicator to tell you to buy or sell. It's simply giving insight into potential overbought or oversold market conditions, and should be used in conjunction with other market analysis tools to give you an idea of possible market reversals.**
The NVT Ratio Z-Score is a unique on-chain valuation tool that helps users assess whether Bitcoin is potentially overbought or oversold relative to its network fundamentals. This indicator calculates the Network Value to Transactions (NVT) ratio, which compares Bitcoin’s market capitalization (price × circulating supply) to the USD-denominated daily transaction volume on the network. To improve clarity and remove short-term noise, the NVT value is smoothed using a customizable moving average (NVT Smoothing Period). The smoothed value is then normalized using a Z-score over a rolling period (Normalization Lookback Period), allowing for easier comparison of extreme deviations over time. This normalization makes it possible to spot historically high or low valuation zones with consistency.
While the NVT Ratio Z-Score is not a price action or trend-following indicator, it excels as a valuation-based supplemental tool. By using this indicator alongside your existing technical setups—such as momentum oscillators (like RSI or MACD), moving averages, or volume profiles—you can gain a deeper perspective on whether the broader market is operating in an overheated or undervalued state.
Interpretation is straightforward: the lower the Z-score dips into negative territory, the more oversold the market may be, potentially indicating a bottoming process or future upward reversal. Conversely, higher Z-scores suggest the market is becoming overheated or overbought, which can precede pullbacks or broader downtrends. However, it’s crucial to remember: this is not a trend indicator. Overbought conditions don’t guarantee immediate downturns, and oversold conditions don’t guarantee immediate rallies. Markets can remain extended in either direction for prolonged periods.
Use the NVT Ratio Z-Score to contextualize price moves and strengthen conviction when your other tools show signals aligning with extreme valuation zones. This indicator is especially helpful for swing traders, long-term investors, and those analyzing Bitcoin through a macro-on-chain lens.
Discount to Net Asset ValueOverview
This indicator helps investors and analysts identify when a company’s stock is trading below or above its intrinsic value. A persistent discount may highlight potential value opportunities, while a sustained premium could signal overvaluation or strong market sentiment. By visually shading the background and plotting the discount/premium percentage, users can quickly screen for undervalued stocks, confirm fundamental research, and make more informed buy or sell decisions.
Usage
Calculates the Net Asset Value discount (or premium) for any symbol.
By default the indicator uses the current chart symbol’s TOTAL_ASSETS, TOTAL_LIABILITIES, and TOTAL_SHARES_OUTSTANDING.
You can select another symbol by checking “Use Custom Symbol” and entering the ticker of the other symbol. This is useful for comparing the Discount to NAV across symbols.
Shows the percentage discount (or premium) of market capitalization relative to net asset value.
Recommended timeframes: daily bars or higher.
Reporting Periods:
• FQ = Fiscal Quarter
• FY = Fiscal Year
• TTM = Trailing Twelve Months
Note: NAV is pulled on the chosen reporting period (FQ, FY, TTM).
By default the background is shaded red to illustrate a discount to NAV and green to illustrate a premium to NAV. This can be toggled in the settings.

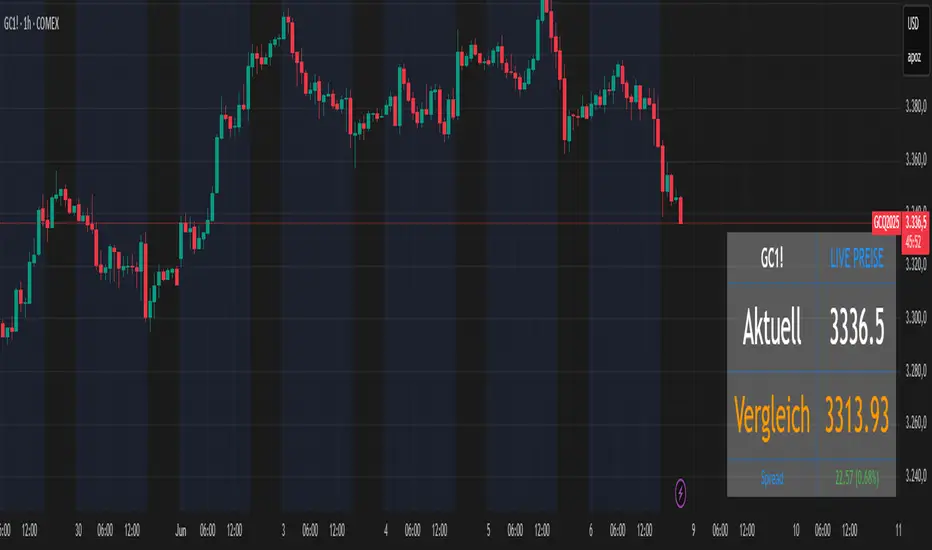
Futures vs CFD Price Display
🎯 Trading the same asset in CFDs and Futures but tired of switching charts to compare prices? This is your indicator!
Stop the constant chart hopping! This live price comparison shows you instantly where the better conditions are.
✨ What you get:
Bidirectional: Works in both Futures AND CFD charts
Live prices: Real-time comparison of both markets
Spread calculation: Automatic difference in points and percentage
Fully customizable: Colors, position, size to your liking
Professional design: Clean display with symbol header
🎯 Perfect for:
Gold traders (Futures vs CFD)
Arbitrage strategies
Spread monitoring
Multi-broker comparisons
⚙️ Customization:
3 sizes (Small/Normal/Large) for all screens
4 positions available
Individual color schemes
Toggle features on/off
💡 Simply enter the symbol and keep both markets in sight!
Notice: "Co-developed with Claude AI (Anthropic) - because even AI needs to pay the server bills! 😄"
COT Commitment of Traders IndexOVERVIEW
Commitment of Traders (COT) Indicator is a trading tool which designed to visualise net positions/commitment of traders that is reported weekly basis to the commissions.
CONCEPTS
The Indicator help you understand the position of long or short trades by market participants relative to their historical positioning. The change in position will help you in analysing the medium-to-long term market trend.
The commercial traders represents producers or consumers of the commodity that usually positions as hedgers in the market, protecting their asset over market fluctuation risk. The non-commercial traders represents fund or money managers that the goal is speculate and take profit from the market fluctuations. Non-reportable represents small or retail traders.
Understand the relative of those all traders will give better insight of how to positions ourselves in the market.
DETAILS & EXAMPLE OF HOW TO USE
An example of Gold Future chart (GC1!) to demonstrate the indicator in real market scenario.
Blue graph indicate the Commercial Index, showing on the extreme low under 20 level. Commercial traders as a hedgers indicate the turning point over an asset in extreme value. This showing the potential change in market direction the upside.
On the same time, Orange graph indicate the Non-Commercial Index, showing an extreme high level above 80. Non-Commercial traders will most of the time trade with the trend. This showing the potential continuation of market direction to the upside.
Base on those information, combine with other technical strategy on the same timeframe or even lower timeframe. For example using Supply & Demand to find the entry.
The result is a massive push to the upside in the long term direction.
FEATURES
3 Index in 1 indicator
Customisable historical period and threshold
LIMITATIONS
The Indicator is best applied on weekly, due to the weekly release of COT data.
Not intended as a stand-alone signal, but should be as part of long-term strategy analysis.
Should be combined with other lower-timeframe technical tools like supply and demand.

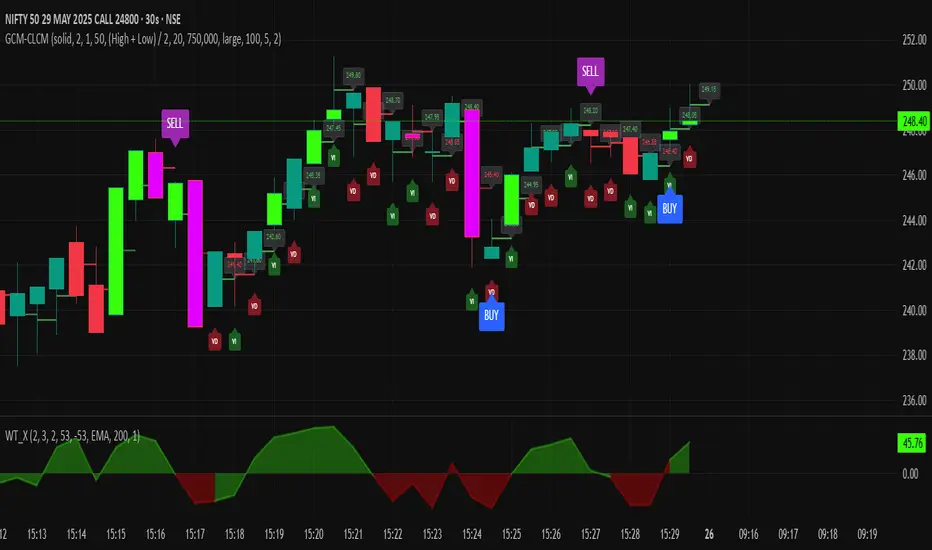
GCM Centre Line Candle MarkerGCM Centre Line Candle Marker (GCM-CLCM) - Descriptive Notes
Indicator Overview:
The "GCM Centre Line Candle Marker" is a versatile TradingView overlay indicator designed to enhance chart analysis by drawing short horizontal lines at user-defined "centre" points of candles. These lines provide a quick visual reference to key price levels within each candle, such as midpoints, open, close, or typical prices. The indicator offers extensive customization for line appearance, positioning, and conditional display, including an option to highlight only bullish engulfing patterns.
Key Features:
1. Customizable Line Position:
o Users can choose from various methods to calculate the "centre" price for the line:
(High + Low) / 2 (Default)
(Open + Close) / 2
Close
Open
(Open + High + Low + Close) / 4 (HLCO/4)
(Open + High + Close) / 3 (Typical Price HLC/3 variation)
(Open + Close + Low) / 3 (Typical Price OCL/3 variation)
2. Line Appearance Customization:
o Visibility: Toggle lines on/off.
o Style: Solid, dotted, or dashed lines.
o Width: Adjustable line thickness (1 to 5).
o Length: Defines how many candles forward the line extends (1 to 10).
o Color: Lines are colored based on candle type (bullish/bearish), with user-selectable base colors.
o Dynamic Opacity: Line opacity is dynamically adjusted based on the candle's size relative to recent candles. Larger candles produce more opaque lines (up to the user-defined maximum opacity), while smaller candles result in more transparent lines. This helps significant candles stand out.
3. Price Labels:
o Show Labels: Option to display price labels at the end of each center line.
o Label Background Color: Customizable.
o Dynamic Text Color: Label text color can change based on the movement of the center price:
Green: Current center price is higher than the previous.
Red: Current center price is lower than the previous.
Gray: No change or first label.
o Static Text Color: Alternatively, a fixed color can be used for all labels.
4. Conditional Drawing - Bullish Engulfing Filter:
o Users can enable an option to Only Show Bullish Engulfing Candles. When active, center lines will only be drawn for candles that meet bullish engulfing criteria (current bull candle's body engulfs the previous bear candle's body).
5. Performance Management:
o Max Lines to Show: Limits the number of historical lines displayed on the chart to maintain clarity and performance. Older lines are automatically removed as new ones are drawn.
6. Alert Condition:
o Includes a built-in alert: Big Bullish Candle. This alert triggers when a bullish candle's range (high - low) is greater than the 20-period simple moving average (SMA) of candle ranges.
How It Works:
• For each new candle, the script calculates the "center" price based on the user's Line Position selection.
• If showLines is enabled and (if applicable) the bullish engulfing condition is met, a new line is drawn from the current candle's bar_index at the calculated _center price, extending lineLength candles forward.
• The line's color is determined by whether the candle is bullish (close > open) or bearish (close < open).
• Opacity is calculated dynamically: scaledOpacity = int((100 - maxUserOpacity) * (1 - dynamicFactor) + maxUserOpacity), where dynamicFactor is candleSize / maxSize (current candle size relative to the max size in the last 20 candles). This means maxUserOpacity is the least transparent the line will be (for the largest candles), and smaller candles will have lines approaching full transparency.
• Optional price labels are added at the end of these lines.
• The script manages an array of drawn lines, removing the oldest ones if the maxLines limit is exceeded.
Potential Use Cases:
• Visualizing Intra-Candle Levels: Quickly see midpoints or other key price points without manual drawing.
• Short-Term Reference Points: The extended lines can act as very short-term dynamic support/resistance or points of interest.
• Pattern Recognition: Highlight bullish engulfing patterns or simply emphasize candles based on their calculated center.
• Volatility Indication: The dynamic opacity can subtly indicate periods of larger or smaller candle ranges.
• Confirmation Tool: Use in conjunction with other indicators or trading strategies.
User Input Groups:
• Line Settings: Controls all aspects of the line's appearance and calculation.
• Label Settings: Manages the display and appearance of price labels.
• Other Settings: Contains options for line management and conditional filtering (like Bullish Engulfing).
This indicator provides a clean and customizable way to mark significant price levels within candles, aiding traders in their technical analysis.
FVG Candle HighlighterThis indicator highlights only the true Fair Value Gap (FVG) creator candle — the middle candle in a 3-bar FVG formation — with zero clutter.
🔹 Bullish FVG: Candle is colored if price gaps above the high two bars back
🔹 Bearish FVG: Candle is colored if price gaps below the low two bars back
✨ No boxes. No zones. Just pure, visual price-action accuracy.
🔧 Powered by Pine Script v6
🧠 Based on institutional-style FVG logic
🎯 Ideal for Smart Money / ICT / Order Block strategies

QoQ PAT, Sales & OPM% Labels by GauravThis indicator automatically displays the Quarter-over-Quarter (QoQ) percentage change in Sales, PAT (Profit After Tax), and Operating Profit Margin (OPM%) directly on the price chart.
It fetches quarterly financial data using TradingView’s request.financial() function for:
Sales (TOTAL_REVENUE),
PAT (NET_INCOME),
Operating Profit (OPER_INCOME).
For each earnings update, it calculates:
Sales QoQ %: Growth in sales vs. the previous quarter,
PAT QoQ %: Growth in PAT vs. the previous quarter,
OPM %: Operating Profit Margin = (Operating Profit / Sales) × 100.
This helps traders and investors quickly visualize fundamental growth trends right alongside the candlestick chart, improving fundamental + technical analysis integration.

Currency Basket vs USD - Trend & RSI Breakdown📊 Indicator Methodology
Currency Basket vs USD – Trend & Valuation Breakdown
💱 Strategy of Rotating Between USD and the Currency Basket
💰 100% cash strategy – always ready for market crashes.
🟢 Hold USD if the trend indicator shows USD is trending.
🔵 Hold the currency basket (EUR, PLN, CZK, CHF, GBP) if the basket is trending.
✅ This way, you're always on the winning side of the trade, never risking a loss of purchasing power.
📈 Since it's a LONG ONLY, NO LEVERAGE strategy, there are no trading or holding fees, except for a small 0.15% FX fee every few months when the trending currency changes.
📈 Trend Indicator
Uses 5 different indicators working together to determine which asset is in a trend.
👀 On the chart it's visualized as:
➕ Plus symbols indicating trend strength (usually ranges from -4 to +4).
🔺 If USD has a higher trend signal than the basket → Hold USD.
🔻 If the basket has a higher signal → Hold the basket.
🕒 Signals typically last several months and operate on the 3D (3-day) timeframe, giving a high probability of catching macro moves.
💡 Valuation Indicator (Z-scored RSI)
Uses RSI with a length of 30.
Z-scored between -1 to 1.
📉 Interpretation:
-1 for USD = too strong → likely stagnation or reversal.
-1 for Basket = undervalued → likely growth or stabilization.
📊 Displayed as a separate line below the main chart.
📍 A horizontal line at 90 is added on the main chart – helping you quickly see what’s above or below this key reference level.
⚙️ How the Strategy Works in Practice
✅ You update the indicator daily (takes only seconds).
✅ The trend indicator tells you which currency to hold.
✅ The valuation indicator prepares you for possible reversals.
🔄 When the trend shifts, you rotate your full position.
⏳ Trades typically last several months.
📈 Usually generates consistent profits of 2–8%.
💪 It grows your capital while keeping you ready to buy assets during major selloffs.
🔍 Best Usage
Use it as a quick scanner to observe trend or valuation changes.
If a signal appears, validate it using additional trend and valuation indicators.
📌 If most agree, take the position.
