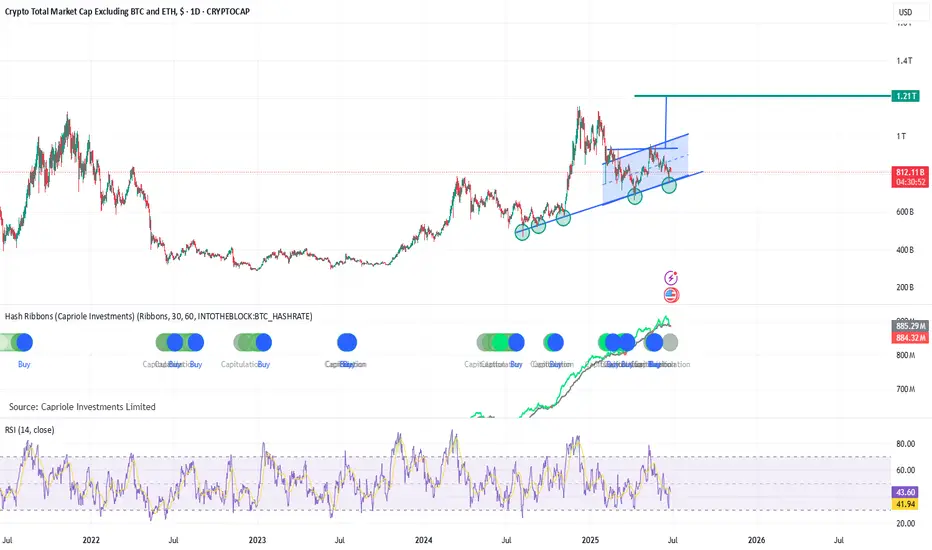
Altcoins in Bullish Channel with 5 touches on Support LineAltcoin Market (TOTAL3) – Quiet Strength Building for a Breakout
The TOTAL3 chart, which tracks the market cap of all crypto assets excluding Bitcoin and Ethereum, is quietly painting one of the most structurally bullish setups in the entire digital asset space.
Here’s the technical backdrop:
Bul
Key data points
Previous close
—
Open
—
Day's range
—
About Crypto Total Market Cap Excluding BTC and ETH, $
Bitcoin and Ethereum are such major players and so popular among investors that when you enter the market, they draw all the attention to themselves leaving other coins in their shade. It's not that they do not deserve this attention, but without their colossal figures, investors could take a healthier look at the crypto market to define its overall state and direction. Following this logic, we've calculated total crypto market capitalization excluding BTC and ETH market caps and displayed how the final number changed over time on the chart. Hope it proves useful in your analysis of crypto markets.
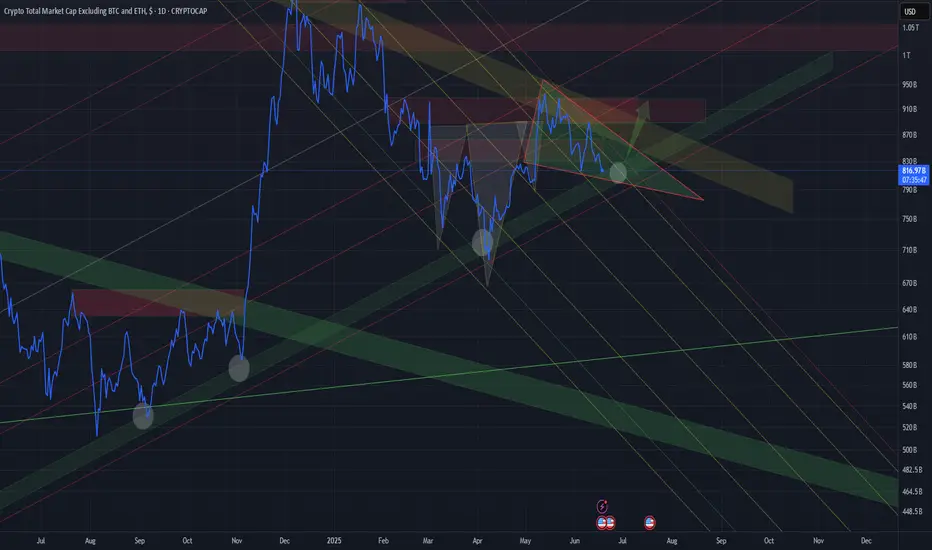
TOTAL3 is getting squeezed. Breakout imminent?TOTAL3 seriously looks ready for a massive breakout. A move to the downside would be unfortunate, but the upside potential looks excellent!

PURE TOTAL 3 ALTCOIN INDICATOR without stable coins, BTC and ETHCRYPTOCAP:TOTAL3-CRYPTOCAP:USDT-CRYPTOCAP:USDC-CRYPTOCAP:DAI
Original idea inspired by trader SpartaBTC — highly recommend checking out his page.

Altcoin Market HTFTotal3 represents. In the cryptocurrency market, Total3 is a metric that captures the total market capitalization of all cryptocurrencies, excluding Bitcoin (BTC) and Ethereum (ETH). By dividing this value by the Bitcoin to US Dollar exchange rate (BTCUSD), we get a ratio that effectively shows how

alts/btc pair explain in hindiBenjamin explain very well bitcoin and altcoin relationship.. and your chart accurate and it can move further as you told in video
But but, In this chart you mention alts/btc ratio , not price (alts/usdt)...
it means if you hold BTC or other high cap like BNB/TRX/ETH , it became better option tha

TOTAL3 - Reversal incoming?!We just hit the trend reversal area on CRYPTOCAP:TOTAL3 , which immediately led to a bounce.
A reversal from this level is very likely —
even though the recent drop formed a bearish structure that could potentially bring us back down to the April 7th lows.
Still, in my view, the more likely direc

Bull Season ForecastLet's take note of these dates for future reference :) ( It is not investment advice )
13 July-01 April


ALTSEASON INDICATOR? UPDATEALTSEASON INDICATOR Update
We’re closely watching a key level that has historically marked the beginning of various altseasons — some stronger, some weaker. Right now, things are getting interesting:
A clear triangle is forming on the chart, and there's a high probability of a breakdown.
This cou
Warning: Another Dump Coming?
Bitcoin is showing several weakness signals on the weekly timeframe.
Last time I saw these signs, the market dropped almost 50%!
The question is: are we about to see that scenario repeat again?
In this analysis, I’ve dug into exactly that and checked how serious this weakness really is.
Make sure

See all ideas
Summarizing what the indicators are suggesting.
Oscillators
Neutral
SellBuy
Strong sellStrong buy
Strong sellSellNeutralBuyStrong buy
Oscillators
Neutral
SellBuy
Strong sellStrong buy
Strong sellSellNeutralBuyStrong buy
Summary
Neutral
SellBuy
Strong sellStrong buy
Strong sellSellNeutralBuyStrong buy
Summary
Neutral
SellBuy
Strong sellStrong buy
Strong sellSellNeutralBuyStrong buy
Summary
Neutral
SellBuy
Strong sellStrong buy
Strong sellSellNeutralBuyStrong buy
Moving Averages
Neutral
SellBuy
Strong sellStrong buy
Strong sellSellNeutralBuyStrong buy
Moving Averages
Neutral
SellBuy
Strong sellStrong buy
Strong sellSellNeutralBuyStrong buy
Displays a symbol's price movements over previous years to identify recurring trends.