Trading Altcoins for Maximum Profits · StrategyIt is a tricky market. How are you going to trade the altcoins to maximize profits? What's your plan?
Everyday there is always some odd pair that grows 100%+, and we feel attracted to this kind of action. We want to be in and we want to hold those pairs. But, there are hundreds of choices on each exchange and only 1-2 pairs breakup this strongly every few days. Quietly, behind the scenes, everything grows but slowly.
Three months down the road the entire market will be 2-3 levels up, minimum. Some pairs will be up five levels and some even more.
If we fall for the trap of trying to catch the next big move, we can miss the real bullish action that is happening every day. I mean, it is better to buy and hold 5-10 strong good pairs rather than chasing around the dream of big wins. A dream that most often than not never comes.
If you look at 22-June or 7-April, it takes months for a bullish wave to develop. All across, marketwide, it happens step by step. Every day altcoins are growing 2-3%, 5-10%, over and over, again and again.
When we jump around trying to catch the next sudden jump, we miss the safe and secure sustained daily growth. When we finally make the right move and buy the pair that is breaking up strong, there is a 50% bullish breakout but somehow this isn't enough, we want more, more, more. 50%, 70% up and yet, we do not sell, we wait for more. But the entire bullish wave, regardless of how you slice it, takes a minimum of 3 months. Then comes a retrace, fast, or a strong correction, and we sell when prices are low. A strong rise at first and we might end up with just 20-30% gains. And in this way we end up wasting months and months.
Three months later, we do have some gains; it is a bull market after all, but total growth is nothing compared to holding a strong pair long-term. The strong pairs, most of them, end up growing 700%, 800%, 1,000%. When you look at your capital and you are moving around, you see only 100 or 200% total growth. What is happening here?
If you have 2-3 years of spot trading experience, then you can definitely choose 20 good pairs and sell the few that breakup weekly, hold the rest. Each time several pairs breakup strong, collect profits and find the ones trading low. But, if you have less than 2 years experience trading spot, you are better off buying low and holding long-term. You will end up with bigger profits in the end.
There are many ways to approach the market, make no mistake, but a plan is needed to maximize profits. I will continue to share my experience so you can avoid making the same mistake I made back in the days.
I've been trading Bitcoin since 2013, altcoins starting 2015; full time Cryptocurrency since 2017 through present day.
The market is a school and will you give tons of lessons, experience is needed for success. If experience is lacking, planing ahead of time will produce the best results.
To plan, just ask yourself the following questions:
1) How long am I willing to wait after buying a pair?
2) If prices rise, will I sell? If yes, when and by how much?
3) If prices drop, will I close the position at a loss? If no, how long are you willing to wait with a losing pair? If yes, when will you close? At -10%, -20%, -50%?
Answering these questions ahead of time can help you avoid anxiety and stress. The more you prepare, the more you read; higher profits.
Namaste.
TOTAL3 trade ideas

Altcoins Rise Again – Off to 1.07T and 1.51T?🌊🚀 Total Market Cap (excluding BTC & ETH) is showing strength again, pushing off support and heading back into the heart of the channel.
💥 The bullish structure has been respected beautifully:
✅ Double bottom near channel base
✅ Clean bounce and new higher low
✅ Momentum building on macro trend
📈 As long as this channel holds, we're eyeing the next targets:
🔹 Mid-channel target: $1.07 Trillion
🔹 Channel top extension: $1.51 Trillion
From the "Escape" back in late 2023 to the clean retest — it’s now about confirmation and continuation.
This could be the altseason move everyone forgot about...
🛑 Long bias stays intact as long as the bottom channel support is respected.
Time to respect structure over noise.
One Love,
The FXPROFESSOR 💙
Disclosure: I am happy to be part of the Trade Nation's Influencer program and receive a monthly fee for using their TradingView charts in my analysis. Awesome broker, where the trader really comes first! 🌟🤝📈

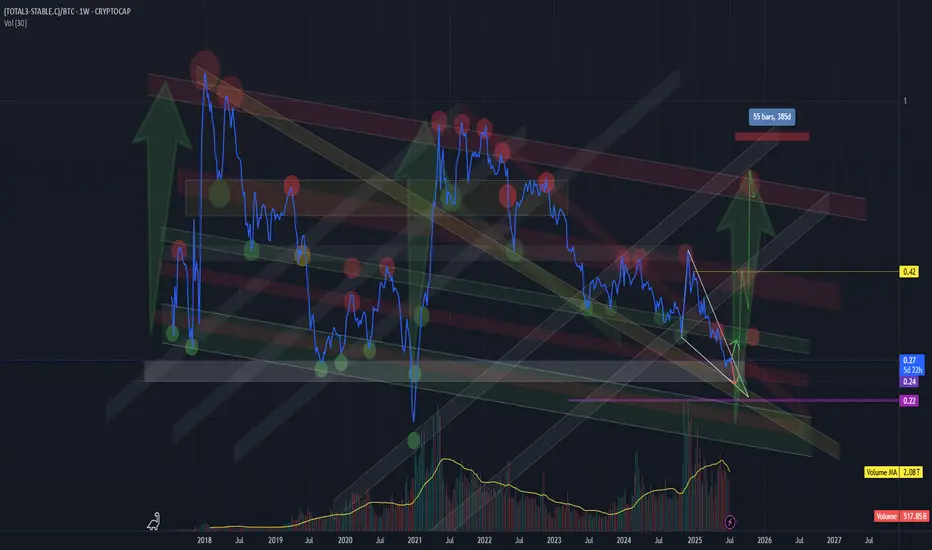
True altcoin-to-BTC strength indicator(CRYPTOCAP:TOTAL3-CRYPTOCAP:STABLE.C)/CRYPTOCAP:BTC
This formula strips out the noise and gives a true altcoin-to-BTC strength indicator.
STABLE.C removes all major stable coins (USDT, USDC, DAI, etc.).
The chart clearly shows previous capitulation zones and launch points for altseasons since 2017
Current formation – potential triangle:
Market makers appear to be coiling price action, forming a triangle-like structure.
This often precedes a volatile breakout — likely to the upside if history repeats.
Market psychology:
Many traders are already heavily positioned in altcoins, which suggests we could be nearing final capitulation.
Historically, altseasons never began with euphoria — but rather fear, exhaustion, and apathy.
BTC halving occurred in April 2024, and typically, the peak of the altseason follows 12 to 16 months later.
The seasonal strength of Q4, often fuels altcoin rallies.
!!! A final washout into a key support zone (on this ratio) could mark the trigger for the next major altseason — possibly starting around August 2025 !!!!!!!!
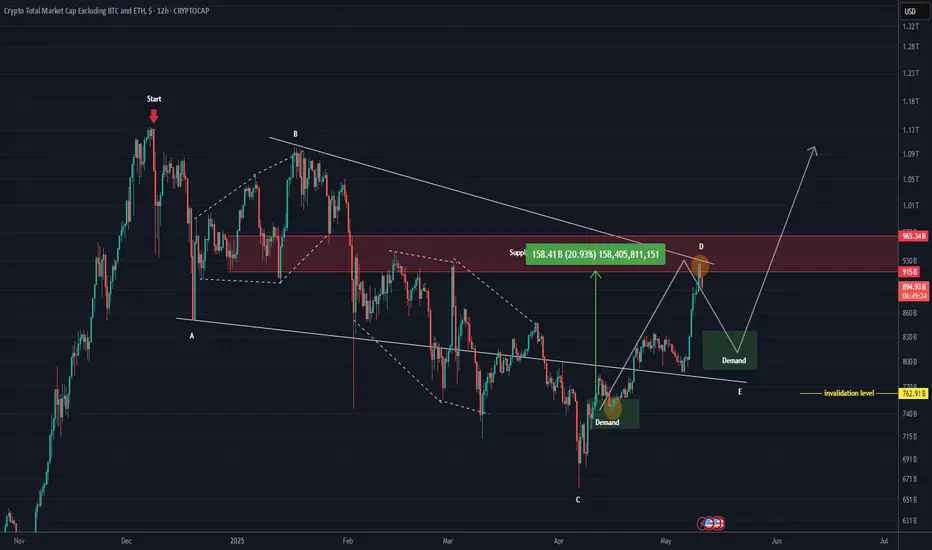
TOTAL 3 New Update (12H)This analysis is an update of the analysis you see in the "Related publications" section
TOTAL3 refers to the total crypto market cap excluding Bitcoin and Ethereum.
It pumped from the lower demand zone to the marked red box and has surged by 21%.
We now need a retracement to make the price more attractive.
If the invalidation level and the green zone hold, we could witness another bullish wave.
In this analysis, the invalidation level has been updated. A daily candle closing below this level will invalidate the setup.
Some altcoins are currently bullish, and each chart must be analyzed individually| so be cautious with your short positions.
For risk management, please don't forget stop loss and capital management
Comment if you have any questions
Thank You
Altcoins will bleed moreBTC.D Is high as always and Bitcoin too - ~106k ,
In case if we go till 98k - Total3 will drop even more as we expect.
Are you ready for new sweet possitions?

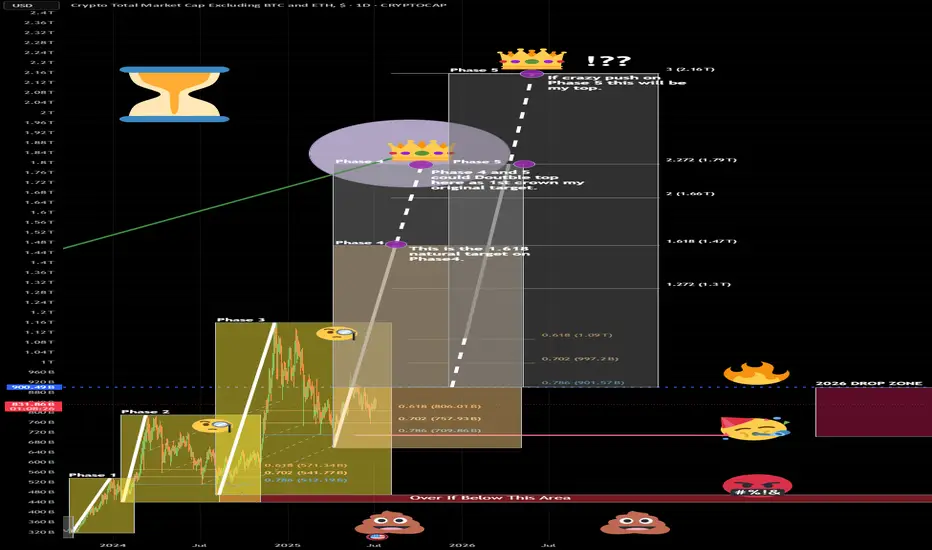
Total3 through 2026Layout of an idea on Total3, simply an idea - first crown is the target but options available too
Altcoins train is about to move...Hello Traders 🐺
If you pay close attention to everything around you, you'll notice that life moves in clear cycles — in nature, in emotions, in the economy, and especially in the most exciting part of the financial world: the crypto market.
Now you might be wondering why I'm starting like this...
Well, it’s because timing is everything.
If you jump on a train without knowing where it’s headed or when it stops, you’ll probably end up in the wrong place — confused, lost, and possibly broke.
It’s just like life: without direction, you repeat the same painful cycle — losing money, energy, and sometimes even the people you care about.
Trading is no different.
That’s why understanding seasonality and cycles in crypto is critical. In fact, I believe crypto is one of the few markets where, if you understand the cycle, you can position yourself early and make serious profits — especially by timing your entry into Altcoins just right.
Let’s take a look at the chart 👇
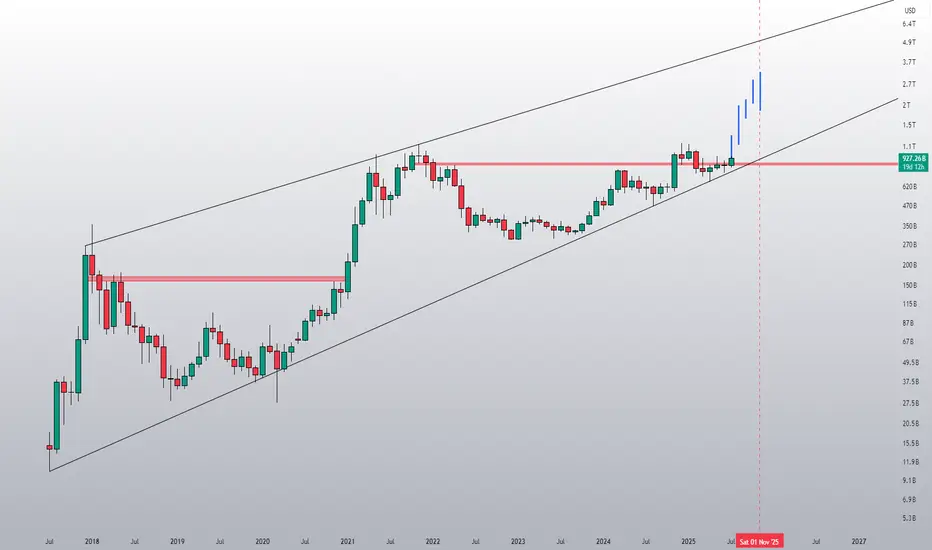
On the weekly chart, after the last Altcoin Season (which started in March 2020 and lasted nearly 570 days), we entered a long bear market. Now, the market looks like it’s preparing for the next big move — and guess what? That move is what we all love: Altcoin Season.
We can clearly see a Cup & Handle pattern forming. In my opinion, once price breaks above the handle (which is a descending channel), we could see a strong rally to retest the 1.14T market cap — and if momentum continues, even a breakout to the 4T mark.
That’s roughly 500% growth from where we are now!
Also, if you read my last idea about BTC.D, you’ll remember that BTC Dominance is hanging on its last key support.
If it breaks down, that’s when the Altcoins will explode.
I hope you found this idea useful. And always remember our golden rule:
🐺 Discipline is rarely enjoyable, but almost always profitable. 🐺
🐺 KIU_COIN 🐺

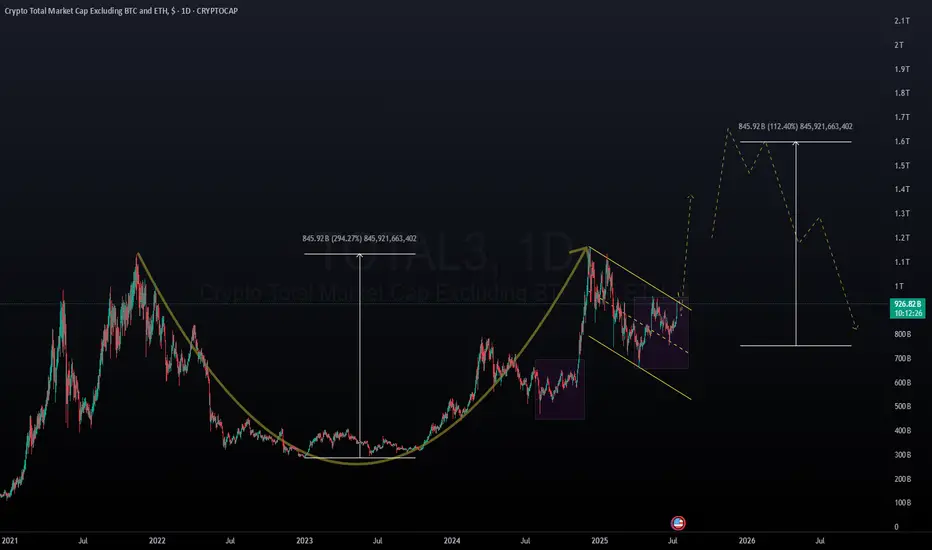
Total3 potential Cup & HandleLooking at a potential C&H playing out here on total 3.
If it plays out, looking for a break out soon (next week or 2 after a small retrace).
Top out late November, And a retest of the top in Feb before a bigger cooling off.
Are we back?TOTAL3 is attempting a breakout. A monthly close back above support would be a positive sign for small-cap altcoins.
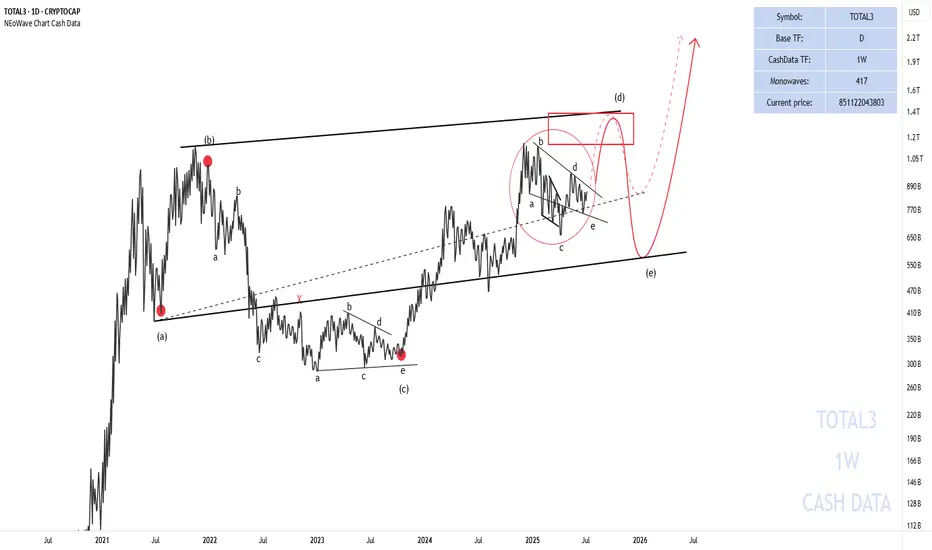
Has the Alt Season Started?Total 3 seems to be forming a neutral triangle (marked with a red circle) and will soon move towards the red box to complete wave-(d) of the higher degree triangle.
The price path is marked for you on the chart.
Good luck
NEoWave Chart
Warning: Another Dump Coming?
Bitcoin is showing several weakness signals on the weekly timeframe.
Last time I saw these signs, the market dropped almost 50%!
The question is: are we about to see that scenario repeat again?
In this analysis, I’ve dug into exactly that and checked how serious this weakness really is.
Make sure to watch the full breakdown — it’s super important

TOTAL3 UPDATEOn the TOTAL3 chart (which is an indicator of the market value of all coins other than Bitcoin and Ethereum), a head-and-shoulders pattern has formed and is now active. This means that we will see a rise in altcoins.

TOTAL3 is getting squeezed. Breakout imminent?TOTAL3 seriously looks ready for a massive breakout. A move to the downside would be unfortunate, but the upside potential looks excellent!

alts/btc pair explain in hindiBenjamin explain very well bitcoin and altcoin relationship.. and your chart accurate and it can move further as you told in video
But but, In this chart you mention alts/btc ratio , not price (alts/usdt)...
it means if you hold BTC or other high cap like BNB/TRX/ETH , it became better option than alts and its true.
but at this stage, we can see that others/alts mcap can go up on each cycle despite of alts/btc ratio going down. It means alts price can move upside from here, it happen if btc jump very quickly towards $125k , we may see jump in alts but alts/btc pair drop.
so if you are a only alts/usdt trader, you have to pay higher price after 1-2 month despite of alts/btc pair down.
in short, it good strategy if any one hold bitcoin only. But if you are only alts/usdt trader, it good to pick alts here, no matter alts/btc pair go down.

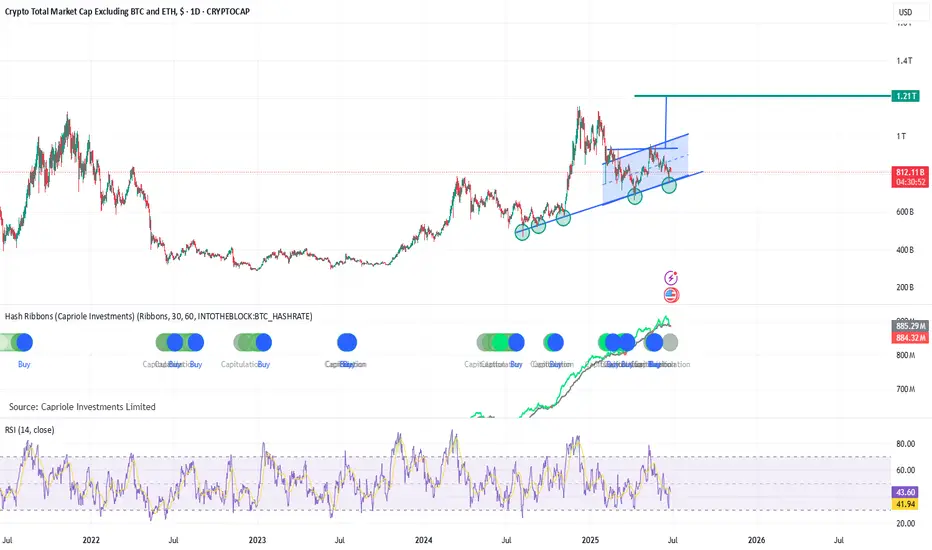
Altcoins in Bullish Channel with 5 touches on Support LineAltcoin Market (TOTAL3) – Quiet Strength Building for a Breakout
The TOTAL3 chart, which tracks the market cap of all crypto assets excluding Bitcoin and Ethereum, is quietly painting one of the most structurally bullish setups in the entire digital asset space.
Here’s the technical backdrop:
Bullish Channel Structure: Since July 2024, TOTAL3 has respected a clean upward channel with five distinct support touches, reinforcing the trend’s integrity. Every dip has been bought, and price has continued to press higher within the channel — a textbook sign of sustained accumulation and orderly uptrend behavior.
Macro Tailwinds Aligning: The backdrop is starting to shift decisively in crypto’s favor:
Iran–Israel Truce and signs of a potential Ukraine resolution have defused major geopolitical risk.
Oil prices are trading near 2024–2025 lows, suggesting that deflationary forces are dominant — giving the Fed cover to cut rates earlier than expected, potentially as soon as July.
A rate cut into a structurally uptrending TOTAL3 chart would be a powerful catalyst — especially as liquidity tends to flow fastest into altcoins once macro uncertainty clears.
Market Rotation Potential: With BTC and ETH already having made strong moves, TOTAL3 is primed to catch inflows from profit rotation. Historically, altcoins outperform after macro clarity and initial BTC/ETH strength — and the structure here supports that thesis.
Bottom Line:
The stage is set. TOTAL3 is trading in a well-defined bullish channel with proven support, while macro clarity and easing financial conditions could provide the ignition. Altcoins are quietly coiling, and the breakout may arrive faster — and stronger — than many expect.
Altcoin Market HTFTotal3 represents. In the cryptocurrency market, Total3 is a metric that captures the total market capitalization of all cryptocurrencies, excluding Bitcoin (BTC) and Ethereum (ETH). By dividing this value by the Bitcoin to US Dollar exchange rate (BTCUSD), we get a ratio that effectively shows how the broader altcoin market is performing relative to Bitcoin.
This ratio is particularly useful for investors and analysts as it provides a clear picture of whether altcoins are outperforming or underperforming Bitcoin at any given time. A rising Total3/BTCUSD ratio indicates that altcoins are gaining strength relative to Bitcoin, while a falling ratio suggests Bitcoin is outperforming the broader crypto market.

Bull Season ForecastLet's take note of these dates for future reference :) ( It is not investment advice )
13 July-01 April

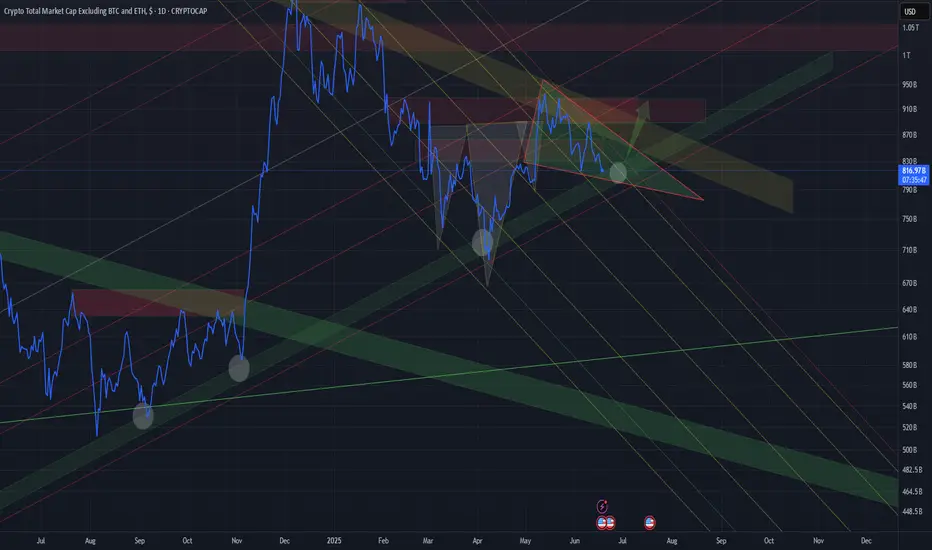
TOTAL3 - Reversal incoming?!We just hit the trend reversal area on CRYPTOCAP:TOTAL3 , which immediately led to a bounce.
A reversal from this level is very likely —
even though the recent drop formed a bearish structure that could potentially bring us back down to the April 7th lows.
Still, in my view, the more likely direction is to the upside.
The coming days and weeks will show how this plays out.

PURE TOTAL 3 ALTCOIN INDICATOR without stable coins, BTC and ETHCRYPTOCAP:TOTAL3-CRYPTOCAP:USDT-CRYPTOCAP:USDC-CRYPTOCAP:DAI
Original idea inspired by trader SpartaBTC — highly recommend checking out his page.


ALTSEASON INDICATOR? UPDATEALTSEASON INDICATOR Update
We’re closely watching a key level that has historically marked the beginning of various altseasons — some stronger, some weaker. Right now, things are getting interesting:
A clear triangle is forming on the chart, and there's a high probability of a breakdown.
This could be a typical long squeeze — a shakeout before the real move.
We’ve seen this before: a sharp dip followed by a strong recovery and continuation to the upside.
📉 The triangle may break down — but most likely as a fakeout.
📈 Once the dip is bought back, the real move could begin.
Both intermediate and final targets are marked on the chart and remain valid.
It’s all going to be much clearer soon — for now, we’re watching closely.
TOTAL3 We’re back just below the trend reversal zone,
which we haven’t fully tapped yet.
It’s very possible that we could still drop into that region.

TOTAL3 - market updateWe just broke through the trend reversal zone on CRYPTOCAP:TOTAL3 — and barely felt any resistance. That’s often a clear signal of momentum and strength.
I hope everyone got positioned properly in recent weeks. Because once BTC breaks its ATH and starts pumping like it did in November, everything is going to move fast.
The "easy money" phase will return.
Everyone will make money.
Everyone will be a genius.
But only a few will actually keep their gains...
So Get a plan & Stick to it. No matter what.
LFG 🚀
Higher pls.
