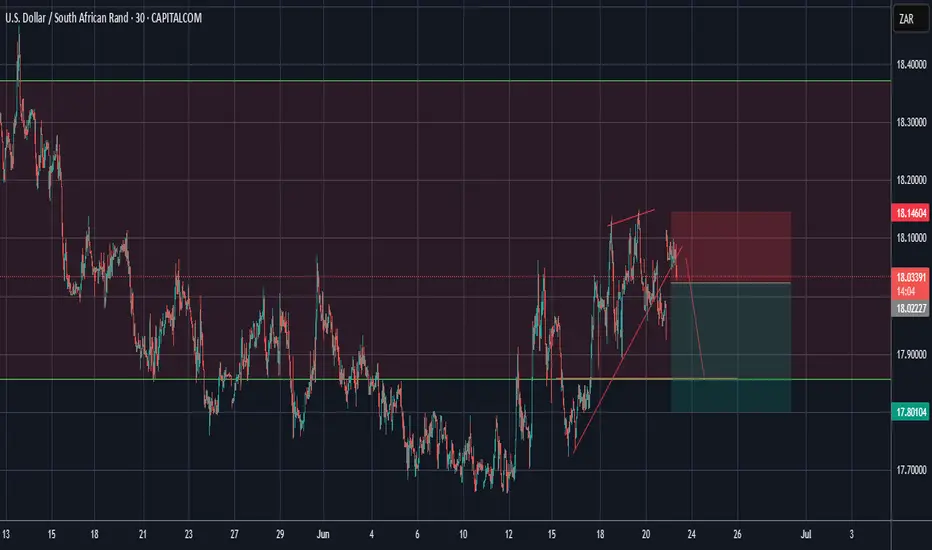
USDZAROn a shorter TF, here is the entry to sell the USDZAR, hopefully if this entry holds solid to the bigger view of this pair, we should be able to trail our SL until further notice as per the Daily TF Posted chart, alternatively we can just jump in and out at the green line (please note the green line
About U.S. Dollar / South African Rand
The U.S. Dollar vs. the South African Rand. The Rand was and became legal tender in the late 50’s to early 60’s for South Africa, Swaziland, Lesotho and Namibia after moving away from the Pound. After the apartheid era sanctions the Rand experienced a great deal of volatility and depreciation.
Related currencies
USDZAR-BY strategy 3 hourly chrt GANNW are observing a breakaway gap (possibility), and this means we will move higher over time, which is in line with 3D chart posted some days back. The market is uncertain, and any escelation or threath, should keep USD firm, and the chart merely reflect this situation. Crypto has come under pressure

USDZAR-BUY strategy 3 Hourly chart Reg. ChannelThe pair is still under pressure, and certainly not out of negative territory. I suspect we may test down side further, especially we have moved below 17.8750 area. The channel support is 17.60s and near that level would start considering BUY entry. The indicators are slightly positive, so if one is

USD/ZAR accumulation zone approachingZAR strength on the back of a very weak Dollar. Potential accumulation zone approaching for those looking to take advantage of the situation.

USDZARMy pov for USDZAR pair is that we should be expecting further gradual drops, not sure if this will be a sharp drop or consolidated one , however should we get a solid break off the support in red line, then we should be looking forth to more sellers dominating this market. Whats your view? What do y

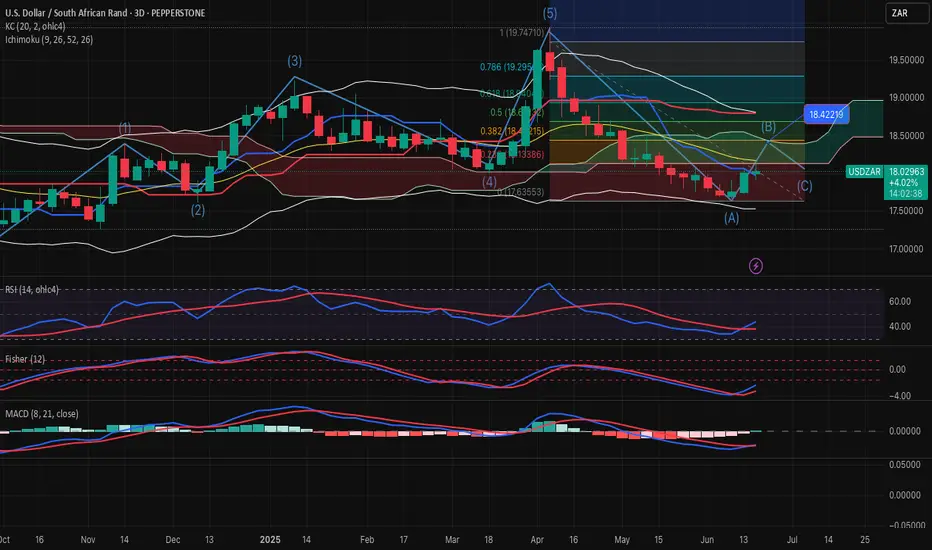
USDZAR-BUY strategy 3D chart The pair is still on the BY side, even though short-term charts may suggest slightly lower. The issue is, that any involvement by US may cause a spike of US dollar, and technically the pair has a chance to correct to 18.4200 FIB before we see recovery. So be careful, and perhaps the BUY side may hel
USDZAR-SELL strategy 6 hourly chart Reg. ChannelThe pair has moved down sharply, and as always, any news can change direction quickly as we have witness again and again. Caution always is warranted.
The #D chart is still upwards, even though a pause, and down move do0es not negate the over all situation, however short-term, we are seeing weakne

USDZARLooking for buying opportunities for the USDZAR herewith the breakout on the resistance being confirmed by the RSI Divergence as well as the trendline breakout entry approach, entry to buy on breakout retesting. Looks simple but tricky.

USDZARCOT Report: Shows net shorts on the USD, indicating a bearish bias for USD/ZAR as institutional traders expect the ZAR to strengthen. Bias: The bearish bias

USDZAR Bull ideaWe have a dollar that is potentially looking to have a long term bull run and USDZAR is an exotic pair that is part on the immerging markets and it can sometimes lead the move before the Major pairs.

See all ideas
Summarizing what the indicators are suggesting.
Oscillators
Neutral
SellBuy
Strong sellStrong buy
Strong sellSellNeutralBuyStrong buy
Oscillators
Neutral
SellBuy
Strong sellStrong buy
Strong sellSellNeutralBuyStrong buy
Summary
Neutral
SellBuy
Strong sellStrong buy
Strong sellSellNeutralBuyStrong buy
Summary
Neutral
SellBuy
Strong sellStrong buy
Strong sellSellNeutralBuyStrong buy
Summary
Neutral
SellBuy
Strong sellStrong buy
Strong sellSellNeutralBuyStrong buy
Moving Averages
Neutral
SellBuy
Strong sellStrong buy
Strong sellSellNeutralBuyStrong buy
Moving Averages
Neutral
SellBuy
Strong sellStrong buy
Strong sellSellNeutralBuyStrong buy
Displays a symbol's price movements over previous years to identify recurring trends.
Frequently Asked Questions
The current rate of USDZAR is 17.85832 ZAR — it has decreased by −0.06% in the past 24 hours. See more of USDZAR rate dynamics on the detailed chart.
The value of the USDZAR pair is quoted as 1 USD per x ZAR. For example, if the pair is trading at 1.50, it means it takes 1.5 ZAR to buy 1 USD.
The term volatility describes the risk related to the changes in an asset's value. USDZAR has the volatility rating of 1.23%. Track all currencies' changes with our live Forex Heatmap and prepare for markets volatility.
The USDZAR showed a −1.11% fall over the past week, the month change is a −0.57% fall, and over the last year it has decreased by −1.77%. Track live rate changes on the USDZAR chart.
Learn how you can make money on rate changes in numerous trading ideas created by our community.
Learn how you can make money on rate changes in numerous trading ideas created by our community.
Currencies are usually traded through forex brokers — choose the one that suits your needs and go ahead. You can trade USDZAR right from TradingView charts — just log in to you broker account. Check out the list of our integrated brokers and find the best one for your needs and strategy.
When deciding to buy or sell currency one should keep in mind many factors including current geopolitical situation, interest rates, and other. But before plunging into a deep research, you can start with USDZAR technical analysis. The technical rating for the pair is sell today, but don't forget that markets can be very unstable, so don't stop here. According to our 1 week rating the USDZAR shows the sell signal, and 1 month rating is sell. See more of USDZAR technicals for a more comprehensive analysis.