US–Iran Conflict Triggers a Potential Nasdaq Bearish Setup🟣 Geopolitical Flashpoint Meets Technical Confluence
The U.S. weekend airstrike on Iranian nuclear facilities has reignited geopolitical instability across the Middle East. While broader markets often absorb news cycles quickly, high-beta assets like Nasdaq futures (NQ) tend to react more dramatically—especially when uncertainty meets existing technical vulnerability.
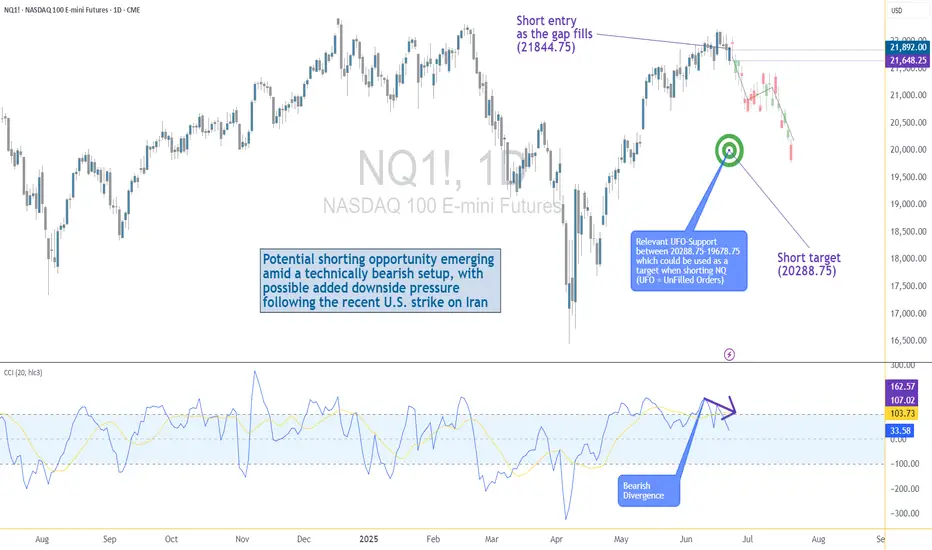
Monday’s session opened with a notable gap to the downside, reflecting immediate risk-off sentiment among futures traders. While the initial drop is being retraced intraday, historical patterns suggest that such gap-fills can often serve as ideal shorting zones—particularly when other bearish signals confirm the narrative. The backdrop is clear: this is no ordinary Monday open.
🟣 Bearish Divergence on CCI Builds the Case
From a technical standpoint, the setup gains weight through a clear bearish divergence on the Commodity Channel Index (CCI) using a 20-period setting. While prices recently pushed higher, momentum failed to follow—an early indication that buyers may be running out of steam. This divergence appears just as price approaches the origin of Friday’s gap, a level that frequently acts as a resistance magnet in such contexts. This confluence of weakening momentum and overhead supply aligns perfectly with the geopolitical catalyst, offering traders a compelling argument for a potential reversal in the short term.
🟣 Gap Origin: The Line in the Sand
The origin of the gap sits at 21844.75, a price level now acting as potential resistance. As the market attempts to climb back toward this zone, the likelihood of encountering institutional selling pressure increases. Gap origins often represent unfinished business—zones where prior bullish control was suddenly interrupted. In this case, the added layer of global tension only strengthens the conviction that sellers may look to reassert dominance here. If price action stalls or rejects at this zone, it could become the pivot point for a swift move lower, especially with bearish momentum already flashing caution signals.
🟣 Trade Plan and Reward-to-Risk Breakdown
A potential short trade could be structured using 21844.75 as the entry point—precisely at the gap origin. A conservative stop placement would rest just above the most recent swing high at 22222.00, offering protection against a temporary squeeze. The downside target aligns with a prior UFO support area near 20288.75, where demand previously showed presence. This sets up a risk of 377.25 points versus a potential reward of 1556.00 points, resulting in a reward-to-risk ratio of 4.12:1. For traders seeking asymmetrical opportunity, this ratio stands out as a strong incentive to engage with discipline.
🟣 Futures Specs: Know What You’re Trading
Traders should be aware of contract specifics before engaging. The E-mini Nasdaq-100 Futures (NQ) represent $20 per point, with a minimum tick of 0.25 worth $5.00. Typical margin requirements hover around $31,000, depending on the broker.
For smaller accounts, the Micro Nasdaq-100 Futures (MNQ) offer 1/10th the exposure. Each point is worth $2, with a $0.50 tick value and much lower margins near $3,100.
🟣 Discipline First: Why Risk Management Matters
Volatility driven by geopolitical events can deliver fast gains—but just as easily, fast losses. That’s why stop-loss orders are non-negotiable. Without one, traders expose themselves to unlimited downside, especially in leveraged instruments like futures. Equally critical is the precision of entry and exit levels. Acting too early or too late—even by a few points—can compromise an otherwise solid trade. Always size positions according to your account, and never let emotion override logic. Risk management isn’t a side-note—it’s the foundation that separates professionals from those who simply speculate.
When charting futures, the data provided could be delayed. Traders working with the ticker symbols discussed in this idea may prefer to use CME Group real-time data plan on TradingView: www.tradingview.com - This consideration is particularly important for shorter-term traders, whereas it may be less critical for those focused on longer-term trading strategies.
General Disclaimer:
The trade ideas presented herein are solely for illustrative purposes forming a part of a case study intended to demonstrate key principles in risk management within the context of the specific market scenarios discussed. These ideas are not to be interpreted as investment recommendations or financial advice. They do not endorse or promote any specific trading strategies, financial products, or services. The information provided is based on data believed to be reliable; however, its accuracy or completeness cannot be guaranteed. Trading in financial markets involves risks, including the potential loss of principal. Each individual should conduct their own research and consult with professional financial advisors before making any investment decisions. The author or publisher of this content bears no responsibility for any actions taken based on the information provided or for any resultant financial or other losses.
Divergence
How Momentum Divergence Reveals Hidden Market Strength and WeaknMost traders watch price action closely: candlesticks, moving averages, trendlines. But there’s a deeper, less obvious layer of information that often signals shifts in direction before price confirms it: momentum.
📌 Quick overview – what you'll learn:
What momentum divergence is (clearly explained)
How it helps predict potential trend shifts
Practical ways to spot and trade divergences
📈 Price vs Momentum: They're Not the Same!
Momentum doesn't simply track price direction. Instead, it measures the strength behind price movements.
Rising prices, falling momentum often signals upcoming bearish reversals.
Falling prices, rising momentum often hints at bullish reversals building beneath the surface.
These subtle divergences are powerful because they reveal hidden market shifts before everyone else notices them.
⚠️ How to Spot Momentum Divergence (Simple Steps):
Step-by-step:
- Find clear price swings:
Clearly defined highs/lows on your chart.
- Check momentum indicators (RSI, MACD, CCI, etc.):
Does the indicator agree or disagree with the price action?
- Spot divergence:
Bullish divergence: Price makes lower lows, indicator shows higher lows.
Bearish divergence: Price makes higher highs, indicator shows lower highs.
- Confirmation:
Always wait for price confirmation like a reversal candle or break of a trendline.
🔥 Why Momentum Divergence Works:
Divergence highlights hidden accumulation or distribution by smart money.
Helps you anticipate reversals before price confirms.
Filters out weak moves and helps you avoid fake breakouts.
📊 Real Example (XAUUSD – April 2025):
Recently in Gold:
Price was dropping steadily, reaching new lows.
Meanwhile, RSI showed clear higher lows – classic bullish divergence.
Result: Price exploded significantly shortly after momentum divergence appeared clearly.
🧠 Trading Tips to Remember:
Divergence signals are stronger near key support/resistance zones.
Use momentum divergence with your existing strategy for confirmation, not isolation.
Always define your risk clearly (set stops above/below recent highs/lows).
🚩 Common Pitfalls to Avoid:
Trading divergence without confirmation: always wait for the market to show its hand.
Ignoring the bigger picture: check higher timeframes for stronger signals.
Overtrading: not every divergence leads to a reversal; quality beats quantity.
🚀 Your Action Plan for Next Week:
Pick one momentum indicator and identify at least 3 divergences on your favorite assets.
Monitor how they play out.
Note down what works best in your trading journal.
💬 Question for you:
What’s your go-to momentum indicator when spotting divergence? RSI, MACD, CCI, or something else? Drop a comment below!
Happy trading!
TrendGo Team

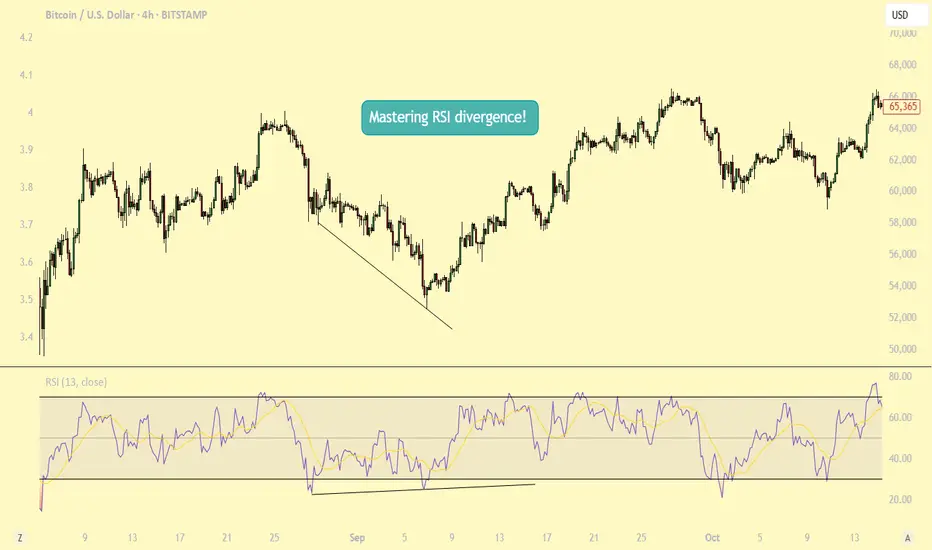
Mastering RSI Divergence: A Complete Guide to Trend ReversalsWhat Are Divergences?
In this guide, we will explore the concept of divergence and how it can be effectively utilized alongside the Relative Strength Index (RSI), one of the most popular momentum indicators in technical analysis. Divergence occurs when the price of an asset moves in the opposite direction of an indicator, such as the RSI. Understanding RSI divergence can be a powerful tool for identifying potential trend reversals or continuations. In this guide, we'll delve into the various types of divergence that can occur with the RSI and how to incorporate them into your trading strategy.
Types of Divergences?
There are three primary types of divergence: bullish, bearish, and hidden divergence. Each signals a distinct market condition and potential outcome, and understanding these nuances is key to using divergence effectively in your trading.
1. Bullish Divergence Bullish divergence happens when the price of an asset makes a lower low, while the RSI forms a higher low. This indicates that although the price is declining, momentum is weakening. The failure of the RSI to confirm the new low in price suggests that selling pressure is diminishing, potentially signaling that a reversal to the upside could occur. Essentially, the market is losing its downward momentum, setting the stage for a potential bullish move.
2. Bearish Divergence Bearish divergence occurs when the price forms a higher high, but the RSI forms a lower high. This indicates that although the price is rising, momentum is weakening. It suggests that the uptrend may be losing steam, signaling that a potential reversal to the downside could be on the horizon. As the price continues higher, but the RSI fails to confirm the new highs, it may indicate that the market is becoming overextended and ready for a correction.
3. Hidden Divergence Hidden divergence differs from regular divergence in that it signals a continuation of the existing trend, rather than a reversal. It typically occurs during pullbacks or retracements in a strong trend. Hidden divergence can appear in both uptrends and downtrends, providing traders with an indication that the prevailing trend is likely to continue after the short-term retracement is over. This type of divergence serves as a confirmation of trend strength and helps traders stay in profitable positions during market pullbacks.
Why Are RSI Divergences a Powerful Tool?
RSI divergence is a powerful tool in trading because it offers early insights into potential trend reversals or shifts in momentum before these changes are fully reflected in price movements. By recognizing divergence, traders can anticipate shifts in market sentiment and make timely decisions. One of the main reasons RSI divergence is so effective is that it serves as an early warning system. It signals when the momentum behind a price trend, whether up or down, is starting to weaken.
For example, in a strong uptrend, if prices continue to make new highs, but the RSI fails to reach new highs, this could signal that the buying momentum is losing strength, even though the price is still rising. This divergence indicates that a reversal or pullback might be imminent, allowing traders to exit their positions or prepare for a potential shift in market direction. Understanding this early warning can provide traders with an edge, helping them avoid being caught in the late stages of a trend and positioning themselves ahead of a change.
How to Trade RSI Divergences?
When the price makes a higher high but the RSI fails to confirm with a higher high, this is known as bearish divergence. While this situation suggests weakening momentum, it doesn’t necessarily mean a correction is imminent. The price may continue to rise for some time, and eventually, the RSI could catch up and make a higher high in line with the price action. Essentially, the market could remain in an uptrend, and the RSI could still align with the price over time.
This highlights the importance of not jumping to conclusions solely based on RSI divergence. Divergence can act as a useful warning, but it should not be relied upon as a definitive signal of a trend reversal. To increase the reliability of the signal, traders should wait for additional confirmation, such as a candlestick pattern indicating a potential trend reversal. Candlestick patterns like engulfing patterns, doji candles, or shooting stars at key support or resistance levels can provide stronger evidence that the trend may be about to change.
Therefore, it’s wise to wait for a more comprehensive confirmation from price action before making a move, rather than acting on divergence alone. Combining RSI divergence with other technical tools, such as candlestick patterns or chart patterns, can help increase the accuracy of your trade decisions.
Conclusion:
Divergence is a powerful tool that provides valuable insights into potential trend reversals or continuations. By understanding the different types of divergence and knowing how to identify them, traders can make more informed decisions. However, divergence should always be used in conjunction with other technical analysis tools to enhance the accuracy of your strategy. With practice, patience, and proper risk management, divergence trading can become a profitable strategy for identifying key market turning points. Whether you are seeking trend reversals or confirming ongoing trends, RSI divergence can be an essential component of your trading toolkit.
Thanks for your support.
- Make sure to follow me so you don't miss out on the next analysis!
- Drop a like and leave a comment!
Smart Money Technique (SMT) Divergences - The Ultimate GuideIntroduction
SMT Divergences are a powerful concept used by professional traders to spot inefficiencies in the market. By comparing correlated assets, traders can identify hidden opportunities where one market shows strength while the other shows weakness. This guide will break down the major SMT divergences: EURUSD/GBPUSD, US100/US500, and XAUUSD/XAGUSD .
---
What is SMT Divergence?
SMT Divergence occurs when two correlated assets do not move in sync, signaling potential liquidity grabs or market inefficiencies. These divergences can be used to confirm trend reversals, identify smart money movements, and improve trade precision.
Key Concepts:
- If one asset makes a higher high while the correlated asset fails to do so, this suggests potential weakness in the pair making the higher high.
- If one asset makes a lower low while the correlated asset does not, this suggests potential strength in the pair that did not make a lower low.
- Smart Money often exploits these inefficiencies to engineer liquidity hunts before moving price in the intended direction.
---
EURUSD vs. GBPUSD SMT Divergence
These two forex pairs are highly correlated because both share the USD as the quote currency. However, when divergence occurs, it often signals liquidity manipulations.
How to Use:
- If GBPUSD makes a higher high but EURUSD does not, GBPUSD may be trapping breakout traders before reversing.
- If EURUSD makes a lower low but GBPUSD does not, EURUSD might be in a liquidity grab, signaling a potential reversal.
---
US100 vs. US500 SMT Divergence
The NASDAQ (US100) and S&P 500 (US500) are both major indices with a strong correlation, but tech-heavy NASDAQ can sometimes lead or lag the S&P.
How to Use:
- If US100 makes a higher high but US500 does not, it suggests US100 is extended and may reverse soon.
- If US500 makes a lower low but US100 does not, US500 might be experiencing a liquidity grab before a reversal.
---
XAUUSD vs. XAGUSD SMT Divergence
Gold (XAUUSD) and Silver (XAGUSD) have a historic correlation. However, due to differences in volatility and liquidity, they can diverge, presenting trading opportunities.
How to Use:
- If Gold makes a higher high but Silver does not, Gold might be overextended and ready to reverse.
- If Silver makes a lower low but Gold does not, Silver might be in a liquidity grab, signaling strength.
---
Indicator Used for SMT Divergences
To simplify the process of identifying SMT divergences, this guide utilizes the TradingView indicator TehThomas ICT SMT Divergences . This tool automatically detects divergences between correlated assets, highlighting potential trade opportunities.
You can access the indicator here:
Why Use This Indicator?
- Automatically plots divergences, saving time on manual comparisons.
- Works across multiple asset classes (Forex, Indices, Metals, etc.).
- Helps traders spot Smart Money inefficiencies with ease.
---
Final Tips for Trading SMT Divergences
1. Use Higher Timeframes for Confirmation: SMT Divergences on 1H or 4H hold more weight than those on lower timeframes.
2. Combine with Other Confluences: ICT concepts like Order Blocks, FVGs, or liquidity sweeps can strengthen the SMT setup.
3. Wait for Market Structure Confirmation: After spotting SMT divergence, look for a market structure shift before entering trades.
4. Be Mindful of Economic Events: Divergences can appear due to news releases, so always check the economic calendar.
---
Conclusion
SMT Divergences are a valuable tool for traders looking to gain an edge in the markets. By analyzing inefficiencies between correlated assets, traders can anticipate smart money movements and improve trade precision. Practice spotting these divergences on real charts, and soon, you'll develop a keen eye for hidden liquidity traps.
Happy trading!

Leap Ahead with a Bearish Divergence on Gold FuturesThe Leap Trading Competition: A Chance to Trade Gold Futures
TradingView’s "The Leap" Trading Competition is an opportunity for traders to test their futures trading skills. Participants can trade select CME Group futures contracts, including Gold Futures (GC) and Micro Gold Futures (MGC).
Register and participate here: TradingView Competition Registration .
This article presents a structured short trade setup based on a bearish divergence identified using the Commodity Channel Index (CCI) and key pivot point levels for confirmation. The trade plan focuses on waiting for price to break below the pivot point at 2866.8 before executing the trade, with clear targets and risk management.
Identifying the Trade Setup
Bearish divergence occurs when price makes higher highs while an indicator, such as CCI, makes lower highs. This signals weakening momentum and a potential reversal. The Commodity Channel Index (CCI) measures price deviations from its average and helps traders identify overbought or oversold conditions.
Pivot points are calculated from previous price action and serve as key support and resistance levels. The pivot at 2866.8 is the reference level in this setup. A breakdown below this level may suggest further downside momentum, increasing the probability of a successful short trade.
The trade plan combines CCI divergence with pivot point confirmation. While divergence signals a potential shift, entry is only considered if price trades below 2866.8. This approach reduces false signals and improves trade accuracy. The first target is set at 2823.0, aligning with an intermediate support level (S1), while the final target is near S2 at 2776.2, just above a UFO support zone.
Trade Plan and Risk Management
The short trade is triggered only if price trades below 2866.8. The stop loss is placed above the entry at a level ensuring at least a 3:1 reward-to-risk ratio.
Profit targets are structured to lock in gains progressively:
The first exit is at 2823.0, where partial profits can be taken.
The final exit is near 2776.2, positioned just above a UFO support level.
Stop placement may vary based on the trader’s preferred risk-reward ratio. Position sizing should be adjusted according to account size and market volatility.
Contract Specifications and Margin Requirements
Gold Futures (GC) details:
Full contract specs: GC Contract Specifications – CME Group
Contract size: 100 troy ounces
Tick size: 0.10 per ounce ($10 per tick)
Margin requirements depend on broker conditions and market volatility. Currently around $12,500 per contract.
Micro Gold Futures (MGC) details:
Full contract specs: MGC Contract Specifications – CME Group
Contract size: 10 troy ounces (1/10th of GC)
Tick size: 0.10 per ounce ($1 per tick)
Lower margin requirements provide access to smaller traders. Currently around $1,250 per contract.
Leverage impacts both potential gains and losses. Traders should consider market conditions and margin requirements when adjusting position sizes.
Execution and Market Conditions
Before executing the trade, price must break below 2866.8. Additional confirmation can be sought through volume trends and price action signals.
If price does not break the pivot, the short setup is invalid. If price consolidates, traders should reassess momentum before committing to the trade.
Conclusion
Bearish CCI divergence signals potential market weakness, but confirmation from the pivot breakdown is key before executing a short trade. A structured approach with well-defined targets and risk management increases the probability of success.
For traders in The Leap Trading Competition, this setup highlights the importance of discipline, confirmation, and scaling out of trades to manage risk effectively.
When charting futures, the data provided could be delayed. Traders working with the ticker symbols discussed in this idea may prefer to use CME Group real-time data plan on TradingView: www.tradingview.com - This consideration is particularly important for shorter-term traders, whereas it may be less critical for those focused on longer-term trading strategies.
General Disclaimer:
The trade ideas presented herein are solely for illustrative purposes forming a part of a case study intended to demonstrate key principles in risk management within the context of the specific market scenarios discussed. These ideas are not to be interpreted as investment recommendations or financial advice. They do not endorse or promote any specific trading strategies, financial products, or services. The information provided is based on data believed to be reliable; however, its accuracy or completeness cannot be guaranteed. Trading in financial markets involves risks, including the potential loss of principal. Each individual should conduct their own research and consult with professional financial advisors before making any investment decisions. The author or publisher of this content bears no responsibility for any actions taken based on the information provided or for any resultant financial or other losses.

Divergence Trading Explained For Beginners -DAX Pullback TradeTrading divergence in the Forex or Stock market can be an important tool. Learn how to identify divergences & practically apply them to your technical analysis to increase your edge & profits in the financial markets.
In this video you'll learn
What is a bullish and bearish divergence
How to use divergence to spot potential reversals in the market
How to use volume to identify key levels of reversals
How to measure out a "Kill Zone"
What are tweezer tops & tweezer bottoms & why they are important
How to use the Fibonacci retracement tool
How to use the Relative Strength Index (RSI Indicator)
Your Trading Coach - Akil

Understanding RSI In TradingThis article takes a deep dive into the Relative Strength Index (RSI), a powerful tool for traders at any level. We’ll break down how RSI works, how to interpret it, and how to use it effectively in your trading strategies. Plus, we’ll touch on the math behind it. Whether you’re a seasoned pro or just getting started, this guide will give you the insights you need to make RSI a valuable part of your trading toolkit.
Understanding Oscillators in Trading
An oscillator is a technical indicator that moves between two extremes, usually ranging from 0 to 100. Traders use oscillators to spot overbought and oversold conditions in the market. An overbought signal suggests that excessive buying has driven prices too high and may not be sustainable, while an oversold signal indicates the opposite—excessive selling that could lead to a potential rebound. By tracking these price oscillations, traders can anticipate trend reversals and make more informed decisions.
Key Functions of Oscillators:
Momentum Analysis: Oscillators gauge the speed and strength of price movements, offering insights into an asset’s momentum.
Volatility Detection: They help identify periods of high or low volatility, enabling traders to adjust their strategies accordingly.
Trend Confirmation: When combined with other technical indicators, oscillators can validate or reveal emerging trends in the market.
Introduction to the RSI Indicator
The Relative Strength Index (RSI) is a momentum-based technical indicator used to assess the strength of recent price movements and identify overbought or oversold conditions in an asset. It helps traders spot potential trend reversals by oscillating between 0 and 100. An RSI above 70 suggests the asset may be overbought, while a reading below 30 indicates it may be oversold.
By the end of this, you'll be an RSI expert!
Interpreting RSI Readings
RSI values above 70 suggest that an asset is overbought, meaning it has likely experienced a sharp price increase and may be due for a correction. On the other hand, RSI values below 30 indicate that the asset is oversold, implying a steep price drop and the possibility of a rebound.
However, it's important to remember that RSI isn't foolproof and can occasionally give false signals. To increase accuracy, it's best to use RSI in combination with other technical indicators and fundamental analysis.
Overbought: An RSI reading above 70 signals that the asset may be overbought and due for a correction. This could present a potential selling opportunity, but traders should be cautious, as false signals can occur.
Oversold: An RSI reading below 30 indicates that the asset may be oversold and due for a rebound. This can signal a potential buying opportunity, but again, traders should be cautious of possible false signals.
Divergence: Divergence happens when the RSI moves in the opposite direction of the price. For instance, if the price makes new highs while the RSI forms lower highs, this could point to a potential trend reversal.
Support and Resistance: The RSI can also help identify support and resistance levels. If the RSI consistently bounces off the 30 level, it may indicate a support level. Conversely, if the RSI repeatedly fails to break through the 70 level, this could signal a resistance level.
RSI and Divergence
Divergence happens when the RSI moves in the opposite direction of the asset's price, often signaling a potential trend reversal. For example, if the price is hitting new highs but the RSI forms lower highs, it could indicate a bearish divergence, suggesting a possible sell signal.
A common example of bearish divergence is when the price of an asset makes higher highs, but the RSI forms lower highs. This suggests weakening buying momentum, even as the price continues to rise. It can be a sign that the uptrend may be losing steam, with a reversal to the downside potentially on the horizon.
On the other hand, bullish divergence occurs when the price is making lower lows, but the RSI is making higher lows. This indicates that selling pressure is subsiding, and the asset may be primed for a rebound to the upside. Traders can use this pattern to time their entries for long positions.
RSI divergence can help traders identify overbought or oversold conditions, enabling them to make more effective decisions about entry and exit points. However, divergence should always be used alongside other technical and fundamental analysis for confirmation before acting on the signal.
Calculating the RSI Indicator
Calculating the RSI is straightforward once you break it down. The goal is to determine the average gains and losses over a set period, typically 14 days. This helps assess the strength of price movements and identify overbought or oversold conditions. While the math may sound complex, understanding the formula is key to using the tool effectively.
The RSI formula is:
RSI = 100 - (100 / (1 + (Average Gains / Average Losses)))
This calculation provides valuable insights into the relative strength of an asset’s price movements.
Factors Affecting the RSI Calculation
The RSI calculation can be influenced by several factors, with the length of the time period being the most significant. A shorter period (e.g., 5 days) results in a more volatile RSI that responds quickly to price changes, while a longer period (e.g., 20 days) creates a smoother RSI, filtering out short-term fluctuations. The ideal time period depends on your trading style and the volatility of the market you're analyzing.
Why the RSI Indicator is Powerful
Identifies Overbought and Oversold Conditions: The RSI helps traders recognize when an asset is overbought or oversold, allowing them to time their entries and exits more effectively.
Detects Divergences: Divergences between the RSI and price can signal potential trend reversals, giving traders an early warning to adjust their positions accordingly.
Flexible and Customizable: Traders can adjust the RSI’s period to match their trading style and the specific market conditions, making it a highly versatile tool for technical analysis.
Widely Adopted and Well-Understood: The RSI is one of the most popular technical indicators, with a wealth of resources and analysis available to assist traders in interpreting its signals.
Practical Application in Real Life
Here are a few effective strategies where RSI can be combined with other technical indicators for a more comprehensive analysis:
Example 1: RSI + Support/Resistance + Moving Averages
Scenario:
You are analyzing a stock that has been in an uptrend, with the price currently approaching a key resistance level at $100. The 50-period moving average is also trending upwards, confirming the bullish trend.
The RSI is at 75, indicating an overbought condition.
As the price nears the resistance level, the RSI starts to flatten, suggesting the upward momentum might be weakening.
You wait for the price to fail to break above the $100 resistance level and the RSI to drop below 70, signaling a potential reversal. This provides a clearer sell signal, as both the price and RSI align with the idea that a correction could be coming.
Why this works:
By using both RSI and moving averages with support and resistance, you have a solid confirmation of the potential reversal, as it combines trend analysis with overbought conditions.
Example 2: RSI + SFP (Swing Failure Pattern) + Price Action
Scenario:
You’re monitoring a currency pair that recently made a new low, breaking through a previous swing low at 1.1500. However, the price quickly reverses and fails to sustain the breakdown, bouncing back above the previous low, forming an SFP.
At the same time, the RSI is below 30, but it starts to turn upward, forming a bullish divergence (higher lows on the RSI while the price makes lower lows).
This divergence and the SFP setup suggest that the selling pressure is decreasing, and a potential reversal to the upside could be imminent.
Why this works:
The Swing Failure Pattern highlights the false breakdown, and the RSI divergence confirms that momentum is shifting. This combination increases the likelihood of a successful trade when entering on the potential reversal.
Key Takeways
The RSI is an essential tool for traders looking to spot overbought or oversold conditions and potential trend reversals. By mastering how to interpret RSI readings and incorporating them into your strategies, you can improve your decision-making and potentially boost your trading results. For a more balanced approach, always use RSI alongside other technical indicators and fundamental analysis.

Decoding Reversals: Technical Analysis of ONGC: Educational postEDUCATIONAL POST
Technical Analysis of ONGC Stock
This post is for educational purposes only and should not be considered as investment advice.
In this post, we'll analyze the ONGC stock chart using technical indicators.
Key Points:
1. Bullish Divergence: Price and MACD are diverging, indicating a potential reversal.
2. Bullish Divergence: Price and RSI are also diverging, supporting the reversal idea.
3. Resistance Breakout: The stock has broken through a key resistance level with strong volume.
4. MACD Turns Positive: MACD has turned positive after the breakout, confirming the reversal.
5. Elliott Wave Counts: Wave counts suggest a potential reversal.
What to Expect:
Based on these indicators, we can see a potential reversal in ONGC's stock price. It may retrace to Fibonacci levels (50-61.8%) before continuing upward.
Conclusion:
This post is meant to illustrate how technical indicators can be used to analyze a stock chart. Please do your own research and consult with a financial advisor before making any investment decisions.
I am not Sebi registered analyst.
My studies are for educational purpose only.
Please Consult your financial advisor before trading or investing.
I am not responsible for any kinds of your profits and your losses.
Most investors treat trading as a hobby because they have a full-time job doing something else.
However, If you treat trading like a business, it will pay you like a business.
If you treat like a hobby, hobbies don't pay, they cost you...!
Hope this post is helpful to community
Thanks
RK💕
Disclaimer and Risk Warning.
The analysis and discussion provided on in.tradingview.com is intended for educational purposes only and should not be relied upon for trading decisions. RK_Charts is not an investment adviser and the information provided here should not be taken as professional investment advice. Before buying or selling any investments, securities, or precious metals, it is recommended that you conduct your own due diligence. RK_Charts does not share in your profits and will not take responsibility for any losses you may incur. So Please Consult your financial advisor before trading or investing.

Catch Big Reversals Like a Pro Using the GOLDEN RSIHow to Catch Market Tops and Bottoms Using the GOLDEN RSI Indicator
Trading market reversals can feel like a daunting task. But what if you had a secret weapon to help you identify tops, bottoms, and potential reversals with ease? Enter the GOLDEN RSI Indicator—a custom-built tool designed to revolutionize your trading strategy. In this tutorial, I’ll show you how to leverage this powerful indicator to spot reversal trades like a seasoned pro.
What is the GOLDEN RSI Indicator?
The GOLDEN RSI builds on the traditional RSI (Relative Strength Index) by adding optimized zones and visual signals that highlight potential bullish and bearish reversals. Unlike the standard RSI, which requires subjective interpretation, this indicator provides precise entry and exit signals by visually marking key market conditions.
How to Use the GOLDEN RSI to Catch Market Reversals?
Understand the Key Zones:
Overbought Zone (Above 80): Signals a potential market top or reversal from bullish to bearish.
Oversold Zone (Below 20): Indicates a potential market bottom or reversal from bearish to bullish.
Neutral Zone (60-40): Consolidation phase where trends are less decisive.
Spotting Bullish Reversals
When the RSI dips into the oversold zone (below 20) and begins to reverse upward, the GOLDEN RSI will highlight a Bull signal. This suggests a potential upward move, ideal for long trades.
Pro Tip: Look for confirmation with price action, such as a bullish candlestick pattern or a break of resistance.
Spotting Bearish Reversals
When the RSI climbs into the overbought zone (above 80) and starts to turn down, the GOLDEN RSI will mark a Bear signal. This indicates a potential downward move, perfect for short trades.
Pro Tip: Combine with chart patterns like double tops or bearish engulfing candles to strengthen your confidence in the trade.
The Hidden Power of Divergences
Bullish Divergence: Price makes lower lows while the RSI makes higher lows. This signals potential bullish momentum.
Bearish Divergence: Price makes higher highs while the RSI makes lower highs. This signals potential bearish momentum.
The GOLDEN RSI visualizes divergences clearly, so you can spot them effortlessly.
Use Risk Management Tools
Set stop-loss levels below recent swing lows (for bullish trades) or above recent swing highs (for bearish trades).
Use risk-reward ratios of at least 1:2 to maximize your profit potential.
Real Trade Example Using GOLDEN RSI
In the SPX 15-minute chart above, the GOLDEN RSI accurately identified:
A Bearish Reversal near the market top, as the RSI entered overbought territory and started to fall.
A Bullish Reversal as the RSI dipped into the oversold zone and recovered upward.
These signals allowed for precise entry points, minimizing risk and maximizing rewards.
Why the GOLDEN RSI is a Game-Changer
Unlike generic RSI tools, the GOLDEN RSI is designed with traders in mind. It eliminates the guesswork by providing visual cues for market reversals. Whether you’re trading stocks, indices, or crypto, this indicator is a must-have in your toolkit.
How to Get the GOLDEN RSI Indicator?
Want to try it for yourself? Head over to TradingView and add the GOLDEN RSI Indicator to your chart. Use it alongside your favorite price action strategies to take your trading to the next level.
Conclusion
Reversals can make or break a trader’s portfolio. By mastering the GOLDEN RSI, you can confidently spot market tops, bottoms, and reversals with precision. Start using this custom indicator today and watch your trading results improve dramatically!
Don’t forget to like, share, and follow me on TradingView for more tutorials like this one. Let’s catch those reversals together!

What is Divergence?Divergence in trading occurs when the price of an asset moves in the opposite direction of a technical indicator. This mismatch indicates that the momentum behind the price action may be weakening, often suggesting a potential reversal. By learning to spot divergence, traders can anticipate market changes, either as a reversal in trend (regular divergence) or a trend continuation (hidden divergence).
Types of Divergence
Regular Divergence
Hidden Divergence
1. Regular Divergence
Regular divergence is a classic form that suggests a potential trend reversal. It happens when the price action and an oscillator (like RSI or MACD) display conflicting information, often indicating that the current trend may be losing strength.
Types of Regular Divergence:
Bullish Regular Divergence: Occurs when the price makes lower lows, but the indicator makes higher lows. This suggests a potential reversal to the upside as the selling momentum weakens.
Bearish Regular Divergence: Occurs when the price makes higher highs, but the indicator forms lower highs. This indicates potential downside momentum, often preceding a downtrend.
How to Identify Regular Divergence:
Use an oscillator such as the RSI, MACD, or stochastic indicator.
Look for situations where the price action forms new highs or lows, while the oscillator forms opposite lows or highs.
Confirm the trend by observing the price trendlines to determine the type of regular divergence (bullish or bearish).
Trading Regular Divergence:
Bullish Regular Divergence: When you identify bullish regular divergence, consider entering a long position once the price shows signs of reversal, like a bullish engulfing candle or another bullish reversal pattern.
Bearish Regular Divergence: For bearish regular divergence, a short position may be taken once you confirm a bearish reversal pattern, such as a bearish engulfing candle or shooting star formation.
Example:
If the price of a stock is making higher highs but the RSI is making lower highs, this is a bearish regular divergence. You could consider shorting the asset or closing long positions as a precaution, anticipating a potential trend reversal.
2. Hidden Divergence
Hidden divergence indicates potential trend continuation. It suggests that although there may be a pullback, the primary trend will likely resume.
Types of Hidden Divergence:
Bullish Hidden Divergence: Occurs when the price forms higher lows, but the indicator makes lower lows. This pattern signals that the uptrend is likely to continue.
Bearish Hidden Divergence: Occurs when the price makes lower highs, but the oscillator makes higher highs, indicating a potential continuation of a downtrend.
How to Identify Hidden Divergence:
Observe the trend direction of the price. Hidden divergence typically appears during pullbacks in a strong trend.
Use the oscillator (RSI, MACD, etc.) and compare the highs and lows formed by both the price and indicator.
Confirm the pattern: if the price and indicator form opposing highs or lows, it may indicate hidden divergence.
Trading Hidden Divergence:
Bullish Hidden Divergence: Enter a long position after identifying bullish hidden divergence, especially if the primary trend is upwards and the oscillator is showing a lower low.
Bearish Hidden Divergence: A short position can be considered when bearish hidden divergence is identified, and the primary trend is downwards, with the oscillator showing a higher high.
Example:
Suppose an asset’s price makes higher lows in an uptrend, but the RSI makes lower lows. This indicates bullish hidden divergence, suggesting that the pullback might end, and the uptrend is likely to continue. Enter a long position, placing a stop loss below the recent swing low to manage risk.
Indicators Used for Identifying Divergence
Relative Strength Index (RSI): RSI measures the strength and speed of price movement, making it ideal for identifying overbought and oversold conditions.
Moving Average Convergence Divergence (MACD): MACD tracks the difference between two moving averages of the price and can be used to detect shifts in momentum.
Stochastic Oscillator: This oscillator helps detect potential turning points by comparing the closing price to the range over a set period.
Each of these indicators helps identify divergence differently. For example:
If RSI or Stochastic is diverging from price action, it may indicate that momentum is waning.
MACD can be useful to spot both regular and hidden divergences, especially on larger timeframes.
How to Trade Divergence
Confirm Divergence: Use divergence to identify a potential reversal or continuation pattern, but confirm it with additional signals such as candlestick patterns or volume analysis.
Set Entry Points: Wait for a price action signal (e.g., a candlestick pattern) in the direction indicated by the divergence. A bullish divergence might signal a buying opportunity after a bullish candlestick, while a bearish divergence could indicate a selling opportunity after a bearish pattern.
Use Stop Loss Orders: Place a stop loss slightly below or above recent highs or lows to manage risk. For example, in bullish divergence, place a stop loss below the swing low to protect against downside risk.
Set Profit Targets: Use support and resistance levels, Fibonacci retracement levels, or moving averages to set profit targets.
Tips for Successful Divergence Trading
Combine with Other Indicators: Use moving averages or trendlines to confirm the overall trend direction.
Choose Longer Timeframes for Stronger Signals: Divergence on longer timeframes (e.g., daily or weekly) tends to produce stronger signals than shorter timeframes (e.g., 15-minute or hourly).
Don’t Trade Divergence in Choppy Markets: Divergence is more effective in trending markets. Avoid using divergence in low-volume or range-bound conditions, as it could result in false signals.
Stay Aware of False Signals: Not all divergences result in profitable trades. Always use risk management tools, such as stop losses and position sizing, to minimize potential losses.
Hope you enjoyed the content I created, You can support with your likes and comments this idea so more people can watch!
✅Disclaimer: Please be aware of the risks involved in trading. This idea was made for educational purposes only not for financial Investment Purposes.
---
• Look at my ideas about interesting altcoins in the related section down below ↓
• For more ideas please hit "Like" and "Follow"!

How to REALLY Trade Divergences (One of My Favorite Entries)This tutorial might be short, but it is packed with potent information on how to REALLY trade divergences.
Divergences are one of the BEST ways to catch market reversals. However, from what I have seen, most people do not have a real process for determining when a divergence is actually confirmed/triggered, and then how to determine targets based on the divergence setup.
In other words, most people don't have a plan for trading divergence.
This video will give you a full plan (Setup/Trigger/Follow Through) for trading divergences.
I give full credit to Jake Bernstein, as this is a concept that I learned from him. He is one of the all time greats, and very worth your time to check out.
I hope you found this video insightful.
Have a great week.

Divergence: RSI vs. PriceHey everyone!
In my years of trading, I've really come to love Reversal Strategies and my favorite is in the form of a DIVERGENCE!
Today, I took some time to put together an Educational Video on:
1) What a Divergence Is?
2) How to Spot them!
&
3) How to Trade them!
I hope you find this helpful!
**Tips
- Divergence is never good enough to trade alone, YOU NEED CONFIRMATION!
- The longer the Divergence takes, the more reliable it is
- Change in Momentum is KEY!

Divergence - asset price directionDivergence is the discrepancy between the direction of an asset's price and the readings of an indicator. There are three types of divergences: classical, extended, and hidden. The first two can be used to gauge market sentiment and to trade in the opposite direction. Hidden divergence, however, is more significant and can serve as a powerful supplementary factor in determining the price direction and opening positions.
The use of extended divergence is not necessary, as it rarely occurs and forms at equal highs or lows. In such cases, an indicator is not needed to gauge market sentiment; the chart itself will suffice.
Classical Divergence
Classical divergence indicates a potential trend reversal or the beginning of a correction. Bullish classical divergence is identified when a lower low (LL) forms on the chart while a higher low (HL) appears on the indicator.
The masses buy when classical bullish divergence appears, anticipating significant growth. An upward price movement may begin, but after short-term liquidity for buying is exhausted and the price rebalances, a reversal will occur, and the decline will continue. Long positions opened during the correction will become unprofitable. In a bear market, classical bullish divergence typically appears before the start of a correction.
Bearish classical divergence is identified when a higher high (HH) forms on the chart while a lower high (LH) appears on the indicator.
The masses sell when classical bearish divergence appears, expecting a significant decline. A downward price movement may begin, but after short-term liquidity for selling is exhausted and the price rebalances, a reversal will occur, and the growth will continue. Short positions opened during the correction will become unprofitable. In a bull market, classical bearish divergence typically appears before the start of a correction.
The formation of multiple divergences is common. The masses will seize every opportunity to open their positions, leading to unprofitable outcomes. The number of divergences before the start of a correction is not limited. It is recommended to wait for the price to react after reaching the resistance zone. In the example above, the correction began after partially filling the imbalance on the 1D timeframe within the imbalance on the 1W timeframe.
Hidden Divergence
Hidden divergence serves as a confirmation of trend continuation.
Bullish hidden divergence is identified when a higher low (HL) forms on the chart and a lower low (LL) appears on the indicator.
In an uptrend, hidden bullish divergence may form before the continuation of growth, acting as a strong supplementary factor in determining the future price direction and considering positions.
Bearish hidden divergence is identified when a lower high (LH) forms on the chart and a higher high (HH) appears on the indicator.
In a downtrend, hidden bearish divergence may form before the continuation of the decline, acting as a strong supplementary factor in determining the future price direction and considering positions.
Notes
- The RSI (Relative Strength Index) indicator is used to identify divergences.
- RSI is plotted without considering candle shadows.
- Divergence should be viewed as an additional factor to your analysis, not a standalone tool.
- Divergence below the chart will always be bullish, while divergence above the chart will always be bearish.

How to Confirm a DivergenceI get a lot of messages from you guys talking about how #diivergences seem to play out or not get initiated or that you're having problems entering A #divergence trade.
In this video I'm presenting you a reminder of one of the steps you need to use and it is the the confirmation step that you need to use for confirming whether a divergence is actually going to start going in your favor.
By that I mean that you have already found the divergence and you're simply waiting to enter on the trade because as you should know by now just because you see a divergence doesn't mean it triggers you to start trading in a direction.
Finding the divergence is only step one but finding the entry is based off of the structure in price action that I have outlined in this video idea.
In this video I'm simply using the RSI to find a bullish divergence based off of the difference in bearish price action and you can see clearly how I implement drawing a area around the start of the divergence and wait for price to reach that area. If price never reaches that area then I do not trade bullish according to the bullish divergence instead you simply ignore the divergence and carry on with the rest of your #priceaction #trading.

Divergent TradingDivergent trading is when you compare the movement of a currency pair to the movement of a related indicator. We can see price is making new highs but our volume flow (Moving average) is making lower highs. Consider this a potential reduction in price to come.

How to Use Divergence
Hey traders!
RSI divergence, a key concept in technical analysis, occurs when the relative strength index (RSI) of an asset shows different patterns compared to its price movements.
If you like my graphics, share some 💙💛
Bullish Divergence:
In a bullish divergence, the RSI indicates the asset is oversold, forming higher lows, while the price action forms lower lows. This signifies a shift from selling pressure to buying interest. The sellers' last attempt to control the market is met with increasing buying volume.
Bearish Divergence:
Conversely, in a bearish divergence, the price achieves higher highs, reflecting the final push from buyers, while the RSI forms lower highs. This classic overbought scenario signals potential reversal as buyers lose momentum.
These divergence patterns provide reversal signals, whether in trending or ranging markets. It's essential to note that relying on a single strategy is not sufficient for consistent profits, however combining various strategies and setups enhances your win rate. Always trade with a risk level that aligns with your financial capacity.
Share Your Insights! Which indicator do you prefer for identifying divergence? Let me know in the comments below.

Guide: SMA and RSI for Trend ReversalsWelcome, traders! In this comprehensive guide, we'll explore a long-term trading strategy that leverages two powerful technical indicators: the Simple Moving Average (SMA) and the Relative Strength Index (RSI). By the end, you'll have a solid understanding of how to use these tools to identify trend reversals and make informed trading decisions with a focus on the bigger picture. 📉📈
Educational Objectives:
Understand the concept of long-term trading and its benefits.
Learn how to use the Simple Moving Average (SMA) to identify trends.
Master the Relative Strength Index (RSI) for spotting overbought and oversold conditions.
Combine SMA and RSI for a comprehensive long-term trading strategy.
Recognize key points of trend reversal for well-timed entries.
📌 Part 1: The Foundation of Long-Term Trading
Long-term trading focuses on capturing significant price movements over extended periods.
It requires patience, discipline, and the ability to ignore short-term noise.
📌 Part 2: Understanding the Simple Moving Average (SMA)
SMA is a trend-following indicator that smooths price data to reveal the underlying trend.
The 200-day SMA is particularly useful for long-term analysis, indicating the overall trend direction.
An upward-sloping 200-day SMA suggests a bullish trend, while a downward slope indicates a bearish trend.
📌 Part 3: Mastering the Relative Strength Index (RSI)
RSI measures the speed and change of price movements, helping identify overbought and oversold conditions.
An RSI above 70 suggests overbought conditions and a potential trend reversal.
An RSI below 30 indicates oversold conditions, potentially signaling a trend reversal to the upside.
📌 Part 4: Combining SMA and RSI for Long-Term Trading
Look for confluence: Confirm trend reversals when the 200-day SMA aligns with RSI overbought or oversold signals.
A bearish signal could be an overbought RSI crossing below the 200-day SMA, signaling a potential downtrend.
A bullish signal might be an oversold RSI crossing above the 200-day SMA, suggesting a potential uptrend.
📌 Part 5: Identifying Points of Trend Reversal
Key points to recognize trend reversals include:
Divergence: When the price makes new highs or lows but RSI doesn't, it signals a potential reversal.
Crossovers: Pay attention to the 200-day SMA crossing above or below the price chart.
Volume: Increasing trading volume often accompanies trend reversals.
🚀 Conclusion:
Long-term trading can be highly rewarding, but it requires a deep understanding of market trends and the right tools. By combining the SMA and RSI indicators, you gain a powerful strategy for identifying trend reversals and making well-informed trades with long-term potential. Remember that no strategy is infallible, so always employ proper risk management techniques and continuously refine your trading skills.
❗See related ideas below❗
Like, share, and leave your thoughts in the comments! Your engagement fuels our crypto discussions. 💚🚀💚

MACD-Divergences: Assessing Present Varying Exemplifications!_____
Hello Traders Investors And Community,
_____
Welcome to this tutorial in which I will analyze the MACD-Divergence and its various types that can come up in the market movements. The MACD is an indicator developed in 1986 and since then established as a primary indicator in the oscillator types besides the RSI or stochastic. The indicator mainly has the function of spotting reversals and potential entry points into the market to catch the appropriate values and upcoming reversal developments. Although the indicator can be used as a single signal for market action only it is best combined with other technical analysis aspects such as candlesticks or volume. The main timeframe to apply the indicator should be the daily timeframe, it can be also applied to higher timeframes such as the weekly to assess broader trends. The indicator can also be applied on lower timeframes such as the 4-hour or hourly however in this case the fake signals getting higher.
The MACD consists of 3 main elements, the first is the MACD-Line marked in my chart in orange which is calculated by the 12-day EMA (Exponential-Moving-Average) minus the 26-day EMA. The second element is the signal-line which is a 9-day EMA. Further comes the histogram which measures the distance from the MACD-Line to the signal line and the histogram is positive when the MACD-Line is above the signal-line as well as negative when it is below. The main signal happens when the MACD-Line crosses the signal-line when it crosses from the downside to the upside this is typically seen before a bullish reversal takes place and the same in reverse with the MACD-Line crossing the signal-line down when a bearish reversal takes place, in both cases also the histogram changes from positive to negative or negative to positive.
In any case, it is always necessary to combine the MACD with the current price-action happening as in this case comes the interesting part with the divergences happening that can lead to dedicated signals. These divergences happen when there is a discrepancy between MACD and the actual price-action happening indicating a potential change in direction of actual price-action as the MACD shows up with these signs. In any case, it is unavoidable to consider the price-action together with the MACD as otherwise, it can lead to catching a fake-out and getting stopped out of the position what should be avoided in trading. The MACD also does not typically spot overbought or oversold conditions as it is an indicator consisting of EMAs it represents the previously developed price-actions in relation to the ongoing and upcoming price-actions.
_____
Regular MACD Divergences:
__
Classical MACD Crossover
- The Classical MACD Crossover comes up when the MACD-line crosses the signal-line either from the upside to the downside or from the downside to the upside. Both versions can indicate a reversal into the direction the MACD-line crossed the signal-line however the timeframe and structure is important here. When this crossover happens on the lower timeframes below 6-hours it can happen that there are many fake signals with several crossovers behind each other while the price-action is actually trending into one direction. The higher timeframes such as the daily are therefore the best to apply this regular classical MACD crossover.
Classical MACD Histogram Divergence
- This divergence occurs when the histogram has formed a new high together with the price-action, for example, the histogram forms the new high at 0.3 in the MACD-histogram then the price-action moves further and forms a higher high exceeding the previous one however the MACD-histogram does not do a higher high also while staying below the 0.3 level. This indicates that the market is likely to reverse into the other direction because the histogram does not correspond with the actual price-action and therefore forms a divergence. This can be applied in the reverse direction as well and a good combination would be to look also at the volume or overbought and oversold conditions.
Histogram Divergence Fakeout
- In this case, it is the crucial part of the histogram divergence. The price-action and MACD fulfilled the initial requirements for a classical MACD histogram divergence and the price-action should markdown after forming the final high and the divergence, however in this case it does not happen instead the price-action moves lower a little bit signaling the possible normal development after this signal and then moves up again exceeding the previous high and stopping out traders who may have entered the market because of the divergence, after that the price-action can markdown finally and move lower, therefore it is necessary to look at the price-action also and see if the market is really ready to markdown after the signal.
__
Bearish Regular Divergence Ⅰ
- The Bearish Regular Divergence Ⅰ is a divergence in the price-action that marks two important confirmations including this a technical confirmation in the MACD normally seen in price-action. In this divergence, the price-action marks consecutive higher highs while the MACD forms a double-top with the rejection at the upper baseline confirming the double-top. This divergence is likely to reverse the previously established bullish trend to the downside and continue with bearish determinations. It is important to watch out for fakeouts before potentially entering and when this possibility is low it can be a good entry.
Bullish Regular Divergence Ⅰ
- This is the counterpart to the Bearish Regular Divergence Ⅰ. In this case the price-action marks lower lows in the structure in the best case also with falling volume and momentum while the MACD makes a double-bottom which is a good sign when both form that the price will likely reverse into the bullish direction. A trendline breakout of the previous established lower highs in the downtrend can also add additional confirmation to the final bullish reversal.
__
Bearish Regular Divergence Ⅱ
- This is a very interesting divergence as it combines the classical price-action formation double-top with the lower highs forming in the MACD. A confirmed double top alone can also be a strong signal for a reversal nevertheless with the additional MACD making lower lows this can add to the main bearish reversal coming in and accelerating it. A valid confirmation will take place when the price-action regularly confirms the double-top with the neckline breakout to the downside.
Bullish Regular Divergence Ⅱ
- Here is another divergence in which the price-action forms a reliable reversal-formation, in this case, a double-bottom which also can alone be the decisive factor for the final reversal, together then with the higher lows forming in the MACD it is a strong signal to reversing the trend into the bullish direction and similarly to the Bearish Regular Divergence Ⅱ it finally confirms with the neckline breakout by the established double-bottom with proper volume to the upside.
__
Bearish Regular Divergence Ⅲ
- This divergence has a good and appropriate application in the market formations to form. In this divergence, the price-actions form higher highs while the MACD forms lower lows signaling a bearish reversal to take place. A good confirmation occurs when the price-action closes below the lastly established lows and after that continues also further to form further bearish continuations, it can be a good point to spot the final reversal when the MACD looks like it develops the next lower high.
Bullish Regular Divergence Ⅲ
- This is the exact counterpart of the Bearish Regular Divergence Ⅲ while the price-action forms lower lows in the structure the MACD develops higher highs showing this given divergence and likely to indicate the bullish reversal to take place sooner or later. Additionally, a falling volume and momentum in the actual price-action will lead to more increased validations followed by an upcoming rise in volatility above previously lower highs, these structures and developments are always also important.
_____
Hidden MACD Divergences:
__
Bearish Hidden Divergence Ⅰ
- This divergence is actually the counterpart to the Bearish Regular Divergence Ⅰ and in this case, the MACD also forms a double top in the structure however unlikely as in the Bearish Regular Divergence Ⅰ in this case the price-action forms lower highs in the structure showing the exceptional weakness of the bulls as the price-action does not manages to maintain further higher highs, this is why the formation is finally likely to confirm bearishly to the downside and the reversal took place.
Bearish Hidden Divergence Ⅰ
- In this divergence the MACD forms a double-bottom with both lows forming a lower baseline in the MACD-histogram structure while the price-action forms higher lows which is very important here as such a constellation is normally defined as bullish with the possibility to reverse, the double-bottom in the MACD then confirms the further bullishness to establish and likely bullish volatility to show up in the structure, the requirement is that the established uptrend-line does not invalidate to the downside.
__
Bearish Hidden Divergence Ⅱ
- The next divergence is forming a classical reversal-development with the formation of a double-top in the price-action as the two highs form a horizontal baseline where the price-action rejects while the MACD is developing higher highs in the structure. In this case, the final confirmation sets place when the price-action breaks out below the neckline of the double-top in the structure which is the set-up for the further continuations bearishly to the downside, the best is to wait on the final confirmation before considering moving into.
Bullish Hidden Divergence Ⅱ
- This classical bullish reversal-formation marks out the potential stopping of the downtrend with two lows building the baseline of a potential double-bottom while the MACD is establishing this lower low structure it is the proper further confirmational part to develop a sufficient bullish reversal which will finally take place when the price-action breaks out above the upper neckline of the double-bottom to complete it and show up with further continuations to the upside.
__
Bearish Hidden Divergence Ⅲ
- When the price-action forms lower highs that do not maintain new higher highs in an uptrend it is always a sign that the uptrend is struggling and that it is likely to reverse together then with the higher highs divergence in the MACD to form the final bearish reversal has a high possibility to emerge which will validate when price-action moves below the previous lows in the uptrend and continues to the south.
Bullish Hidden Divergence Ⅲ
- With this form the uptrend and the higher highs structure that developed in the price-action have a tendency to reverse as the MACD forms the lower lows in the structure signaling that the MACD is already doing the markdown that follows also in the price-action. In this case the final confirmation will take place with a breakout below the established ascending trend-line after which a bearish continuation will likely follow up.
_____
Therefore moving through all these important different forms the MACD can be a substantial indicator for spotting reversals in the structure when done right. It is always necessary to maintain the objection to the current situation and further technical factors to apply the MACD-divergences rightly.
In this manner, thank you everybody for watching, support the idea with a like and follow or comment, have a good day as well as weekend, and all the best to you!
Information provided is only educational and should not be used to take action in the markets.
_____

DIVERGENCE CHEATSHEETHello dear traders and investors community!
The Divergence Cheat Sheet
Divergence occurs when the price of an asset and an indicator, such as the Relative Strength Index (RSI), move in opposite directions. This pattern provides valuable insights into potential price reversals or changes in trends.
Detecting Divergence
Detecting divergence is crucial for identifying lucrative trading opportunities. By using divergence indicators like the RSI, MACD, or Stochastic Oscillator, we can gain significant insights into market trends and potential price reversals.
To pinpoint divergence effectively, follow these steps:
Choose an indicator capable of detecting divergence, such as the RSI, MACD, or Stochastic Oscillator.
Look for discrepancies between the indicator and the price action. Regular divergence occurs when the price and the indicator move in opposite directions, while hidden divergence occurs when they move in the same direction but at different rates.
Monitor the direction of the trend. Divergence can indicate a trend reversal, so keeping track of the current market trend is crucial.
Confirm the divergence signal with other technical analysis tools. Divergence is just one piece of the puzzle, so it's essential to use other indicators to validate your trading decisions.
Examples of Divergence in Trading Charts
Let's examine a few examples of divergence on Bitcoin charts:
Strong Bullish Divergence:
When lows of the price decreases while the RSI increases, a regular bullish divergence occurs. This signals a potential trend reversal and presents an opportunity for a bullish trade.
Strong Bearish Divergence:
When highs the price of an asset is rising while the RSI is falling, it indicates a regular bearish divergence. This suggests a potential trend reversal and presents an opportunity for a bearish trade.
Medium Bullish Divergence:
When the lows of an asset remain equal while the RSI is rising, it indicates a medium bullish divergence. This suggests a potential increase in price, although it may not be a strong upward movement.
Medium Bearish Divergence:
When the highs of an asset remain unchanged while the RSI is decreasing, it indicates a medium bearish divergence. This suggests a potential decline in price, although the downward movement may not be significant.
Weak Bullish Divergence:
When the lows of an asset is decreasing while the RSI lows is equal, it indicates a weak bullish divergence. This suggests a potential increase in price, although it may not be a strong upward movement.
Weak Bearish Divergence:
When the highs of an asset are rising while the RSI remains unchanged, it indicates a moderate bearish divergence. This suggests a potential decline in price, although the downward movement may not be significant.
Hidden Bullish Divergence:
Hidden bullish divergence occurs when the price creates higher lows while the RSI is creating lower lows. This reinforces an existing uptrend and suggests its strength.
Hidden Bearish Divergence:
Hidden bearish divergence is observed when the price forms lower highs while the RSI forms higher highs. This indicates a potential weakening of the current uptrend and might signal a trend reversal or a pullback.
By recognizing these divergence patterns on trading charts, we can gain insights into potential market reversals, entry and exit points, and adjust trading strategies accordingly.
To effectively incorporate divergence into your trading, consider the following steps:
Identify the appropriate indicators: Choose reliable indicators such as RSI, MACD, or Stochastic Oscillator that can detect divergence patterns effectively.
Learn to spot divergence: Familiarize yourself with the different types of divergence patterns and practice identifying them on price charts. This will help you develop a trained eye for spotting potential trading opportunities.
Confirm with additional analysis: While divergence can provide valuable signals, it's essential to use other technical analysis tools to confirm your trading decisions. Look for supporting indicators, chart patterns, or trendline breaks that align with the divergence signal.
Set clear entry and exit criteria: Define your entry and exit points based on the divergence signal and your risk tolerance. Consider using stop-loss orders and take-profit levels to manage your trades effectively.
Practice risk management: Implement proper risk management techniques, such as position sizing, to protect your capital. Divergence alone should not be the sole basis for your trading decisions but rather an additional tool in your arsenal.
Backtest and refine your strategy: Test your divergence-based trading strategy on historical price data to assess its effectiveness. Make adjustments as needed and continuously monitor and evaluate your results to improve your trading approach.
Remember, divergence analysis is not foolproof and should be used in conjunction with other technical analysis methods and market factors.
Divergence analysis is a powerful tool that can provide us with an edge in the cryptocurrency market. By understanding and effectively utilizing divergence patterns, we can identify potential trend reversals, improve entry and exit timing, and enhance overall trading strategy. Incorporate divergence analysis into your trading approach and combine it with other technical indicators and risk management techniques for a well-rounded and informed trading strategy.

Quick Look - Bullish Divergence vs Bearish DivergenceHere is a graphical representation of the simple concept of bullish and bearish divergences.
Rules are pretty clear
Bearish Divergence
Happens only in uptrend
Observed on pivot Highs
Price makes higher high whereas oscillator makes lower high, indicating weakness and possible reversal
Bullish Divergence
Happens only in downtrend
Observed on pivot Lows
Price makes lower low whereas oscillator makes higher low, indicating weakness and possible reversal
Watch out for hidden divergences on the opposite pivots and breakouts in the direction of trend.

Trading RSI Divergence: Unveiling Potential Opportunities In the world of technical analysis, the Relative Strength Index (RSI) serves as a valuable tool for traders seeking to identify potential trend shifts and entry points. RSI divergence, a divergence between the RSI indicator and the price movement, is a powerful signal that can offer insights into upcoming price reversals. This article provides an in-depth exploration of how to identify RSI divergences and the different types that traders encounter.
Understanding RSI Divergence:
RSI divergence occurs when the movement of the RSI indicator diverges from the movement of the price chart. It can signal a change in momentum and a possible upcoming trend reversal. There are two main types of RSI divergence: bullish and bearish.
Bullish Divergence:
Bullish divergence happens when the price forms lower lows while the RSI forms higher lows. This suggests that although the price is trending downward, the RSI is showing potential upward momentum. Bullish divergence can indicate that a downtrend might be losing steam and a bullish reversal could be imminent.
Example of Bullish Divergence :
Bearish Divergence:
Bearish divergence occurs when the price forms higher highs while the RSI forms lower highs. In this scenario, the price is moving upward while the RSI indicates a potential loss of upward momentum. Bearish divergence can signal that an uptrend might be weakening and a bearish reversal could be on the horizon.
Example of Bearish Divergence :
Identifying RSI Divergence:
To spot RSI divergence, follow these steps:
Analyze Price and RSI Trends: Examine the price chart and the RSI indicator. Pay attention to the highs and lows on both the price chart and the RSI line.
Look for Discrepancies: In bullish divergence, when the price forms lower lows, check if the RSI forms higher lows. In bearish divergence, when the price forms higher highs, check if the RSI forms lower highs.
Confirm with Other Indicators: Utilize other technical indicators or chart patterns to confirm the divergence signal. These indicators can strengthen the validity of your divergence findings.
Consider the Trend: Evaluate the prevailing trend on higher timeframes. Divergence signals are more significant when they align with the broader trend direction.
Be Mindful of Timeframes: RSI divergence signals can occur on various timeframes. Consider using multiple timeframes to validate and refine your divergence analysis.
Conclusion:
RSI divergence is a potent tool that traders can use to identify potential trend reversals and entry points. By understanding the different types of RSI divergence and following a systematic approach to identification, traders can gain valuable insights into the underlying momentum of an asset's price movement. Remember that while RSI divergence can provide powerful signals, it's essential to use it in conjunction with other technical analysis tools for a comprehensive trading strategy. 🚀🔍

Time divergence trainingPlease note that the price was able to move from the ceiling during the time period specified in the box, but in the same time box, it could not return that way and it was filled within time. What it means in the market is that the power of buyers is more and there is a positive time divergence.

Convergence & DivergenceOne of the important concepts that traders should understand is the difference between divergence and convergence, two terms that are often used interchangeably but have distinct meanings and implications for trading.
Convergence refers to a situation where both the price of an asset and a technical indicator are moving in the same direction. For example, in a situation in which both the price of an asset and an indicator show an uptrend, there is a high probability that the trend will continue. So, here, the price and indicator CONVERGE (follow the same direction), and the trader may hesitate to trade in the opposite direction, as this is often seen as confirmation that the price movement is strong and likely to continue.
Divergence refers to a situation where the price of an asset is moving in one direction while a technical indicator is moving in the opposite direction. For example, if we again consider the situation when the price of an asset shows an uptrend and, this time, the trend of a technical indicator is falling, there is a high probability of a trend reversal. So, here, the price and indicator DIVERGE (go in opposite directions). This is often seen as a warning sign that the price movement may not be sustainable and could soon reverse.
To further understand the difference between convergence and divergence, let's look at some of the most commonly used technical indicators in trading:
Relative Strength Index (RSI)
RSI measures the strength of an asset by comparing the average gains and losses over a specified period of time. When the RSI value is above 70, it is considered overbought and is seen as likely to reverse soon. When the RSI value is below 30, it is considered oversold and is seen as likely to rebound.
RSI Convergence
RSI Divergence
Moving Average Convergence Divergence (MACD)
MACD measures the difference between two moving averages of an asset's price movements. Traders use the MACD to identify when bullish or bearish momentum is high. There is usually one short-term moving average and one long-term moving average. When the short-term moving average crosses above the long-term moving average, it is seen as a bullish signal, while a cross below the long-term moving average is seen as a bearish signal.
MACD Convergence
MACD Divergence
Commodity Channel Index (CCI)
CCI measures the difference between an asset's price change and its average price change. High positive readings indicate that the asset's price is above its average, which is seen as a bullish signal. Low negative readings indicate the asset's price is below its average, which is seen as a bearish signal. If the CCI value is above +100, this is seen as a signal of the start of an uptrend. If the CCI value is below -100, this is seen as a signal of the start of a downtrend.
CCI Convergence
CCI Divergence
It is crucial to note that convergence and divergence are not guaranteed indicators of future price movements. Traders should use them in conjunction with other technical and fundamental analyses to aid their trading decisions. Traders should also be cautious of the fact that all indicators are lagging behind the current price action, and therefore they must be prepared to adjust their strategies accordingly.
Trade safely and responsibly.
BluetonaFX
