FIBONACCI TOOL common reversal levels📊
❗️Fibonacci levels are one of the most popular tools for analysis. These are price levels that are located in certain parts of the movement corresponding to the mathematical Fibonacci numbers.
🟢What are Fibonacci numbers?
In the XIII century, the famous scientist Leonardo of Pisa lived in the Republic of Pisa – the first major medieval mathematician in Europe. On the cover of one of his most famous works was attributed filius Bonacci (son of Bonacci). Hence the nickname Fibonacci.
The Fibonacci numbers are a sequence of numbers derived from Leonardo's experiment on rabbits. The Pisan mathematician decided to find out how many pairs of rabbits will be in a fenced pen a year after the start of breeding (provided that there will be only one pair in the pen in the first month). In the third month, the cuts began to multiply recurrently – each subsequent number was equal to the sum of the previous two (1, 2, 3, 5, 8, 13, etc.).
If any number from the sequence is divided by the previous one, you get a number tending to 1.61803398875… This number is the "golden ratio". In algebra, such a number is called the Greek letter phi. When dividing any number from the sequence by the following, the inverse of phi 0.618 is obtained. When dividing any number from the sequence by the number following one, 0.382 is obtained. In this form, Fibonacci numbers are much more familiar to traders.
🔴Correction levels
Correction (retracement) - movement against an existing trend. The correction "absorbs" part of the trend movement. Of the Fibonacci numbers, 38.2 are mainly used for correction levels (from the previous trend movement), 50%, 61,8%, 78,6%.
Correction levels are based on candle wicks, in other words, on their maximum or minimum points. To build a correction level, you need to find a trend. Fibo levels can be asymmetrical, so it is especially important to pay attention to where the beginning and end of the wave on which the level is being built are located.
On a downtrend, 0% at the bottom, 100% at the top. When ascending, the opposite is true. The most significant correction level is 61.8. When a breakdown of this level occurs, a new trend in the opposite direction usually begins. After that, it is necessary to build a new corrective level.
Correction pattern – movement between minor correction levels. After such a move, the price usually moves to the key level of 61.8. 4 patterns are depending on which levels of correction the price concerns.
⚠️Even if the skills of analyzing the state of the market by Fibonacci levels will not be a big advantage in trading, then in any case it is a great (and to some extent integral) experience of technical analysis. Fibo levels can be combined with a footprint, deltas, and other tools. The trader will understand only in practice if it is possible to benefit from this or not.
❤️ Please, support our work with like & comment! ❤️
Futures

Three Steps to Become A PROFESSIONAL TRADER 👨💻👩💻
Hey traders,
The road to consistently profitable trading is hard and dangerous. This path can be split into three main milestones. Each of those requires discipline, time & patience.
📚The first step is your trading education.
Starting with a basic understanding of what are the financial markets & how they work and finishing with the sophisticated techniques of risk management, so many things must be learned.
In the beginning you will be most likely paralyzed by the complexity of the whole system. Even the choice of a trading education provider is not that simple taking into consideration the sheer amount number sources that could be found on the internet.
It is highly advisable for you to accompany your trading education with demo account trading so that you could apply what you’ve learned in practice.
💸It is imperative to invest in your education, while simultaneously saving up for your first(but not last) real trading account.
Spending your money on education & then saving in order to build your first trading account, a sufficient amount of money is required.
Be prepared for failures. Be prepared to blow your first and second trading account & fund it again. Be prepared that the majority of premium educational sources won't meet your expectations.
I don't know any trader who succeeded in trading without investing a huge amount of money in that.
👨💻With the money being invested & with the knowledge gained, you must practice on a real account.
You must choose the trading strategy that is appealing to you and start trading with that.
Quite soon you will realize that theoretical knowledge has nothing in common with real market conditions.
You will change trading strategies one after another until you finally find the one that truly makes sense to you.
Then you will spend a couple of years playing with that, learning the rules & constantly polishing your trading plan.
🏁At some moment you will stop losing. At some moment your trading account will start growing steadily and you will become a consistently profitable trader.
As the market conditions change constantly. You must be vigilant & learn to survive in a changing environment. Education, active investing & practice are required from you to keep being afloat.
I hope that this article will help you to build realistic expectations concerning trading.
If you are ready to learn a lot, invest money & practice many years not making a dime, then one day you will definitely make it.
Do you agree with my thoughts?
❤️Please, support this idea with like and comment!❤️

Term Structure Provides Fundamental CluesLast week, I wrote on processing spreads, a valuable tool that can provide clues about price direction. The price action in products that trade in the futures market like gasoline, heating oil, soybean meal, and soybean oil often tell us a lot about the path of least resistance for the crude oil and soybean futures contracts.
This week, I will turn my attention to term structure. Term structure is the price differential between one delivery period and another in the same commodity. Some traders call term structure time spreads, calendar spreads, front-to-back spreads, or switches. They are all the same, reflecting delivery or settlement premiums or discounts based only on time.
Backwardation- It’s what it sounds like
Contango- It’s not what it sounds like
A real-time supply and demand indicator
Commodities are unique- A mentor made a mint trading time spreads
Time spreads can enhance your commodity trading results- The cure for low and high commodity prices
The late Apple founder Steve Jobs once said, “My favorite things in life don’t cost any money. It’s really clear that the most precious resource we all have is time.” While Steve Jobs was referring to his mortality, time is a critical factor in commodities.
Close attention to term structure unlocks clues about fundamental supply and demand factors.
Backwardation- It’s what it sounds like
Backwardation is a condition where commodity prices for deferred delivery are lower than for nearby delivery. A backwardation suggests that supplies are tight, forcing nearby prices higher. The condition also indicates that producers will increase output in response to a market’s deficit, leading to lower future markets.
As of the end of last week, the NYMEX crude oil futures market was in backwardation.
The chart of NYMEX WTI crude oil for delivery in December 2022 minus the price for delivery in December 2021 was trading at over a $12 per barrel backwardation or discount. December 2021 futures settled at the $83.57 level on October 29, with the December 2022 futures at the $71.33 level. Robust demand, supply concerns, and other factors have driven the spread into the widest backwardation in years and NYMEX crude oil to the highest price since 2014. Higher crude oil prices tend to support a wider backwardation. Historically, the Middle East’s political volatility has caused supply concerns at higher prices as the region is home to over half the world’s petroleum reserves.
Crude oil is one example of a raw material market where the term structure reflects supply concerns. The trend towards a wider backwardation has been bullish for the energy commodity.
Contango- It’s not what it sounds like
While backwardation is a term that reflects the spread differentials, contango is another story. In the commodities lingo world, contango is backwardation’s opposite as it reflects a market where prices for deferred delivery are higher than for nearby delivery. Backwardation is a sign of supply concerns, whereas contango is present during periods of oversupply or equilibrium where supply and demand balance. The gold futures market is an example of a term structure in contango.
The daily chart highlights gold for delivery in December 2022 minus December 2021 is trading at a $10.30 contango or premium at the end of last week. The December 2021 futures were at the $1783.90 level, with the December 2022 contract at the $1794.20 level.
Central banks worldwide hold massive gold stocks as part of their foreign exchange reserves. Therefore, supply concerns tend to be low in the gold markets leading to a premium in its term structure. Moreover, gold has a long history as a means of exchange or money. Higher interest rates tend to push gold contangos higher.
Gold is one example of a commodity market in contango.
A real-time supply and demand indicator
A commodity’s term structure can be a helpful tool as it provides insight into supply and demand fundamentals. When a raw material price spikes higher because demand rises or supplies decline, the term structure tends to move into a widening backwardation. Producers respond by increasing output, creating the deferred discount.
When markets are in glut or oversupply conditions, producers often cut back on output, causing the chances for future deficits to develop. Thus, a steep contango can reflect the market’s perception that nearby oversupply will lead to eventual shortages.
Term structure is one of the puzzle pieces that comprise a market’s structure. The others are processing spreads, location and quality spreads, and substitution spreads.
Commodities are unique- A mentor made a mint trading time spreads
Commodities are essentials. Agricultural commodities feed and clothe the world and are increasingly providing alternative energy. Industrial commodities, including metals, energy, and minerals, are requirements for shelter, power, and infrastructure. Other raw materials have varying applications in daily life and even the financial system.
Shortages or gluts can have significant impacts on the global economy. The current inflationary pressures have roots in commodities, which had experienced price rises since the beginning of the worldwide pandemic when short-term lows gave way to bullish price action.
Supply chain bottlenecks and slowdowns or shutdowns at mines and processing facilities have put upward pressure on prices. Perhaps the most dramatic example came in the lumber futures market.
The quarterly lumber futures chart shows the price explosion to a record $1711.20 high in May 2021 on the back of slowdowns and shutdown at lumber mills and supply chain bottlenecks bringing wood to consumers during a period of rising demand. When lumber reached its May high, nearby January futures were far lower.
The chart shows January futures peaked at $1275 per 1,000 board feet, over $435 lower than the nearby contract at the May high.
When I worked at Phibro in the 1990s, my direct boss was Andy Hall, one of the most successful crude oil traders in history. While many market participants believe Mr. Hall churned out profits with long and short positions in the oil market, his greatest success came from what he called “structural risk positions.” He tended to buy the front months in the oil market and sell the deferred contracts when the market moved into contango. I remember the night when Saddam Hussein marched into Kuwait in 1990. The invasion caused the nearby price of crude oil to double in a matter of minutes.
Meanwhile, deferred oil prices declined, sending the spread to a massive backwardation. Mr. Hall pocketed hundreds of millions in profits on that night. His theory was that the risk of contango was limited over time, and the potential for spikes in backwardation increased the odds of success.
Time spreads can enhance your commodity trading results- The cure for low and high commodity prices
Commodity prices tend to rise to prices where producers increase output, consumers look for substitutes or limit buying, causing inventories to build. As supply rise to levels above demand, price find tops and reverse.
Conversely, prices tend to drop to levels where production becomes uneconomic. At low prices, consumers look to increase buying, and inventories decline, leading to price bottoms and upside reversals. The cure for high or low prices is those high or low prices in the world of commodities.
Meanwhile, highs or lows can be moving targets. As we learned in lumber and a host of other markets over the years, highs occur at levels that most analysts believe are illogical, irrational, and unreasonable. We learned the same holds on the downside as nearby NYMEX crude oil futures fell to a low of negative $40.32 per barrel in April 2020.
Time spreads can be real-time indicators of changes in a commodity’s supply and demand fundamentals. Understanding and monitoring term structure can only enhance the odds of success in the commodities asset class.
---
Register for the Monday Night Call below. You can also sign up to see the full articles for free, and get early access, using the other link below.
Trading advice given in this communication, if any, is based on information taken from trades and statistical services and other sources that we believe are reliable. The author does not guarantee that such information is accurate or complete and it should not be relied upon as such. Trading advice reflects the author’s good faith judgment at a specific time and is subject to change without notice. There is no guarantee that the advice the author provides will result in profitable trades. There is risk of loss in all futures and options trading. Any investment involves substantial risks, including, but not limited to, pricing volatility, inadequate liquidity, and the potential complete loss of principal. This article does not in any way constitute an offer or solicitation of an offer to buy or sell any investment, security, or commodity discussed herein, or any security in any jurisdiction in which such an offer would be unlawful under the securities laws of such jurisdiction.

Processing Spreads Provide Fundamental CluesSome futures markets offer contracts that are related to others and are processed products of the commodity. Understanding the price relationships, history, and paths of least resistance of the processed product versus the original input can provide valuable insight into supply and demand fundamentals. Moreover, these relationships shed light on other related assets.
Market structures are the pieces of a jigsaw puzzle
Processing spreads are real-time supply and demand barometers
The soybean crush spread
Gasoline and distillate crack spreads
Monitoring corporate profits
There is so much data at our fingertips, but we need to understand how to use and interpret the information. Processing spreads are invaluable tools as they are critical variables for market calculus when forecasting the path of least resistance of prices.
The crude oil and soybean futures markets offer liquid futures contracts in products that can reveal significant trends, warning signs, and calls to action. Anyone who undertakes a home improvement project knows that the job will not go well without the correct tools. Trying to hammer in a nail with a screwdriver is far from optimal. Tightening a bolt with an ax is a disaster. The best tool leads to the optimal result. The processing spread is one of the most critical tools in my investment and trading toolbox.
Market structure are the pieces of a jigsaw puzzle
In the world of commodities, market structure are integral pieces of a puzzle. When put together, they provide clues about the path of least resistance of prices as they reflect and can be real-time indicators of supply and demand fundamentals. A commodity’s market structure includes:
Term structure- Price differentials for nearby versus deferred delivery periods.
Location differentials- Price differentials for delivery of a raw material in different regions.
Quality differentials- Price differentials for differing grades, sizes, or composition of the same commodity.
Substitution spreads- The price comparison of one commodity for another that can serve as a substitute.
Processing spreads- The margin or differential for refining or transforming one commodity into its products.
Together, the various pieces that comprise a market’s structure create a picture that often points to higher or lower price paths.
Processing spreads are real-time supply and demand barometers
The processing spread is one of the valuable tools in an analysts’ toolbox. It tells us if demand for the products is rising or falling.
Consumers often require the processed product instead of the raw commodity. The differential between prices of the input, the commodity, and the output, the product, is a critical fundamental measure. Narrowing processing spreads signal falling demand while widening spreads are a sign that supplies are not keeping pace with requirements. Since futures contracts prices are constantly changing, processing spreads can be volatile. When the commodity and product trade in the futures market, the differentials provide a unique supply and demand perspective for traders and investors. There can be many reasons for price variance in processing spreads. However, comparing them to historical levels can serve as real-time indicators of fundamental forces that determine the underlying commodity’s price direction when exogenous factors are not impacting the overall refining or treatment process.
Many commodities do not offer futures contracts in the products. The soybean and crude oil markets are exceptions.
The soybean crush spread
Soybean futures trade on the CME’s CBOT division. Soybean products, soybean meal, and soybean oil also trade in the futures markets on the CBOT with separate and independent futures contracts. Soybean meal is a critical ingredient in animal feed, while soybean oil is cooking oil. Both have other uses.
Processors crush raw soybeans into the two products; the oil is the liquid from the crushing process, while the meal is the solid substance.
The soybean crush spread can be highly volatile.
The monthly chart shows the soybean crush spread over the past fifteen years. The spread traded to a low of a quarter of one cent to as high as $2.1950. The low was in 2013 when soybean futures were trending lower from the all-time high in 2012 at $17.9475 per bushel. The high was in October 2014 when soybean futures were consolidating at lower levels. The move to the high was because consumers bought soybean products at lower prices around the $10 per bushel level.
More recently, the crush spread signaled that soybean futures had run out of downside steam. After trading to a high of $16.7725 per bushel in May 2021, the oilseed futures fell below $12 in October. When soybeans were on the high in May, the crush fell to a low of 52.75 cents.
At high soybean prices, consumers backed off buying the oilseed products, leading to a price correction that took the price below the $12 per bushel level in October. Meanwhile, falling prices caused demand for products to return. The crush spreads traded to the most recent high at $1.9050 during the week of October 18. The rising crush spread was a sign of robust demand that lifted the raw soybean futures from the recent low.
The November soybean futures chart shows the rise from a low of $11.8450 to the $12.50 level. The price action in the crush spread was a signal that demand for products would lift the soybean futures price. The processing spread action signaled the price bottom over the past weeks.
Gasoline and distillate crack spreads
Crude oil refiners process the raw energy commodity that powers the world into products, gasoline, and distillates. The NYMEX futures market trades contracts in crude oil, gasoline, and heating oil. Heating oil is a distillate fuel that is a proxy for other distillates, including jet and diesel fuels. Refineries process crude oil into the oil products by heating them to different temperatures in a catalytic cracker. The price differential between the input, crude oil, and the output, the products, are “crack spreads.” Rising crack spreads point to increasing demand for oil products. When they fall, it is a sign of oversupply or weak demand.
Crude oil futures reached lows in April 2020 during the height of the global pandemic’s impact on markets across all asset classes.
The NYMEX crude oil futures weekly chart highlights the bullish trend since April 2020 as the energy commodity has made higher lows and higher highs.
The weekly chart of the gasoline crack spreads highlights the bullish trend since March 2020. Gasoline is a seasonal commodity that tends to reach highs during the spring and summer months and decline during the winter as drivers tend to put more mileage on their cars during the warm months. However, at the $17.63 per barrel level at the end of last week, the gasoline crack spread was appreciable higher than the peak in October 2020, when it reached $11.62 per barrel. The gasoline crack spread has provided bullish validation for the path of least resistance of crude oil’s price.
The weekly heating oil or distillate crack spread chart also displays a bullish trend. Distillates tend to be less seasonal than gasoline as jet and diesel requirements are year-round. At the $22.53 per barrel level at the end of last week, the heating oil crack was far higher than its October 2020 peak at $9.96 per barrel.
The crack spreads have supported the rising crude oil price as they point to robust product demand.
Monitoring corporate profits
While processing spreads can provide insight into the path of least resistance of prices for commodities that are inputs, they are also real-time earnings indicators for companies that refine or process the raw commodities into the products.
Refiners or processors tend to buy the input at market prices and sell products at market prices. The refiners and processors make significant capital investments in refineries or other processing equipment. They make or lose money on the processing spread. When they widen, they experience a profit bonanza; when they fall, times can get rough. When the spreads rise above the cost of the process, profits rise. Low processing spread levels can lead to losses.
Valero (VLO) is a company that refines crude oil into oil products.
The chart shows that the high in October 2020 was at $44.88 per share. In October 2021, VLO was over the $80 level at the end of last week. Rising crack spreads have lifted profits for the oil refiner.
Archer Daniel Midland (ADM) and Bunge Ltd. (BG) are leading agricultural processors. Soybean processing is one of the many business lines for the two companies. The rising soybean crush spreads have lifted profits for the companies.
In October 2020, ADM shares reached a high of $52.05 per share. At the end of last week, the stock was at the $66.22 level.
BG shares reached a high of $60.50 in October 2020 and were trading at the $88.33 level at the end of last week. The rise soybean crush spreads at least partially supported rising profits and higher share prices for ADM and BG.
Processing spreads are real-time indicators for the demand of the commodities that are the inputs. They are also real-time earnings barometers for companies that process commodities into products. Any tool that improves your ability to analyze markets is worth keeping in that toolbelt.
---
The full article and spread charts are available using the link below. You can also sign up for the Monday Night Strategy Call below.
Trading advice given in this communication, if any, is based on information taken from trades and statistical services and other sources that we believe are reliable. The author does not guarantee that such information is accurate or complete and it should not be relied upon as such. Trading advice reflects the author’s good faith judgment at a specific time and is subject to change without notice. There is no guarantee that the advice the author provides will result in profitable trades. There is risk of loss in all futures and options trading. Any investment involves substantial risks, including, but not limited to, pricing volatility, inadequate liquidity, and the potential complete loss of principal. This article does not in any way constitute an offer or solicitation of an offer to buy or sell any investment, security, or commodity discussed herein, or any security in any jurisdiction in which such an offer would be unlawful under the securities laws of such jurisdiction.

Education: Three Day Trailing Stop Rule (3DTSR)ICEUS:KC1!
I learned a handy tool used to manage risk under certain circumstances - the Three Day Trailing Stop Rule (3DTSR)
In this example, I actually fade the 3DTSR, but being able to execute different styles of trading strategies reflects an understanding of them, while acknowledging that no system or strategy used in markets will be perfect.
Three Day Trailing Stop Rule:
There is one initial criteria for the 3DTSR to become active -
Either
Upon Pattern Breakout - to limit initial risk/add to position at lower relative risk
OR
Upon Reaching 70% of Target from Breakout as a Trailing Stop
In an Uptrend, to exit a position using the 3DTSR
Day 1 is the High Day, defined by a new price high - at this point, we are not aware of the setup
Day 2 is the Setup Day, defined by a closing price (end of day) that is below the low of Day 1 - at this point, the trigger is active
Day 3 is the Trigger Day, as the stop is placed below the low of Day 2
The 3DTSR can also be used as an entry strategy, as shown in the chart here.
Day 1 = High Day
Day 2 = Setup Day, where price closed below the low of Day 1
Instead of placing a stop below the low of day 2, here I fade the 3DTSR by ADDING to a long coffee position, and jamming the stop to below the low of Day 2
Day 3 = The low of Day 2, or the trigger, is never penetrated, and price opens a cent higher
If using the Trigger as a stop, or below the low of Day 2, and using the Triangle shown to imply a measured target, this is a whopping 20 to 1 trade setup.
Do you have any profitable trading systems or strategies?

Why Implied Volatility Is A Critical Tool For All TradersTraders and investors use different sets of tools when approaching markets. Some are fundamentalists, pouring through balance sheets, supply and demand data, and other macro and microeconomic information to predict the future prices of assets. Others have a strictly technical approach to markets, following trends and the path of least resistance of prices. Still, others combine the two to look for opportunities where fundamental and technical analysis merge to improve the chances of success.
The past is history; the present is all that matters for traders and investors
Historical volatility is a map of the past price variance for asset prices
Implied volatility is a real-time sentiment indicator
The primary variable determining put and call option prices
The three critical factors implied volatility reveals
Yogi Berra, the hall of fame catcher and armchair philosopher, once said, “The future ain’t what it used to be.” All market participants have the same goal, to increase their nest eggs. Projecting the future is the route to achieve their goal.
Implied volatility is a tool that all market participants need to embrace as it is a real-time indicator of market sentiment.
The past is history; the present is all that matters for traders and investors
History depends on interpretation. When it comes to markets, Napoleon Bonaparte may have said it best, “history is a set of lies agreed upon.” An asset’s price moved higher or lower in the past because of a collection of variables viewed through a prism that leads to a collective conclusion that has broad acceptance but may not be accurate. Taking a risk-based position on an inaccurate conclusion could lead to mistakes and losses.
When we consider buying or selling any asset, all that matters is the present. The current price of any asset is always the correct price because it is the level a seller is willing to accept and a buyer is willing to pay in a transparent environment, the market.
Historical volatility is a map of the past price variance for asset prices
Historical volatility is an objective statistical tool that defines the price variance of the past. Any disclosure document tells us that past performance is no guaranty of future performance. We must view historical volatility precisely the same way, with more than a grain of salt.
Historical volatility is a guide, but remember what Yogi said, “the future ain’t what it used to be!”
We calculate historical volatility by determining the average deviation from the average price over a given period. When it comes to math, the formulas are:
A simple explanation of the complicated formula comes in seven easy steps:
1. Collect the historical prices for the asset
2. Compute the expected price (mean) of the historical prices.
3. Work out the difference between the average price and each price in the series.
4. Square the differences from the previous step.
5. Determine the sum of the squared differences.
6. Divide the differences by the total number of prices (find variance).
7. Compute the square root of the variance computed in the previous step.
Implied volatility is a real-time sentiment indicator
While we can calculate historical volatility from historical data, implied volatility is a different story. Implied volatility is the expected or projected volatility or price variance of an asset over time.
We back into calculating implied volatility using an options pricing model. We can establish an implied volatility reading by entering the option value into the Black-Scholes options pricing formula or other formulas that determine options prices. If we have a put or call options price, we can solve for the implied volatility level. The Black-Scholes formula in mathematical notation is:
The primary variable determining put and call option prices
There are no option prices without implied volatility as it is the critical variable that determines put and call option values. Yogi also said, “You can observe a lot by watching.” The current implied volatility level is the market’s consensus perception of what volatility or price variance will be during the life of the put or call option.
Observing and watching reveals the constant changes in implied volatility levels, which can be highly volatile over time. Option traders call an option’s sensitivity to changes in implied volatility Vega, which measures the change in an option price for a one-point change in implied volatility.
Implied volatility is constantly changing. Yogi had another great saying, “If the world were perfect, it wouldn’t be,” which rings true for implied volatility which can change in the blink of an eye. Option traders pay lots of attention to their Vega risk as the volatility of implied volatility can be…highly volatile! How’s that for a tongue twister?
The three critical factors implied volatility reveals
Implied volatility is a valuable tool for all traders and investors for three significant reasons:
It is a real-time indicator of the market’s perception of the future price range of an asset.
It can change suddenly, and changes often occur before the price of an asset reacts, making implied volatility a leading indicator.
Implied volatility reflects the wisdom of the crowd, and crowds tend to make better decisions than individuals. Moreover, it is reading that reflects the present, not the past, and is a constantly changing measure of consensus forecasts for the future.
As traders and investors, we exist in the present. We attempt to increase our wealth with long and short risk positions that either add or subtract from our nest egg in the future. Implied volatility is a critical measure we should understand, utilize, and always keep in our toolbox. Any project requires the right tools. Implied volatility’s value is that it reflects a snapshot of the current market’s consensus.
Historical volatility depends on “Deja vu” happening “all over again.” Implied volatility is a measure that understands that the “future ain’t what it used to be.”
-----
Register for our Monday Night Call using the link below. You can view this full article (with specific examples) and get early access to future articles for free using the other link below.
Trading advice given in this communication, if any, is based on information taken from trades and statistical services and other sources that we believe are reliable. The author does not guarantee that such information is accurate or complete and it should not be relied upon as such. Trading advice reflects the author’s good faith judgment at a specific time and is subject to change without notice. There is no guarantee that the advice the author provides will result in profitable trades. There is risk of loss in all futures and options trading. Any investment involves substantial risks, including, but not limited to, pricing volatility, inadequate liquidity, and the potential complete loss of principal. This article does not in any way constitute an offer or solicitation of an offer to buy or sell any investment, security, or commodity discussed herein, or any security in any jurisdiction in which such an offer would be unlawful under the securities laws of such jurisdiction.

Understanding Sessions - DAX FuturesFollow up from yesterday's post for US Futures, but same concepts apply for ALL assets in any market.
See this example from the action this morning.
DAX hasn't yet settled beneath the US Session Open, clearly indicating current pressure remains up.
Yet the range potential on a push higher or lower is nice and wide. For these cases I tend to prefer to play the reaction to the next move, not predict the move itself. If you're scalping, you can use the smaller timeframe session open such as 5 minute as a guide for 'in the moment' pressure, but always keep these bigger sessions in mind and where you are in relation to them.
Reference my earlier posts from yesterday and this morning for ES for more info.

Understanding Sessions - ES FuturesFollow up from yesterday's post.
See this example from the action this morning.
The rip higher off the open to grab supply, only to reverse on the next 15 min bar, taking out the Open price, immediately heading for where? The Pre-Equity Open Defender created hours before the normal session open.
This is critical because the Pre-Equity Open in Futures is a helpful guide not just in Futures, but for SPY, QQQ, or any stock. It's serving as the guide for where the pressure is for the morning. It can often act like it did today, halting the selling to reverse higher. It ALSO works in the other direction, when equities Open at 9:30am, where are we in relation to the Pre-Equity Open in Futures? If below, that's downside pressure until we forceably breakthrough it.
Remember - once the level is tagged, many of the resting orders have been filled. More can come in behind it, but an intra-day retrace all the way too any of these Session Opens is more likely to at least push price to the other side of it, finding out "what is there" orderflow wise.

Pre-market and the futures. Are they meaningful? Often times we find ourselves staring at the futures or the pre-market before the actual markets open. Is there a point?
And why does it matter whether we have an opinion about the futures or the pre-market?

ICHIMOKU-DMI-RSI-setupWhen DMI is above 20
and top of Histogram sticks on DMI = Green --- go Long
and top of Histogram sticks on DMI = RED --- Short
NOTE: If candles are far away from cloud, try to wait for a better entry, as candles move toward the cloud and thru moving averages for support/resistance entries.
If DMI is below 20 , no entry
Above the cloud is long, Below the cloud is Short
As candles move thru the cloud, long or short, enter as it exits the cloud, then use the cloud edge as stop loss.
Use the RSI as it nears top or bottom for possible long/short exits.
BUY and SELL triangles to help with possible entry / exit points.
120 day MA added for reference point to
I mostly use this on 1 min, 3 min and 5 min for daytrading futures, stocks. Can be used on anything. Higher time frames are more for swing trading.

IMPROVE YOUR TRADING | Simple Flowchart For You to Follow 🧭📍
A short ⚠️disclaimer before we start:
the rules that will be discussed in this post are applicable only for technicians - traders that are relying on price action/structure/etc.
Also, we assume that structure levels do work and for us, key levels are considered to be the safest trading zones/points.
In order to increase the accuracy of your predictions analyzing different financial markets, you must learn to identify the direction of the market.📈
The identification of the market trend must be based on strict & reliable & testable rules.
It can be based on technical indicators or price action
Personally, I prefer to rely on price action.
Here are a couple of examples of how I identify the market trend:
There are three main types of market trends:
Bullish Trend
Bearish Trend
Sideways Market
Depending on the current direction of the market, on the chart, I drew a flow chart✔️ that will help you to act safely.
➡️Sideways market signifies consolidation & indecision. Usually being in such a state the market tends to coil in horizontal ranges.
To trade such a market safely, the best option for you will be to wait for a breakout of the range & wait for the initiation of the trend.
➡️Once you spotted a bullish market, do not rush to buy.
Your task will be to identify the closest strong structure support.
You must be patient enough to let the price reach that support first (and by the way, there is no guarantee that it will happen) and then you must wait for a certain confirmation.
Please, check the article about different types of confirmations:
Only once you get the needed confirmation you can buy the market.
➡️The same strategy will be applicable to a bearish market.
Spotting a short rally it is way early to just sell the asset from a random point.
You must find the closest strong structure resistance and wait for the moment when the price will approach that.
Then your task will be to wait for a confirmation and only when you got the reliable trigger you short the market.
🦉Try to rely on this flow chart and I promise you that you will see a dramatic increase in your trading performance.
And even though it may appear to you that this flow chart is TOO SIMPLE, in practice, even such a set of rules requires iron discipline and patience.
Thank you so much for reading this article,
I hope you enjoy it!
❤️Please, support it with like and comment. Thank you!

📈📉How Market Cycles Work | Bull & Bear Market 🐿
All the financial markets are cyclical :
after a sharp and strong bullish trend always comes a severe bearish rally.
After panic & massive selloffs, the market tends to recover and awakens optimism closing a vicious circle.
Watching carefully how the price acts during these cycles, an observer can identify the recurring stages .
#1 Accumulation
The accumulation stage starts once the market finds its bottom.
Bearish pressure weakens and the market starts trading in sideways.
While the crowd remains cautious, smart money like banks and hedge funds start buying the asset considering that to be undervalued.
It leads to occasional moderate spikes of a price.
Being the best time to buy the market, the accumulation stage is the hardest to spot correctly. Global pessimism and disbelief make the investor scared to buy the asset.
#2 - 3 Public Participation & Excess Stage
The accumulation stage and the actions of smart money make the crowd buy the asset steadily. Pushing the market to new highs and generating sufficient profits, the crowd brings more and more liquidity into the market.
Bullish trend is universally confirmed.
The optimism steadily transforms into euphoria and the asset quickly becomes overvalued. Greed starts to dominate the crowd. Record highs are reached and no one doubts further growth.
#4 Distribution
At some moment the market stops growing. Even though everyone is very confident in a bullish continuation, the market naturally refuses to grow.
Moreover, the market starts to slow down and volatility drops steadily.
The market starts ranging and trade in sideways.
Smart money starts selling their positions steadily to a greedy crowd.
#5 Bearish Trend
With an absence of growth, more and more market participants start selling the asset. Optimism steadily vanishes and pessimism comes into play.
Contemplating negative figures, the crowd starts to panic, making the market fall sharply.
The outlook is dark and no one believes in recovery.
Then the market suddenly starts slowing down and the cycle repeats.
Watch how the price acts, learn the price action & master the market cycles to benefit from any of them.
❤️ Please, if you enjoyed this article, like it and share your feedback in a comment section. Thank you! ❤️

History of Forex | From Ancient to the Modern Day TradingWe have come a long way from the previously practiced barter system to the modern-day system of trading currency. Following is a brief summary of the evolution of currency and how it gave rise to Forex Trading.
Here are the main stages that are illustrated on the chart:
1️⃣The Ancient system of Trading - Trading with Gold
As early as 6th century BC , the first gold coins were produced, and they acted as a currency because they had critical characteristics like portability, durability, divisibility, uniformity, limited supply and acceptability.
2️⃣Bank Notes Originated - Deposited Gold in banks in exchange for banknotes
3️⃣Role of Geography - Various banks of different regions printed different currencies
Gold Standard - Currency pegged to gold
In the 1800s countries adopted the gold standard. The gold standard guaranteed that the government would redeem any amount of paper money for its value in gold . This worked fine until World War I where European countries had to suspend the gold standard to print more money to pay for the war.
4️⃣Bretton Woods System - Currency pegged to USD
The first major transformation of the foreign exchange market, the Bretton Woods System, occurred toward the end of World War II.
The Bretton Woods Accord was established to create a stable environment by which global economies could restore themselves. It attempted this by creating an adjustable pegged foreign exchange market. An adjustable pegged exchange rate is an exchange rate policy whereby a currency is fixed to another currency. In this case, foreign countries would 'fix' their exchange rate to the US Dollar .
5️⃣Birth of Floating Currency - Currency that is not pegged to any assets or other currencies is known as a 'floating currency'.
And what will be next?
Very hard to say but blockchain technologies will make the system change again.

Day Trading ES with Simplicity! Initial Balance VWAP and LevelsHey everyone I thought I can share with you what I see working intraday trading the Futures markets. One size definitely does not fit all. Beware of people that tell you their way or the highway! This may resonate with some traders and not with other traders. Getting really good at identifying the Initial Balance, VWAP and Daily Weekly Monthly Levels for areas of Supply and Demand, (where macro traders sit) you can get a great edge over time with your trading and build a ton of confidence. Check it out for yourself. I also use order flow to actual enter and manage my trade ideas but that is for another topic. Everyone take care out there.

📈📉How Market Cycles Work | Bull & Bear Market 🐿
All the financial markets are cyclical :
after a sharp and strong bullish trend always comes a severe bearish rally.
After panic & massive selloffs, the market tends to recover and awakens optimism closing a vicious circle.
Watching carefully how the price acts during these cycles, an observer can identify the recurring stages .
#1 Accumulation
The accumulation stage starts once the market finds its bottom.
Bearish pressure weakens and the market starts trading in sideways.
While the crowd remains cautious, smart money like banks and hedge funds start buying the asset considering that to be undervalued.
It leads to occasional moderate spikes of a price.
Being the best time to buy the market, the accumulation stage is the hardest to spot correctly. Global pessimism and disbelief make the investor scared to buy the asset.
#2 - 3 Public Participation & Excess Stage
The accumulation stage and the actions of smart money make the crowd buy the asset steadily. Pushing the market to new highs and generating sufficient profits, the crowd brings more and more liquidity into the market.
Bullish trend is universally confirmed.
The optimism steadily transforms into euphoria and the asset quickly becomes overvalued. Greed starts to dominate the crowd. Record highs are reached and no one doubts further growth.
#4 Distribution
At some moment the market stops growing. Even though everyone is very confident in a bullish continuation, the market naturally refuses to grow.
Moreover, the market starts to slow down and volatility drops steadily.
The market starts ranging and trade in sideways.
Smart money starts selling their positions steadily to a greedy crowd.
#5 Bearish Trend
With an absence of growth, more and more market participants start selling the asset. Optimism steadily vanishes and pessimism comes into play.
Contemplating negative figures, the crowd starts to panic, making the market fall sharply.
The outlook is dark and no one believes in recovery.
Then the market suddenly starts slowing down and the cycle repeats.
Watch how the price acts, learn the price action & master the market cycles to benefit from any of them.
❤️ Please, if you enjoyed this article, like it and share your feedback in a comment section. Thank you! ❤️

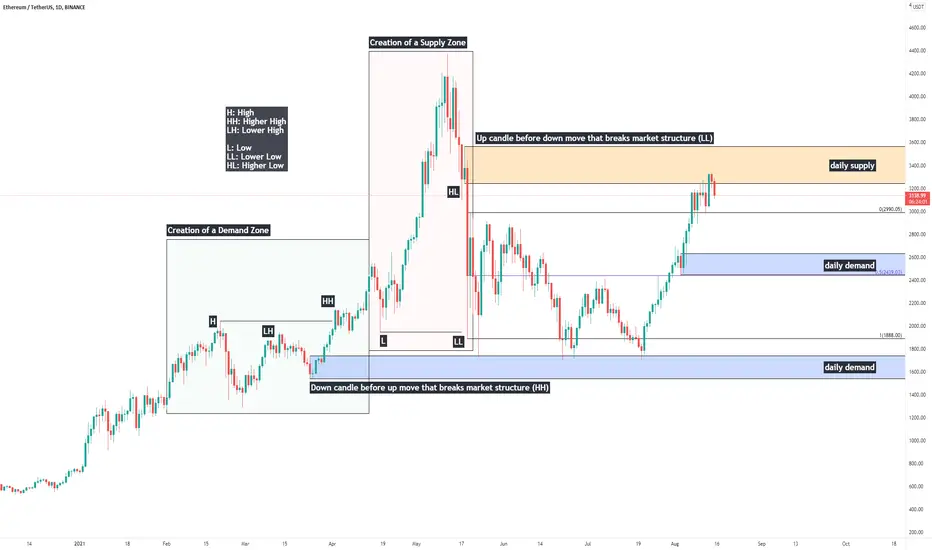
Price Action Study: Single Candle Supply & Demand ZonesHappy Sunday everybody, today I'll be providing a quick writeup on identification of single-candle Supply & Demand zones, otherwise known as "Orderblocks" (Credits to ICT for coining this phrase)
Supply & Demand are one of the most fundamental aspects of trading securities.
In price action - liquidity is believed to be the driving force behind market movements. The primary reason assets move is because of an imbalance between buyers and sellers - supply & demand.
If supply outweighs demand, price moves down.
If demand outweighs supply, price moves up.
If supply and demand are relatively the same - the market consolidates.
Supply and demand zones are created during consolidations - and today we are going to look at how to identify them. When prices is to return to these zones, we look for signs of accumulation to go long, or distribution to short.
Single candle supply and demand zones are also commonly referred to as "orderblocks" - here's how to identify them.
Demand/Bullish OB: A down candle before an up move that breaks market structure - a higher high.
Supply/Bearish OB: An up candle before a down move that breaks market structure - a lower low.
It is an important distinction - we need a structural break for the zone to be a meaningful region to watch if/when price is to return.
-Will, OptionsSwing Analyst
Why the S&P500 Micro Futures is one of the best markets to trade Hey Traders so today I wanted to show you a great market to consider trading the S&P500 Micro Futures. I think it is one of the easiest markets to learn vs the Forex and others. It offers great leverage and really good risk vs reward. Of course futures are different from stocks, crypto and forex. The are considered high risk because of the volatility and leverage. But definitely I think they are a good asset class to consider adding to every traders portfolio with the right risk management. Plus this market is a great way to start capturing all the great gains that the stock market has had in the last 10 years. As long as the bull market continues I think this market will remain strong.
Enjoy!
Trade Well,
Clifford

How to Assess Your Trading Performance|Consistency & Perspective
Hey traders,
👨🏻💻I am trading forex for more than 8 years.
During the last 5 years, I am actively posting my analysis & trades on TradingView.
Growing my audience, it was very peculiar for me to contemplate the reaction of my followers to my trading performance.
(by the way, we must say thanks to tradingview where the posting system does not allow to delete the posted trades so that each and every author is easily backtestable).
👩👩👧👧👨👨👧👧Those who follow me at least a half a year know that occasionally I have winning streaks when 9 out of 10 of my forecasts play out nicely. Sometimes, however, I face the drawdowns and catch a sequence of losing trades.
And sometimes the performance is mixed with the probabilities being on my side slightly.
🥇While the reaction to winning streaks is quite predictable:
I am praised by the members and get nice tips.
The reaction to losing streaks is worth discussing in detail.
It turned out that quite a huge portion of a trading community has a completely wrong understanding of a trading nature.
🤬The single loss is considered by them to be a failure, a mistake.
Facing the sequence of losses, they quickly become negatively biased to the person that they have just recently praised.
With the continuation of a drawdown, they blame the analyst and launch a barrage of criticism towards him.
🔍Then they are in a search again. They are looking for a trader that will be constantly right. Catching the new one during a winning streak, the cycle repeats.
At some moment such people become disappointed in trading and drop this business...
❗️Losses, losing streaks and negative days/weeks/months are inevitable. If you want to become a full-time trader, you must be prepared for the fact that trading won't give you a stable income.
Your equity curve will be in constant fluctuation.
Your goal in this game is simply to lose less than you make.
You must become disciplined enough to keep following the rules of your trading strategy no matter what.
You must learn to be consistent in your actions.
You should learn to perceive losing trades not as a failure but simply as the moment when the market takes its share.
Feeding you, giving you the opportunity to make money out of thin air,
the market definitely has a right to claim its dividends from you.
⭐️Change your mindset, learn to lose and the magic thing will happen.
❤️Please, support this idea with a like and comment!❤️

YOUR PROFIT FORMULA | Three Essential Ingredients 🤔💭💫
Hey traders, We must admit that it is phenomenally difficult to become a consistently profitable trader.
This journey requires years of practicing and training, constant losses, and nervous breakdowns.
If you are a struggling trader, if you are still looking for your way to succeed in this game, here is the formula that will help you to chase consistent profits.
💰Consistent profits = 📝Trading Strategy + 🤬Emotions + 📈Market Sentiment
Let's discuss each element separately.
📝Trading Strategy:
To be in profit in a long run requires an understanding of what do you actually trade.
You must have strict and objective entry conditions.
You must rely on the objective & verifiable rules for the execution of market analysis.
You must have a plan to follow.
A plan that is backtested and proved its efficiency.
🤬Emotions:
Even the best trading plan, the most accurate trading strategy can be easily beaten by emotions.
Emotional decisions such as revenge trading and early position close
can easily blow the account of any size in a blink of an eye.
The most disappointing thing to note right here is the fact that you can be taught how to execute technical analysis but you can not be taught to control your emotions.
Your main enemy here is yourself and being in a constant battle with your greed and fear it is very easy to go broke.
Only by being humble, disciplined and patient, you can successfully apply a trading strategy.
📈Market Sentiment:
Mastering your emotions and having studied a trading strategy, it looks like it is finally the time to make money.
However, occasionally the market tends to be irrational.
Being chaotic and unpredictable, sometimes the market neglects every technical and fundamental rule.
Crisis, euphoria: the reasons can be different.
The fact is that such things happen.
And it is your duty to learn to deal with unfavorable market conditions.
💰To become a consistently profitable trader, you must become the master of these three elements.
Only then the doors to freedom and independence will be opened to you.
❤️Please, support this idea with a like and comment!❤️

History of Forex | From Ancient to the Modern Day
We have come a long way from the previously practiced barter system to the modern-day system of trading currency. Following is a brief summary of the evolution of currency and how it gave rise to Forex Trading.
Here are the main stages that are illustrated on the chart:
1️⃣The Ancient system of Trading - Trading with Gold
As early as 6th century BC, the first gold coins were produced, and they acted as a currency because they had critical characteristics like portability, durability, divisibility, uniformity, limited supply and acceptability.
2️⃣Bank Notes Originated - Deposited Gold in banks in exchange for banknotes
3️⃣Role of Geography - Various banks of different regions printed different currencies
Gold Standard - Currency pegged to gold
In the 1800s countries adopted the gold standard. The gold standard guaranteed that the government would redeem any amount of paper money for its value in gold. This worked fine until World War I where European countries had to suspend the gold standard to print more money to pay for the war.
4️⃣Bretton Woods System - Currency pegged to USD
The first major transformation of the foreign exchange market, the Bretton Woods System, occurred toward the end of World War II.
The Bretton Woods Accord was established to create a stable environment by which global economies could restore themselves. It attempted this by creating an adjustable pegged foreign exchange market. An adjustable pegged exchange rate is an exchange rate policy whereby a currency is fixed to another currency. In this case, foreign countries would 'fix' their exchange rate to the US Dollar.
5️⃣Birth of Floating Currency - Currency that is not pegged to any assets or other currencies is known as a 'floating currency'.
And what will be next?
Very hard to say but blockchain technologies will make the system change again.
❤️Please, support this educational post with a like and lovely comment❤️

The 3 Types of Traders. Who Do You Belong To? 🤔
There are thousands of different ways to trade the market.
During the last 100 years, various trading strategies and techniques were invented.
One of the ways to categorize them is to split them by types of traders.
Such a category type will lean on 2 main elements:
trading frequency and time frame selection.
1️⃣ - Scalper
I guess 99% of newbie traders start from scalping.
Trying to catch quick market moves and become rich quick,
newbies are practicing different scalping strategies.
What is funny about scalping is the fact that such a trading style is considered to be the easiest by the majority while remaining one of the hardest in the view of pros.
The main obstacle with scalping is a constant focus and rapid decision-making.
Scalpers usually open dozens of trading positions during the trading session, most of the time being in front of the screen constantly.
Paying huge commissions to the broker and dealing with complete chaos on lower time frames, the majority simply can't survive the pressure and drop, leaving the pie to true gurus.
2️⃣ - Day Trader
Day trading or intraday trading is the most appealing to me.
Staying relatively active, the market gives some time for the trader for reflection & thinking.
Opening and managing on average 1-2 trades per trading session, the intraday trader is granted a certain degree of freedom.
However, with declining volatility, quite ofter intraday traders get a relatively low risk/reward ratio for their trades,
3️⃣ - Swing Trader
Swing trading is the best choice for traders having a full-time job.
Primarily being focused on daily/weekly time frames, swing trading is not demanding for a daily routine and aims at catching mid-term/long-term market moves.
With an average holding period being around 2 weeks and opening 1-2 trading positions per week, swing trading is considered to be the least emotional and involves low risk.
The main problem with swing trading is patience.
Correctly identifying the market trend and opening a trading position,
the majority tends to close their positions preliminary not being patient enough to let the price reach their target.
Which trading type do you prefer?
❤️Please, support this idea with a like and comment!❤️
