CAD/JPY: Broke The Breakout Pattern To The Downside This's EntryThis is an educational + analytic content that will teach why and how to enter a trade
Make sure you watch the price action closely in each analysis as this is a very important part of our method
Disclaimer : this analysis can change at anytime without notice and it is only for the purpose of assisting traders to make independent investments decisions
M-pattern
GOLD (XAUUSD) - more upside probable. This is an update on the daily time frame for gold. Things have changed.
I see some sort of continuation pattern developing creating probability for the upside. Note carefully my disclaimer below.
For every probability estimate in one direction there is always a residual probability for the opposite direction (- this is why we have stop-losses which must always be affordable).
For the record - and just in case - I never predicted that Gold was gonna crash. This doesn't mean it can't crash. What I said on a previous occasion was that 'Gold could be in trouble' and yes it could still be in trouble even if it punches north.
Disclaimers : This is not advice or encouragement to trade securities. No predictions and no guarantees supplied or implied. Heavy losses can be expected. Any previous advantageous performance shown in other scenarios, is not indicative of future performance. If you make decisions based on opinion expressed here or on my profile and you lose your money, or miss opportunity, kindly sue yourself.
EUR/USD: Triple Tops With +470 Pips Target Ready To Enter Now This is an educational + analytic content that will teach why and how to enter a trade
Make sure you watch the price action closely in each analysis as this is a very important part of our method
Disclaimer : this analysis can change at anytime without notice and it is only for the purpose of assisting traders to make independent investments decisions
NZD/JPY: H&S Pattern With +200 Pips Profit Available now This is an educational + analytic content that will teach why and how to enter a trade
Make sure you watch the price action closely in each analysis as this is a very important part of our method
Disclaimer : this analysis can change at anytime without notice and it is only for the purpose of assisting traders to make independent investments decisions
AUD/CAD: New Analysis H&S Pattern With +210 Pip Profit Watch NowThis is an educational + analytic content that will teach why and how to enter a trade
Make sure you watch the price action closely in each analysis as this is a very important part of our method
Disclaimer : this analysis can change at anytime without notice and it is only for the purpose of assisting traders to make independent investments decisions
NZDCAD potential bearish reversalon WEEKLY: price is trading around a strong support/resistance zone in red so we will be looking for objective sell setups on lower timeframes.
Keeping in mind that price can still go up to test our brown trendline to get more liquidity to be able to push downward.
on M30: we are waiting for an objective below our lower orange trendline last swing standing to sell.
or waiting for the right shoulder to form and then enter on the head and shoulders neckline break downward.
Pattern Triangle - How to find? how to use in a right way?Triangle is one of the most populat pattern. A lot of traders are trying to use, but mostly thay can not find it, or are drowing it in a wrong way. In this video I am searching patterns with you and also will give you most important principals for trading with it.
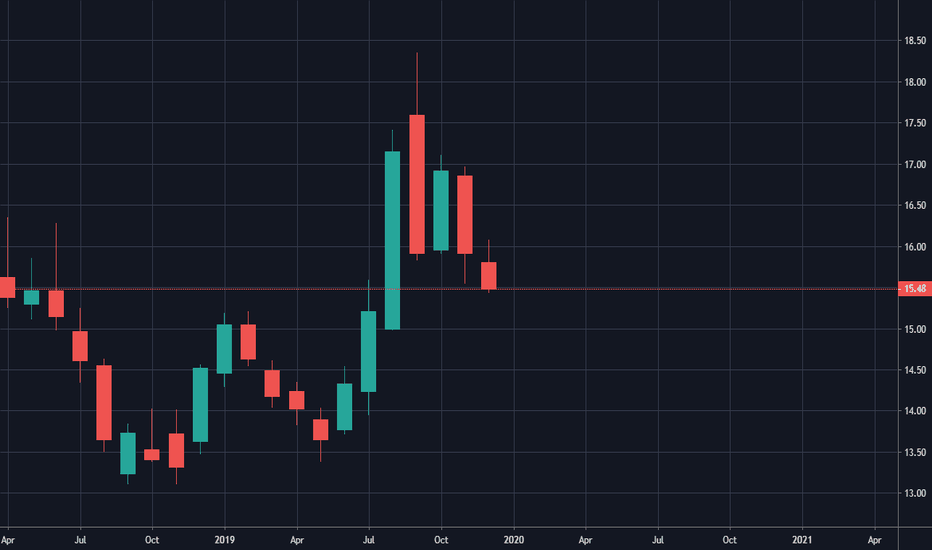
SLV Long Bull flag on monthly chart Monthly Chart shows a very nice Bull Flag for SLV A long stock play can be done if I want to hang onto the stocks for a few months. The length of the flag pole shows about a $3.5 move, so an option about half way up that move with the expiration of March would also work. In fact. I'm looking at the decently16 s priced strike that expires on March 31 2020
a Debit spread can also be done if i also sell the 17 strike on the same expiration That would make the cost of the spread at the current market price $21 with a profit potential of $79
How to 4x your money in 2 months with 3 Ascending TrianglesDear traders & everyone who is learning Technical Analysis!
In this video I'm going to show you how to recognize a core bullish trend & play Ascending Triangles. It would have given you amazing profits in the case of VFF.
Have fun watching! ;)
EURAUD big bullish equal ABCD settin upIn EUR/AUD pair there is this major resistance/support zone on weekly and daily chart. Price has break the ''ice zone'' on daily and is closed above the structure. If we get a retest on 1h - 4h chart between fib 38.2-50.0 levels, there would be equal move then to orginal trend on the zone's top.


