How to Trade When Buy/Sell Alerts Conflict with Market StructureQuestion:
If we have a buy/sell alert and an opposing Market Structure, how can we tell which will prevail or is heavier?
Answer (VX Algo System perspective):
In the VX Algo system, both the alert signals (buy/sell) and the market structure are crucial, but they serve different roles:
Alerts are dynamic triggers based on price action, momentum, or specific algorithmic conditions. They indicate potential entry or exit points.
Market Structure reflects the broader trend and underlying order flow, indicating the prevailing direction of the market (e.g., higher highs and higher lows for bullish structure, or lower highs and lower lows for bearish structure).
When an alert contradicts the prevailing market structure, the heavier factor is usually the Market Structure because it represents the dominant order flow and sentiment. In other words, alerts give you tactical timing, but market structure provides strategic context.
How to tell which prevails:
Confirm with Market Structure: If the market structure is bullish (uptrend), a buy alert aligns with it and is more likely to succeed. A sell alert against that structure is a warning sign that the alert may be weaker or a potential false signal.
Volume and Momentum: Use volume or momentum indicators (built into VX Algo or complementary tools) to see if the alert has strength behind it. A strong sell alert with high volume during an uptrend may indicate an imminent structure shift.
Multiple Timeframe Analysis: Check if the opposing alert is supported or rejected on higher timeframes. A buy alert on a lower timeframe against a bearish higher timeframe structure is less likely to prevail.
Risk Management: If you trade against structure alerts, reduce position size and tighten stops until the structure confirms the shift.
Summary: Market structure is heavier and more reliable for directional bias. Alerts provide tactical entry timing. When they conflict, lean on structure for bias but watch for alert strength as early signals of possible structure changes.
Market

ICT Concepts for FX and GOLD traders: 2025 edition🔍 ICT (Inner Circle Trader) is a trading methodology developed by Michael J. Huddleston. It focuses on market structure, smart money concepts (SMC), and how institutions manipulate liquidity to trap retail traders.
📚 It's not about indicators or over-complication — it's about reading the price action like a pro, understanding where liquidity is, and trading with the banks, not against them.
📐 1. Market Structure
Understand Highs & Lows: Identify break of structure (BOS) and change of character (CHOCH)
Follow the macro to micro flow: D1 > H4 > M15 for precision entries
🧱 2. Order Blocks (OBs)
An order block is the last bullish or bearish candle before a major price move.
Banks and institutions place large orders here.
Smart traders look for price to return to these areas (mitigation), then enter with tight stop losses.
👉 Think of OBs as institutional footprints on the chart.
💧 3. Liquidity Zones
Equal highs/lows, trendline touches, support/resistance — these are liquidity traps.
ICT teaches that price often hunts liquidity before reversing. That’s why many retail traders get stopped out.
Learn to trade into liquidity, not off it.
🔄 4. Fair Value Gaps (FVGs)
Also called imbalances — when price moves too fast and leaves gaps.
Price often retraces to "fill the gap" — a key entry point for ICT traders.
🥇 ICT for Gold & Forex in 2025
💰 Why It Works for XAUUSD & Majors:
Gold is a highly manipulated asset, perfect for ICT-style trading.
It responds beautifully to liquidity grabs, order blocks, and Asian–London–New York session transitions.
Forex majors (EUR/USD, GBP/USD, etc.) are also ideal since they’re heavily influenced by institutional flow and news-driven liquidity hunts.
🕐 Timing Is Everything
Trade Killzones:
📍 London Killzone: 2AM–5AM EST
📍 New York Killzone: 7AM–10AM EST
These are high-volume sessions where institutions make their moves.
📈 Typical ICT Setup
▪️Spot liquidity zone above or below recent price
▪️Wait for liquidity sweep (stop hunt)
▪️Identify nearby order block or FVG
▪️Enter on a pullback into OB/FVG
▪️Set tight SL just past the recent swing
Target internal range, opposing OB, or next liquidity level
👨💻 Why FX/GOLD Traders Love ICT
✅ It’s clean, no indicators, and highly logical
✅ Great for part-time trading — 1 or 2 trades a day
✅ Feels like "leveling up" your understanding of the market
✅ Perfect for backtesting and journaling on platforms like TradingView or SmartCharts
✅ Easy to integrate into algo-based systems or EAs for semi-automation
If you’re tired of indicators and guessing, and want to trade like the institutions, ICT is a game changer. In 2025, more prop firms and traders are applying ICT concepts to dominate markets like gold, forex, and even crypto.
🧭 Master the method. Understand the logic. Ride with the smart money.
🔥 Welcome to the next level of trading.

Forex: Why and How to Use TradingView
Dear readers, I am Trader Andrea Russo and today I want to talk to you about the reason why I use TradingView.
The Forex (Foreign Exchange) market is one of the largest and most dynamic in the world, with over 6 trillion dollars traded every day.
TradingView is one of the most popular platforms for technical analysis and chart viewing, particularly appreciated by Forex traders. In this guide, we will explore how to use TradingView to trade Forex, taking advantage of the tools and features offered by the platform.
What is TradingView?
TradingView is a technical analysis platform that offers advanced charts, drawing tools, customizable indicators, and an active community of traders. Among its main features:
Real-time charts on any timeframe, from 1 minute to daily or weekly.
Technical indicators such as RSI, MACD, moving averages, and much more.
Social trading to share ideas with other traders and learn from their analysis.
Drawing tools to plot trends, channels, and Fibonacci.
With its user-friendly interface, TradingView is ideal for beginner traders and those looking for advanced analysis.
How to Trade Forex with TradingView
1. Choose a Currency Pair
The first step to start trading Forex is to choose a currency pair to analyze, such as EUR/USD or GBP/JPY. Each pair represents the value relationship between two currencies. For example, in the case of EUR/USD, the base currency is the Euro and the counter currency is the US Dollar.
2. Use Charts
TradingView offers several views:
Candlestick Chart: Shows price movements in specific time frames. It is the most used chart in Forex.
Line Chart: Shows only closing prices, useful for observing general trends.
Bar Chart: Shows the open, close, high and low for each period.
These visualizations help you better understand the market trend.
3. Set Indicators
Indicators are essential tools in technical trading. On TradingView, you can use:
RSI (Relative Strength Index): Shows whether a currency pair is overbought or oversold (levels above 70 indicate overbought, below 30 oversold).
MACD (Moving Average Convergence Divergence): Provides trend reversal signals and can be used to confirm the market direction.
Moving Averages (MA): Helps identify the market direction and filter trading signals.
4. Customize Drawing Tools
TradingView offers powerful drawing tools such as:
Trend Lines: To plot support and resistance levels.
Fibonacci Retracement: To identify key price reversal levels.
Channels: To analyze price movements within a defined range.
These tools allow you to precisely track market entry and exit points.
5. Create Alerts
TradingView allows you to set custom alerts. You can receive notifications via email or directly on the platform when the price reaches certain levels. This is particularly useful for not missing important trading opportunities.
Forex Trading Strategies
1. Trend Trading
One of the most common strategies is trend following. When the market is in an uptrend (bullish trend), buy; when it is in a downtrend (bearish trend), sell. Use moving averages or the MACD indicator to identify the direction of the trend.
2. Retracement Trading
Retracements are corrective movements within a trend. You can use Fibonacci Retracement to identify support and resistance levels, and wait for the price to retrace before entering the market in the direction of the main trend.
3. Scalping
Scalping is a short-term strategy that aims to make small profits from rapid price movements. Use short timeframes (for example 1 minute or 5 minutes) and take advantage of spikes in volatility.
4. Breakout Trading
Breakout trading is based on breaking key support or resistance levels. When the price breaks these levels, a strong move in one direction is expected. Indicators such as ATR (Average True Range) help you monitor volatility and choose the right times to enter the market.
Forex Trading Tips
Risk Management: Forex is a highly leveraged market, so protecting your capital is key. Use stop losses and take profits to limit losses and protect gains.
Conclusions
TradingView is an excellent tool for Forex trading, thanks to its wide range of advanced features, ease of use and the ability to analyze charts accurately.

The Arrest of South Korean President Yoon and the MarketDear readers,
My name is Andrea Russo and today I want to talk to you about an event that has profoundly shaken the international political and financial scene: the arrest of South Korean President Yoon Suk Yeol. News of this caliber cannot leave us indifferent, especially considering the economic importance of South Korea on the global stage. With you, I want to analyze the consequences of this story, both for the stock market and for the currency market.
An unexpected political turning point
The arrest of Yoon Suk Yeol came like a bolt from the blue, fueling doubts about the political stability of South Korea. In recent months, his government had been at the center of controversy for its authoritarian management of power, culminating in the announcement of martial law last December. This act had already sparked negative reactions both nationally and internationally, with consequent repercussions on the financial markets.
Now, with his arrest, the unknowns increase. South Korea is one of Asia's major economies, with a strong presence in the technology and manufacturing sectors. Any political instability could undermine investor confidence, with knock-on effects on the markets.
The impact on the South Korean stock market
Despite the initial alarm, the KOSPI index, the main benchmark of the Seoul stock exchange, recorded only slight fluctuations, closing with an increase of 0.2% the day after the news. This moderate behavior suggests that investors are still assessing the extent of the political crisis before making drastic decisions.
However, it should be considered that some South Korean companies, especially technology exporters such as Samsung and LG, could come under pressure in the short term. The perception of instability could push foreign investors to diversify their positions, penalizing the South Korean market.
The dynamics of the forex market
The currency market, notoriously more reactive to geopolitical events, has shown signs of nervousness. The South Korean won (KRW) lost ground against the US dollar, with USD/KRW moving from 1,200 to 1,205 in the hours following the news. This slight depreciation reflects investor uncertainty about the country’s economic outlook.
The announcement of martial law has previously caused the won to depreciate significantly, falling 2% against major currencies. Forex is therefore likely to continue to be a key indicator of traders’ sentiment towards South Korea.
Looking ahead
Looking ahead, it is essential to monitor the South Korean government’s response to this crisis. If institutions can ensure an orderly transition of power, the negative impact on markets could be limited. Conversely, further signs of political instability could lead to capital flight and increased market volatility.
In addition, it remains to be seen how the world’s major economies react to the situation. South Korea has strong trade ties with the United States, China and the European Union, and any deterioration in international relations could amplify the economic repercussions.
Conclusion
Dear readers, the arrest of President Yoon Suk Yeol represents a crucial moment for South Korea. As always happens in cases of political uncertainty, the markets react quickly, but it is the medium and long term that will determine the true consequences of this event.
I will continue to follow the developments of this story closely, sharing my analyses and reflections with you. In the meantime, I invite you to stay informed and carefully consider every investment decision. Prudence, especially in times like this, is always a good advisor.
Best regards,
Andrea Russo

Los Angeles Fires: The Impact on Financial MarketsHello readers, I'm Andrea Russo and today I'm talking to you about the effects that a natural disaster, such as the devastating fires that are hitting Los Angeles, can have on financial markets.
The news is dramatic: 16 dead, 153,000 people evacuated and a city under siege by flames. In addition to the human and environmental impact, events like these can also profoundly affect the economy and, consequently, the financial markets. In this article I will explain how a trader like me analyzes these situations and which sectors are most affected.
The impact on local markets
Fires of this magnitude can put pressure on various economic sectors. Insurance companies, for example, are among the first to suffer: with the increase in claims for compensation for damage to properties, their profit margins are eroded, often causing a decline in stock prices.
On the other hand, there are sectors that could see an increase. Companies related to construction, building materials and reconstruction could see an increase in demand, especially in the medium term, when the restoration work begins. Monitoring stocks of companies that produce cement, steel or lumber can offer interesting insights for those who operate in the market.
Commodities under pressure
Natural disasters like these can also have an impact on the commodities market. In the case of fires, one of the most exposed sectors is the lumber sector. The destruction of forest resources in California could lead to an increase in lumber prices, creating speculative opportunities for those who operate in this market.
Another important aspect concerns agriculture: California is one of the most productive agricultural states in the United States. If the fires affect agricultural land or interrupt supply chains, we could see a rise in the prices of certain crops, such as fruits, vegetables or almonds, typical products of the region.
Impact on Market Indices and Investor Sentiment
Natural disasters such as fires generally tend to have little impact on major indices, such as the S&P 500, unless they affect strategic sectors or regions of global economic importance. However, it is important to keep an eye on volatility: the market could react with temporary downward movements, especially if investors perceive a broader risk to the local economy.
Furthermore, market psychology should never be underestimated. In situations of great uncertainty, investors tend to move towards assets considered "safe havens", such as gold or the US dollar. This could represent an opportunity for those who trade in these asset classes.
Conclusion
The Los Angeles fires are a tragedy that will leave both human and economic impacts. For a trader, monitoring the aftermath of events such as these is essential to identify potential opportunities or manage risks. Personally, I always try to carefully analyze the affected sectors and adapt my strategies based on market conditions.
I hope this analysis has been useful to you in understanding how a natural event can have an impact on financial markets and what dynamics to consider to make informed decisions.
Thanks for reading, I'll see you in the next article!
Andrea Russo

why you should avoid trading after a trending marketHello traders,
I saw This learning post today in the London session(24-7-24).
you can go for 5 minutes to understand this concept better, you can see a clear pattern on the chart, trending -> sideways/choppy -> trending -> sideways/choppy.
in the trending market, you see fast movement; in the choppy market, you see lots of SL hunting and wicks.
try to avoid such a market so you can make money in trending.
Note : not a finance advice

Market Makers in Crypto: Who Controls the Cryptocurrency Market?Functions of Market Makers
Market makers perform several essential functions in the cryptocurrency market, including:
Providing Liquidity: They ensure there is enough liquidity between buyers and sellers to maintain active market participation.
Providing Quotes: They offer bid and ask prices at any given time, facilitating trades between market participants.
Risk Management: Market makers manage trading risks and maintain a balanced risk-return ratio to protect their interests and those of their clients.
Providing Advice: They supply market information and analysis to assist clients in making informed trading decisions.
Improving Market Efficiency: By reducing the spread between buyers and sellers, market makers enhance overall market efficiency.
Market makers in the crypto industry operate similarly to traditional market makers. They provide market liquidity, execute buy and sell orders instantly, and earn profits from the spreads between these orders. However, due to the relatively unregulated nature of the cryptocurrency market, there is no stringent code of conduct for market makers, and the technical demands for ensuring transaction security are higher.
Market makers follow a simple principle: "buy low, sell high." This approach requires handling large volumes of transactions, sometimes up to tens of thousands per second. They use advanced algorithmic programs to monitor numerous parameters and recalculate forecast prices multiple times per second, thus providing market liquidity without incurring losses. Despite this, even sophisticated trading algorithms can falter due to rapid trade speeds or incorrect price predictions. During periods of high volatility, market makers might incur losses while trying to stabilize the market. Therefore, a stable or slightly fluctuating market is ideal for them, while days with significant price movements can lead to substantial losses.
In essence, while regular market participants react to past events, market makers anticipate future market movements to set optimal buy and sell prices and determine order volumes.
Cryptocurrency exchanges and market makers often collaborate closely. Some exchanges maintain their own market-making teams, while others partner with third-party market makers. This cooperation can take two forms:
Direct Cooperation with Crypto Exchanges: Exchanges offer special programs for market makers, providing personalized trading terminals. Through APIs, exchanges share order book information and market depth with market makers, facilitating pricing and matchmaking.
Indirect Cooperation with Crypto Exchanges: Market makers provide over-the-counter (OTC) market-making services through intermediaries or platforms.
Market makers are crucial but not mandatory for liquidity provision on crypto exchanges. They must negotiate terms such as commission distribution and trading volumes with exchanges to ensure profitable and smooth cooperation. Additionally, they must adhere to exchange rules and external regulations to ensure legal compliance.
From a trading mechanism perspective, market makers with internal exchange connections play a significant role in price determination, which can help prevent price manipulation to some extent. Their presence enhances exchange liquidity, improving user experience and loyalty, and making the exchange more profitable. Consequently, exchanges often offer discounts to market makers for their activities.
✅Disclaimer: Please be aware of the risks involved in trading. This idea was made for educational purposes only not for financial Investment Purposes.
---
• Look at my ideas about interesting altcoins in the related section down below ↓
• For more ideas please hit "Like" and "Follow"!

Order typesIn the past, a person would typically have to go to the brokerage or another financial entity to buy or sell a security. The trade would be then settled through a personal meeting or, as technology progressed, over the phone. Nonetheless, the implementation of modern technology within the financial markets of the 21st century made placing buy and sell orders as easy as a few mouse button clicks. Nowadays, many trading platforms allow their clients to execute various types of orders beyond ordinary buy and sell orders.
Key takeaways:
Using limit orders is generally considered one of the safest ways to buy or sell a security.
Modern technology allows placing buy and sell orders with a few mouse clicks.
A stop-loss and stop-limit orders are used to protect an investor’s capital.
A trailing stop locks in some of the accrued profits.
Quick trade orders get instantly filled by a single or double click on a bid or ask button.
Limit order
A buy limit order is used to buy a security at a specified price. This type of order is executed automatically in a case when the price of a security is lower than the value of the buy limit order. A sell limit order is used to sell a security at a specified price. It gets automatically filled when the price of a security is higher than the value of the sell limit order. This design occasionally allows for the execution of the buy limit order or the sell limit order at a better price. Generally, limit orders are one of the safest ways to purchase or sell a security.
Quick-trade order
Some trading platforms allow the use of quick-trade orders. A quick-trade order is a type of order that is instantly filled by a single or double click on a bid or ask button in a trading platform. These orders are relatively safe to use. However, filling this type of order in highly volatile markets might be difficult due to a quickly changing price.
Market order
When traders choose to use a market order, they let the market set the price of security. In essence, this means that for a buy market order, a trade execution occurs at the nearest ask. For a sell market order, a trade execution takes place at the nearest bid. The use of the market order is less safe in comparison to limit order because it allows for worse filling of orders in illiquid markets and markets dominated by algorithmic trading. However, some platforms offer their clients the option to choose the tolerance threshold for such trade orders.
Good ‘Til Canceled order (GTC)
This type of order remains active until it is filled or canceled.
Stop-loss and stop-limit orders
A stop-loss order sells a position at a market price if it reaches or passes a specified price. Unlike a stop-loss order, a stop-limit order liquidates a position only at a specified or better price. These types of orders are used to protect investor’s capital before depreciation.
Trailing stop order
A trailing stop order trails the price as it moves in the trader’s favor. For a long position, a trailing stop moves higher with the price but stays unchanged when the price falls. Similarly, for a short position, a trailing stop moves lower with the price but remains unchanged when the price rises. The intent of a trailing stop is to lock in some of the accrued profits.
Please feel free to express your ideas and thoughts in the comment section.
DISCLAIMER: This analysis is not intended to encourage any buying or selling of any particular securities. Furthermore, it should not be a basis for taking any trade action by an individual investor or any other entity. Therefore, your own due diligence is highly advised before entering a trade.

DOUBLE BOTTOMThe double bottom pattern is a technical analysis chart pattern that appears during a downtrend and indicates a possible trend reversal. It is formed by two consecutive lows that are approximately equal and separated by a peak in between
LIKE SHARE FOLLOW US

TYPES OF MARKET ANALYSIS1) Fundamental analysis.
fundamental analysis focus mainly on micro and macro event that will control market situations in the present and in the future. it includes various events in economic calendar like PPI CPI NonFarm Payroll, Interest rate decisions, and geopolitical senarios like election war climate issues etc
2) Technical analysis.
Technical analysis mainly focus on indicators chart analysis volume analysis, various analysis like following candle stick pattern, trading strategies based on indicators
3) Market sentiments
Market sentiments focus mainly on how the crowd anticipate wheich direction will market go, like when xauusd reached at its all time top everyone believed it will have a retracement from that zone
like share and follow us for more such informative contents

The art of trading in favor of the TrendWe have a clear bias of a psychological nature that basically consists of going against everything that experiences a movement in favor.
When a trend is established, it always tends to last longer than we expect:
_ It’s going to turn around now!, it’s going to turn around now! but it never does.
All that time you’re waiting for a market to turn is precious time you’re losing to go in favor. You’re missing multiple opportunities by waiting for just one, the turn.
And what’s worse, you’re probably even entering the market against it, with its consequent “bites” to your account.
When there is an established trend, the best thing you can do is wait for a retracement of it to enter in its favor.
Therefore:
- Every time there is a trend, for example bullish, if you go against it at every resistance you find, you are trading counter-trend.
- Likewise, if you go against it at every support, in a bearish trend, you are trading counter-trend.
Many times prices stop at supports and resistances, and you may get a “pinch” but by doing so you are not trading in the correct way but as the market wants you to do.

[EDU-Bite Sized Mini Series]Understanding Forex Market StructureHello fellow traders , my regular and new friends!
Welcome and thanks for dropping by my post.
Let's begin with our topic today!
The forex market, being decentralized and over-the-counter (OTC), operates differently from traditional centralized exchanges. To navigate it effectively, traders need to comprehend its unique structure.
Market structure refers to the arrangement of price action within a given market, encompassing key elements such as trends, support and resistance levels, and price behavior.
1. Trends:
Trends are one of the fundamental aspects of market structure. They depict the overall direction of price movement over time. Traders often classify trends as bullish (upward), bearish (downward), or ranging (sideways). Understanding the prevailing trend helps traders align their strategies accordingly.
2. Support and Resistance Levels:
Support and resistance levels (or known as supply and demand levels/zones) are areas where price tends to stall, reverse, or exhibit significant buying or selling pressures. These levels/areas form the building blocks of market structure and are crucial for identifying potential entry and exit points. Support represents levels where buying interest outweighs selling pressure, preventing prices from falling further. Conversely, resistance denotes areas where selling pressure surpasses buying interest, hindering further upward movement. If you have cluster of candle's tail in a area/levels, likely it would be supply/demand liquidity pocket
3. Price Behavior:
Price behavior within market structure provides valuable insights into market sentiment and participant dynamics. Patterns such as higher highs and higher lows in an uptrend, or lower highs and lower lows in a downtrend, signify the strength or weakness of a trend. Additionally, the manner in which price interacts with support and resistance levels can indicate potential reversals or continuations.
4. Market Phases:
Understanding different phases of the market, such as accumulation, markup, distribution, and markdown, aids in deciphering market structure. Each phase reflects the behavior of market participants and their collective impact on price action. Recognizing these phases enables traders to anticipate potential shifts in market direction and adjust their strategies accordingly.
Conclusion:
In summary, comprehending forex market structure is essential for effective trading. By analyzing trends, identifying key support and resistance levels, observing price behavior, and recognizing market phases, traders can make informed decisions and navigate the forex market with confidence.
Do check out my recorded video (in trading ideas) for the week to have more explanation in place.
Do Like and Boost if you have learnt something and enjoyed the content, thank you!
-- Get the right tools and an experienced Guide, you WILL navigate your way out of this "Dangerous Jungle"! --
*********************************************************************
Disclaimers:
The analysis shared through this channel are purely for educational and entertainment purposes only. They are by no means professional advice for individual/s to enter trades for investment or trading purposes.
*********************************************************************

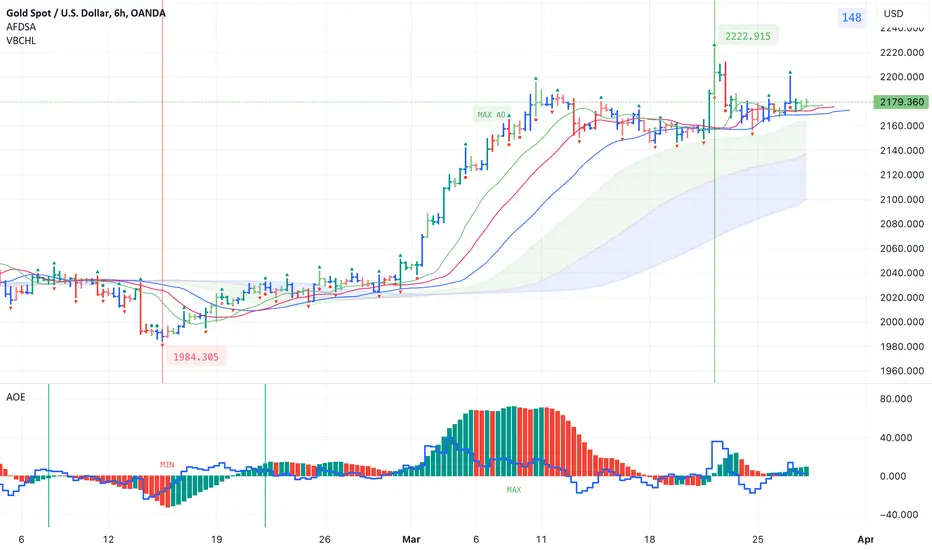
Indicators for trading using Bill Williams' Profitunity strategyI published 3 indicators for trading using Bill Williams' Profitunity strategy. For each indicator, I have added a visual and detailed description in English and Russian. In this post I will briefly describe these indicators and how I use them together.
AFDSA indicator (Alligator + Fractals + Divergent & Squat Bars + Signal Alerts)
Includes Williams Alligator, Williams Fractals, Divergent Bars, Market Facilitation Index, Highest and Lowest Bars, maximum or minimum peak of the Awesome Oscillator, and signal alerts based on Bill Williams' Profitunity strategy:
Bullish and Bearish Divergent Bar Signal + Squat Bar + Green Bar + Fake Bar + Awesome Oscillator Color Change + AO Divergence.
Crossing the green line (Lips) of an open Alligator.
Formation of a fractal.
Signal about the breakdown of the last upper or lower fractal.
Signal about the appearance of a new maximum or minimum peak of AO in the interval of 140 bars from the last bar.
I also added an Alligator display for the higher timeframe, for example, if the chart timeframe is 1 hour, then the higher timeframe will automatically be 4 hours, if the chart timeframe is 4 hours, then the higher timeframe will be 1 day, etc.
AOE Oscillator (Awesome Oscillator + Bars count lines + EMA Line)
Includes the Awesome Oscillator with two vertical lines at a distance of 100 and 140 bars from the last bar to determine the third Elliott wave by the maximum peak of AO in the interval from 100 to 140 bars according to Bill Williams' Profitunity strategy. Additionally, a faster EMA line is displayed.
I also added display of the AO line for the lower timeframe instead of the EMA line if the Moving Average Line values (method, length and source) are equal to the Awesome Oscillator values in the indicator settings. For example, if the chart timeframe is 1 day, then the lower timeframe will automatically be 4 hours, if the chart timeframe is 4 hours, then the lower timeframe will be 1 hour, etc.
VBCHL indicator (Visible bars count on chart + highest/lowest bars, max/min AO)
The indicator displays the number of visible bars on the screen, including the prices of the highest and lowest bars, the maximum or minimum value of the Awesome Oscillator. The values change dynamically when scrolling or changing the scale of the chart, but with a delay of several seconds, so this feature is included in a separate indicator so as not to slow down the work of other indicators.
Indicator settings
In the AFDSA indicator I use the following settings:
By default, the Squat Bar is colored blue, and all other bars are colored to match the Awesome Oscillator color, except for the Fake bars, which are colored with a lighter AO color. But I also enable the display of "Green" Divergent bars in the "Green Bars > Show" field.
I enable the display of Alligator for higher timeframes in the "Alligator for higher timeframe > Enable" field.
In the indicator style settings, I disable the display of the highest and lowest bars, maximum and minimum AO peak labels, because these labels are also displayed by the VBCHL indicator depending on the number of visible bars in the chart window.
Only after opening a position, I enable all additional alerts in the “Enable all additional alerts” field (after changing this field, you need to re-create the alert for the current chart): crossing the green line of an open Alligator, formation of a fractal, appearance of a new maximum or minimum AO peak.
In the settings of the AOE oscillator, I enable the display of the AO line for the lower timeframe instead of the EMA line, setting the same values in the fields for the Moving Average Line (method, length and source) and Awesome Oscillator.
In the VBCHL indicator settings, I only enable the simple display text style for labels in the "Simple display text style for labels" field.
As a result, when analyzing the current chart, I immediately see all the signals on the chart, the location of the bars relative to the Alligator on the higher timeframe and changes in the Awesome Oscillator on the lower timeframe. And thanks to the VBCHL indicator, I quickly select the desired timeframe for analyzing the 5-wave Elliott impulse, focusing on the interval of 140 bars, and immediately see whether there is divergence between the maximum AO peak and the following lower AO peak in this interval.
The Different Entry Order TypesTake your Trading Skills to the Next Level: Understanding Entry Order Types 💪
When it comes to trading, mastering the art of order execution is essential for success. Let's dive into the different entry order types that can help you optimize your trading strategy and make more informed decisions:
𝐋𝐢𝐦𝐢𝐭 Order: A limit order is your ticket to precision. With this order, you specify the exact price at which you want to buy or sell an asset. It's perfect for setting target entry or exit points and ensures you don't miss out on opportunities. Limit orders give you control and prevent you from overpaying or underselling.
𝐌𝐚𝐫𝐤𝐞𝐭 Order: Market moves fast, and sometimes you need to act quickly. A market order is your go-to choice for immediate execution. It buys or sells an asset at the current market price, ensuring your order is filled promptly. Market orders are handy when you want to enter or exit a position quickly, but keep in mind that the execution price may vary slightly from what you see on the screen.
𝐒𝐭𝐨𝐩 Order: Risk management is paramount in trading. Enter the stop order, a tool used to limit losses or protect profits. It lets you set a predefined price at which your order will trigger, helping you maintain discipline in volatile markets. Stop orders are your safety net, ensuring you don't let emotions dictate your trading decisions. Whether you're cutting losses or securing gains, stop orders are your trusty companion.
Each entry order type serves a specific purpose in your trading arsenal, and understanding when and how to use them can make a significant difference in your trading success. Here's a quick breakdown of scenarios:
🔸Limit orders are great for entering trades at your desired price levels or taking profits when prices reach your targets.
🔸Market orders are ideal for getting in or out of trades swiftly when time is of the essence.
🔸Stop orders are essential for managing risk, preventing significant losses, and securing gains in volatile markets.
Keep honing your trading skills, and don't hesitate to explore these different entry order types to elevate your trading game. By using these tools effectively, you can navigate the financial markets with confidence and strategy.
Remember, successful trading requires continuous learning and adaptation to market conditions. Stay informed, stay disciplined, and keep your trading journey on the right track.
Thanks for Your attention, sincerely yours, Kateryna🫶

Price-Action-Channel-Formation: Key Projection-Types!Hello Traders Investors And Community,
Welcome to this tutorial about Price-Action-Channel-Formation. In markets, there are often price-actions forming that move into channel-formations which can shape into different forms. In this tutorial, I am looking at important channel structure types and how the projections can be assigned to properly object a taget-zone in the various types. As it is most often the case such formations can show up with a great potential signal to enter when they rightly complete and the final confirmation shows up, therefore it is important to keep patient on these confirmations and do not hesitate to enter into the market when no solid setup and opportunity is given.
Range-Breakout-Projection:
- Such ranges form quite often in the market and they can develop on smaller timeframes such as the 1-hour timeframe or higher timeframes such as the daily timeframe always with the proper time perspective given with the certain range. The pattern starts with a downtrend or in the reverse with an uptrend marking a new low or high which is the support/resistance in the range then the price bounces back to form the counterpart high or low which then creates the counterpart support/resistance in the structure. After a period of consolidation, the price finally breaks out of the range above the support/resistance level and closes there. When the final breakout emerges there are two possible target-projections, firstly the range height from the support to the resistance that is projected from the breakout point and secondly the width from the initial range entry to the breakout which is projected from the low to the upside, both projection can have different targets that can be assigned as target one and target two.
Tripple-Channel-Target-Projection:
- This is a very interesting channel-formation that is forming in the markets. Firstly the uptrend channel develops as seen in my chart(this can also happen in the bearish direction), within this channel a new high marks in the structure before the price-action actually reverses and breaks out below the lower boundary of this main ascending channel. The first breakout below the lower boundary of the channel activates a target with the projection to the downside and after that it is not seldom seen that the price-action moves back into the lower boundary and tests again as seen in my chart, in this case two further channels can be drawn, the second channel in the structure which is projected from the high to the structure lows and highs to the downside and the third channel projected from the new downtrend low to the new downtrend high, when the price-action now moves into the lower boundary of the main channel again this is a tripple-resistance-pullback as seen in my chart and the price-action moves on to the targets by the breakout and when the price-action then moves below the second channel the next target is activated.
Classical-Descending-Channel-Projection:
- This is the most classical channel in the market, it can form as a descending channel marking a potential bullish reversal as well as an ascending channel marking a potential bearish reversal. In both types, the channel is formed by the trend lows and highs which are ranging in the channel and as the downtrend (or in the reverse the uptrend) moves on the market gets oversold and the possibility for a reversal gets higher as the market has not the ability to continue this way for every. Such a formation also often inhabits a elliot ABCDE-wave-count which can offer additional confirmation for a breakout. This final breakout emerges when the asset gets that much oversold that demand enters and a breakout above the upper boundary settles as it is shown in my chart. When this breakout shows up the channel heights from the up to the downside is projected to the final breakout to the upside and the price-action is ready to appoint these zones.
Range-Triangle-Channel-Projection:
- This is a pattern that combines two formations, firstly an ascending channel and secondly an ascending triangle which is forming within the channel. Firstly the ascending-channel establishes with higher highs and higher lows and within this channel, the price-action makes something interesting as it does not move on further in the structure and stops making new highs it pulls back and forms a horizontal line of highs in the structure which then develops into this ascending-triangle seen in my chart in orange. Such an ascending triangle has the ability to form a dedicated breakout to the upside when the price-action moved on to range in the triangle and possibly also completes the wave-count within. When the price-action finally breaks out above the upper boundary of the triangle this will activate the further developments and targets at the upside especially amazing is the double projection here which projects the triangle height to the upside and is also at the same time the target at the upper boundary of the ascending-channel which can approve the target not only in price but also in time.
Bull-Flag-Channel-Breakout-Projection:
- This type of formation projection can show up with a very good solid signal however there are some very important determinations that need to confirm rightly before assessing the formation in the right manner. When the bull flag does not complete properly and the price-action increases bearishly or also bullishly when it is a bear-flag such a flag-formation can also invalidate with the breakout into the reverse direction which can often lead to heavy volatilities into the other direction as traders get trapped. Nevertheless when the formation completes rightly which will happen with the final breakout above the upper or lower boundary the target projection is made from the previous low in the wave to the upside to the high which is then projected from the lowest price-action point in the flag to the upside, always possible with the counterpart formation into the other direction.
Double-Channel-Triangle-Breakout-Projection:
- Now comes a very amazing formation as there are some interesting points given in this formation that can lead to a very strong breakout signal and the activation of the targets ahead. This formation basically consists of an initial channel to the downside in which the price-action ranges and after that can fall below the lower boundary and continue bearishly to reach the target, this initial price-action in the descending channel does not necessarily need to show up. After that when the price-action reached the targets the price backs up and continues to the upside to finally move into the previous descending-channel again in which it continues to consolidate and now also forms a bunch of lower lows that mark an ascending-trend-line in this channel, both the first descending-channel and now the second ascending-channel form a symmetrical triangle formation which is more likely to break out into the direction it came from which in this case is the bullish direction, this can also be measured into the reverse direction. The breakout then strongly activates an upside target which is the price-projection of the triangle to the upside and also the upper-boundary of the channel-formation that can also show the target in time.
In this manner, thank you for watching my analysis about these important price-action-channel-formation types that can be spotted in today's market, will be great when you support it with a like and follow or comment, great contentment for everybody supporting, all the best!
Information is only educational and should not be used to take action in the market.

Candlestick-Formations: How To Spot The Patterns Like A Pro!Hello,
Welcome to this tutorial about Candlesticks and in particular the very various candlestick patterns that form in the financial markets. The charting technique under which Candlesticks operate are candlestick charts and the candlesticks firstly came up in the 18th century, till today they established as a widespread technique that many traders use for their charting. What is so amazing with these candlesticks compared to a line or point-and-figure charting is that they can determine very precisely if a market is trending, if a reversal is establishing or the momentum of price-action is slowing down. The various single candlesticks can add up to decisive candlestick-patterns that can be used for trading and trading decisions, especially with other indicators such as oscillators or channeling they can be a strong tool for today's trading principally also in modern markets where there is decent liquidity and not many gaps such as Cryptocurrency or Forex.
__
Characteristics:
- In my chart, I have listed 34 contrasting cryptocurrency patterns that can be spotted in the markets. On the left side, there are 16 bearish candlestick patterns and on the right side, there are 16 bullish candlestick patterns together with the 2 candlestick patterns in the middle which have the same name regardless of direction.
- From the 17 patterns for each side are 15 possible in both directions bullish as well as bearish while there are only 2 patterns in each direction that only form in this bearish or bullish direction.
- The patterns can be divided into continuation patterns and reversal patterns. Continuation patterns can be used to make sure the established trend moves on and reversal patterns can be used to spot actual reversals to properly prepare on it.
- The patterns are functioning in the underlying timeframes similarly with the trend established in this timeframe however from a broader perspective the bigger the timeframe in which the particular pattern forms the more consistent and strong this direction is for the bigger trend. So when for example a reversal pattern forms on the weekly timeframe it is stronger than patterns forming on the daily timeframe.
__
Candlestick-Patterns:
Bearish/Bullish 3 Continuations:
- A very typical continuation pattern. The first big candle sets the tone for the pattern following up with 3 minor little candlesticks with no strength in the reverse direction till a further major candlestick emerges pushing the price toward the established direction.
Bearish/Bullish Harami:
- This is a good example of a reversal pattern. The first candlestick is a candle against the trend direction followed up by a new candle in the trend direction showing still possible continuation till a final smaller candlestick with a smaller body than the previous one sets the tone for the reversal.
Bearish/Bullish Harami Cross:
- A great continuation pattern. As the first candle is a big candle setting the pattern up with strength a little cross following up with the same close and open which is showing a consolidation in this range to build up and continue with the further volatility into the established direction.
Dark Cloud Cover/Piercing Line:
- A very very strong reversal pattern. While the two trend candles still suggest that the previous trend is ongoing the next third candle is very weak as it is small and does not rally the full length of the previous candle and shows up win the ends of the previous candle signaling high weakness of the bulls or bears and setting up the determined reversal.
Engulfing Bearish Line/Engulfing Bullish Line:
- The next substantial reversal pattern. It happens in a developed up or downtrend with the last candles low forming a line, the body of the next candle is bigger than the previous however it's close or open exactly forms there where the previous candle had its low, when the next individual candles moving to continue in this reverse direction then the pattern fully confirms.
Evening Doji Start/Morning Doji Star:
- This is a very interesting reversal pattern. As one normal candle into the trend directions sets up the pattern one continued weak start Doji is formed above the top or bottom of the previous body showing exhaustion and momentum slowing down, when the next candle moves into the reverse direction the pattern and continuation are validated.
Evening Star/Morning Star:
- A great reversal pattern. The first candles close or open set up a line where the next close or open travels outside the line with the candle showing a weak breakout while the next line into the reverse direction confirms the reversal and the formation to set up further volatilities into the reverse continuation-zone.
Gravestone Doji/Dragonfly Doji:
- These candles signal the initial exhaustion of the trend with a candlestick with a long shadow and the smallest possible body with the same open and close, they can be reversal as well as continuation patterns. Either the body is in the upper range or the lower range of the shadow, this is which direction the next movements will likely go.
Separating Line Bearish/Separating Line Bullish:
- This is a strong continuation pattern. As the first candle's body with the open or close sets up a line the next candle's close or long is below or above the line which means a weakness of this next candle regardless of the direction and estimates the further continuations into the trend direction.
Evening Window Star/Morning Window Start:
- This is a good example of a reversal pattern including a gap in the structure. As the first candle moves into the established direction there comes a gap before the next candle emerges which closes outside the body of the previous candle above or below, after that following candles into the new direction validate the final reversal of the previous trend.
3 Bullish Soldiers/3 Bearish Soldiers:
- This is a very typical reversal pattern as the established trend exhausts with three small candles the momentum of this trend gets smaller and when the next candles follow up with a much bigger body into the other direction the pattern is completed and will determine the bearish or bullish continuations into the reversal direction.
Inverted Hammer:
- This is a reversal pattern that stops the previous trend and moves in the other direction. It has a high similarity with the hammer however in this case the small bodies close or open is at the same price as the low of the candle showing the exhaustion of the previous trend direction and builds the setup for the full reversal.
On-Neck Line:
- This is a pattern that shows the incoming bullish reversal of a previously established bearish trend as one first bullish candle signals the possible reversal it is followed by a bearish one still pushing downward and forming a new low till a snap-back move on finally confirming the reversal.
Shooting Star/Inverted Hammer:
- This is a pattern that determines a strong reversal as the first candles open or close forms a line, the following candles move above or below this line and then close or open is exactly on this line just outside after that the next big candle forms into the reverse direction again below or above this line and the final reversal is formed.
Long Upper Shadow/Long Lower Shadow:
- This pattern can move in the bearish or bullish direction showing up a reversal, as the price-action is exhausted in the particular direction a long shadow builds up while the body of the candlestick is very small in the previous direction weakens further and the reversal is easily established.
Tweezer Tops/Tweezer Bottoms:
- This reversal pattern can come in two variants in both it is important on where the close of the new candle lies to the previous candle or in reverse the open to the new candle, similarly with the low or high of the new candle. When these are at the same price action the reversal is determined into the new direction.
Hanging Man/Hammer:
- This pattern signals a determined reversal and in comparison to the long upper shadow/long lower shadow fills out the complete end of the shadow with the close or open at the same price level as the high.
Tri-Star:
- The Tri-Star is a pattern that shows a reversal with three candles each one with very small shadows as well as a same-close-and-same-open body, in the bearish reversal two bullish candles are followed by a third bearish and in the bullish reversal, the reciprocal determinations hold true.
Spinning Top:
- This pattern is an amazing reversal pattern with a very large shadow and the body exactly in the middle. Depending on whether the candlestick is green or red this will be the direction in which the further continuations move.
__
As we can see now there are a lot of great patterns to be formed in modern markets and when done right they can be spotted and can provide the proper informational inputs for trading planning especially in combination with other technical analysis tools they can function exceptionally well and building a solid alternative for the other charting techniques, the success story tells itself as they have established well in the trading world. In trading these types of candlestick patterns it is necessary to recognize in which timeframe they form, as bigger timeframes can invalidate lower and in which trending constellation they are forming, therefore it is also good to look at previous candles and their patterns in the individual asset.
__
In this manner, thank you everybody for watching, support the idea with a like and follow or comment, have a good day, and all the best to you!
Information provided is only educational and should not be used to take action in the markets.
__

👻The Movers and Shakers: Meet the Big Forex Players👻
🍀The forex market is a dynamic and complex marketplace, with billions of dollars changing hands every day. At the center of this volatile financial landscape are a handful of key players who wield immense power and influence over the direction of global currencies. In this article, we'll introduce you to some of the biggest and most influential forex market players.
🌸The Central Banks: "We set the tone for the entire forex market."
Perhaps the most important forex market players are the world's central banks. These powerful institutions have the ability to control the supply and demand of their respective currencies, through interest rate policies and other monetary maneuvers. Whenever a central bank makes a move, traders around the world sit up and take notice.
🌺The Big Banks: "We are the gatekeepers of the forex market."
Big banks are another major group of forex market players, and they play a critical role in providing liquidity to the market itself. These institutions act as intermediaries, buying and selling currencies on behalf of their clients and helping to facilitate trades between different market players.
🌼Hedge Funds and Trading Firms: "We thrive on volatility and uncertainty."
Hedge funds and trading firms are a relatively new entrant to the forex market, but they have quickly become some of the most important players. These firms are often staffed by experienced traders and analysts who use complex algorithms and trading strategies to capitalize on short-term market movements.
🌹In conclusion, the forex market is a complex and ever-evolving landscape, but understanding the key players involved can help investors and traders make more informed decisions. Whether you're following the moves of central banks, working with big banks, or leveraging the insights of hedge funds and trading firms, the forex market is full of opportunities for those who are willing to take the risk.
Please cheer me up with a like and a nice comment😸❤️
Please, support my work with like and comment!
Love you, my dear followers!👩💻🌸

Trading Mindset: The Winning Edge!In the world of trading, strategy, and market knowledge are typically seen as the twin pillars of success. However, this is only part of the picture. The psychological aspect of trading is often overlooked but can be equally, if not more, influential in shaping trading outcomes. This component involves understanding and managing the emotions, biases, and mental states that can impact trading decisions. Emotional decision-making can lead to costly mistakes, such as panic selling during market dips or holding onto a losing trade for too long out of hope or fear. Therefore, it is crucial to cultivate a clear, disciplined mindset for more profitable and consistent trading outcomes. This tutorial will delve into the psychological landscape of trading, providing valuable insights and practical tips to master your mind and, consequently, the market.
Common Psychological Traps in Trading
There are several psychological traps that traders can fall into, which can seriously undermine their trading performance. One of these traps is overconfidence. After a streak of successful trades, it's easy to start feeling invincible, which can lead to riskier trading behaviors and impulsive decisions.
Fear and greed are two more emotions that often dictate trading decisions. They are the key drivers behind market trends and can lead to significant financial losses if not managed properly. The fear of missing out (FOMO) can push traders into hasty, poorly thought-out trades, while greed can create a reluctance to sell even when all signs point to a market downturn.
Another common psychological pitfall is anchoring. This occurs when a trader becomes fixated on specific price points or values, which can distort their perception of a security's true value and hinder rational decision-making.
Understanding Your Trading Emotions
To manage your trading emotions effectively, you first need to understand them. One practical way to do this is by keeping a trading journal. Besides recording your trades and their outcomes, this journal should also note down your emotions and thoughts at the time of each trade. Over time, you may start to see patterns in how your emotions affect your trading decisions.
Knowing your risk tolerance is another crucial factor. Each trader has a different level of comfort when it comes to taking risks, and understanding this can significantly shape your trading strategy. A risk-averse trader might prefer more stable assets, while a risk-tolerant one might be comfortable with higher volatility.
Strategies for Managing Trading Emotions
Being in the right mental state before you start trading is paramount. Developing a pre-trade routine that helps you calm down and focus can prepare you for the trading day ahead. This routine could include activities like meditating, exercising, or going over the latest market news and your trading plan for the day.
Having a clear trading plan can also provide a solid foundation for managing your emotions. This plan should outline your strategy, including risk management tactics, potential entry and exit points, and your objectives for each trade. It serves as a roadmap and can keep you grounded when market volatility triggers emotional responses.
In addition, learning stress management techniques can be invaluable in trading, a field often fraught with stress. Taking regular breaks, deep breathing exercises, and ensuring you have a balanced lifestyle outside of trading can help maintain your mental equilibrium.
Conclusion and Further Reading
Trading psychology is a vast and complex field, but understanding its fundamental principles can drastically improve your trading performance. By being aware of the common psychological traps, understanding your own emotions and risk tolerance, and employing effective strategies to manage your trading emotions, you can make more informed and profitable trading decisions.
Continuous learning and emotional self-awareness are keys to successful trading. There are numerous resources available for those who want to delve deeper into trading psychology, risk management, and market analysis. While the journey to master your trading psychology can be challenging, the potential rewards - improved trading outcomes and personal growth - are well worth the effort.

A Comprehensive Guide to Picking Winning StocksHello,
Investing in the stock market can be a profitable endeavour if approached with the right strategies. Picking winning stocks requires a thorough analysis of various factors, including understanding the company, assessing the market environment, evaluating opportunities and threats, identifying company weaknesses, and setting realistic targets. Today we aim to provide a step-by-step guide on how to effectively select stocks that have the potential to generate favorable returns.
Understand what the company does:
Before investing in a stock, it is crucial to have a clear understanding of the company's business model, products or services, and its competitive advantages. Analysing financial statements, annual reports, and researching the company's history and industry can provide insights into its operations, revenue streams, and potential for growth.
Look at its stock price trend:
Evaluating the stock price trend is essential to identify patterns and potential entry or exit points. Technical analysis tools such as moving averages, support and resistance levels, and chart patterns can assist in identifying trends, price reversals, and market sentiment. Combining technical analysis with fundamental analysis provides a more comprehensive view of the stock's potential.
Understand the market environment:
Assessing the overall market environment is crucial as it can significantly impact stock performance. Factors such as economic indicators, industry trends, interest rates, and geopolitical events should be considered. A bull market generally favors overall stock performance, while a bear market presents more challenges. It is important to align investment decisions with the prevailing market conditions.
Understand the opportunities ahead:
Identifying potential growth opportunities is vital to selecting winning stocks. Researching industry trends, technological advancements, new product launches, or expansion plans can provide insights into a company's growth prospects. Additionally, evaluating the company's competitive positioning and its ability to capitalize on emerging opportunities can help assess its long-term potential.
Understand the threats:
Identifying potential threats or risks is equally important in picking winning stocks. This involves analyzing factors such as competitive landscape, regulatory changes, disruptive technologies, and potential challenges the company may face. Evaluating a company's risk management strategies and its ability to adapt to changing market conditions is crucial in assessing its resilience.
Discover company weaknesses:
Conducting a thorough analysis of a company's financials, including its balance sheet, income statement, and cash flow statement, can reveal weaknesses and areas of concern. High debt levels, declining revenues, or low-profit margins may indicate underlying issues. Additionally, analyzing key performance indicators, management quality, and corporate governance can provide valuable insights into a company's overall health.
Set the target for the company stock:
Setting a realistic target price for the company's stock helps determine its investment potential. This involves evaluating the company's historical valuation metrics, such as price-to-earnings (P/E) ratio, price-to-sales (P/S) ratio, and price-to-book (P/B) ratio, in comparison to its industry peers. Consider both short-term and long-term factors, such as earnings growth projections and market sentiment, while setting a target price.
Decide whether it is a good company to buy or not:
After evaluating all the above factors, it is essential to make an informed decision on whether to buy the stock. Consider the company's fundamental strengths, growth prospects, competitive advantages, and valuation metrics. It is advisable to diversify the investment portfolio and not rely solely on one stock. Consulting with a financial advisor or conducting further research can provide additional perspectives before making a final investment decision.
I wish you the best in your investment journey!
Info about the company PDD Holdings can be interrogated here investor.pddholdings.com

Basic Understanding of Market StructureWelcome to the Game Of Resilience .. Structure is the King structure tells everything that you can go for buy or sell trades . sometimes structure will confuse you too so understanding the structure is some what tricky point all over the internet because everyone have a different perspective so coming to the point just this post is to understand the basics of what is market structure and what strong highs and low .

Wave Auction Theory & WHY it worksSup, this is the 30th & the last post that concludes all the previous ones, and finally reveals the name how I've called all this - wave auction theory. Well, me as a creator of all this (or more like a mixer, a DJ lol) I think about it more as a theorem, but that's for nerds and geeks to work it out, me I just wanna flexx.
If you take a look at all existing market theories their main thing is they all attempt to divide market activity into parts. Patterns, El waves, Wyckoff market states, then what Steidlmayer created (I call it Interval Auction Theory, since he divided market activity in parts by days, weeks, months etc). The main problem with is all these concepts (maybe except the last one) dem are not well defined, and they apply on the fractal market something that the highest resolution of this fractal (raw tick chart) doesn't have.
Wave auction theory ain't superimposing any exogenous structures on the market, such as "crowd behaviors", nah, it doesn't guess and predicts anything, it derives the principles and structures from the sequences of fundamental particles of the market - ticks, and it can be used fully on this fundamental resolution. This is the most fundamental principle how you can divide market activity without any subjectivity: waves and levels. Btw, indirectly, we also gain the interval size information by choosing the right resolutions, while interval auction theory disregards sequence of events (read my post about market & volume profiles).
Why it all works
It's a lil bit recursive kind of thing, you need to read all the statements below multiple times in different order, then your brain will start making the whole picture out of it, and finally things will come together, you'll feel that "snap" in your head. It's the best I can do.
* Market is fractal => all the principles propagate through all the resolutions;
* Market is a feedback loop, market is ALL of us together, that famous "composite operator" that Wyckoff tried to explain to people around him, that composite operator is All of us - the collective;
* Each individual entity in the collective has different voting power = better you operate = better the market = more revenues & capital you have = more voting power you have;
* We all have all the same data => we can gain as much information as there is in the data;
* Data on every resolution has information where it is, it was, or it will be cheap or expensive, every1 gains it with different degree of precision, but essentially every1 gains the same info because it's the same market & same data;
* The only thing that works all the time in all the cases is being an operator (a market maker) aka you buy cheap and sell expensive;
* Market making happens on all the resolutions, be it 1 minute or 1 week chart, on the former it might be one dude with 100 shares, on 1W it might be 100k dudes with 100 shares, the collective is always there, even on yearly charts;
* More data & information you have, the more question of "what's going to happen in the future" transforms into the question of "what IS happening NOW";
* market works on the principle I call "GTC Naive" (good till cancel Naive forecast), meaning that "the stuff's gonna continue the same way UNTIL there's an event/evidence that'll change it";
We all make the future, how can we not know what we're making ourselves if we have the info and exogenous factors are not numerous and secondary at best, and the system itself is quazi-closed? Still gonna try to analyze log returns? xD
Everything is already decided, we've decided all of that ourselves having the same data & same info xdddd
All the prophecies are self fulfilling prophecies by definition lmao, they are consequences of sequences of choices made by every1 through all the timeline. While loosing precision we gain generality => are able to understand what IS happening NOW. Not even contra intuitive aye?
The good side point of all this is that now you can rewatch Matrix movies (all of dem) and finally understand the dialogs between Neo and The Oracle (the parts her telling him the choice is already made).
Coming back to the theme, I share all this because I think that markets are sadly unhealthy, there's ENORMOUS room for liquidity provision for centuries to come on Ks of assets. Better we gonna operate, more clients = more volume will come to the markets => better for all of us.
The last several things I wanna share:
1) You can approach designing an automated agent (a bot) by following principle, smth I call "sMATEs framework";
- s: selection of assets that will end up in your masterlist;
- M: management - choosing between the most potent timeframes & assets within the assets in masterlist;
- A: analytics, seeing what's happening on your chosen data, choosing the signal generation method aka strategy accordingly;
- T: trading, generation the actual signals based on the strategy chosen before;
- E: execution, processing & fine tuning the actual executions based on the signals;
-s: sizing: choosing the quantities based on equity control and what the market can give.
The two small Ss are the only levels where you need to use ML. Reinforced learning for sizing based on order book & equity chart of a given agent. Then you can use ML & AI to form the masterlist, based on what you want. Generally you're interested in action or as I say in MEAT (ain't no vegan bruh sorry).
2) Each market has its own main cycle set: set of properly chosen optimal resolutions & time frames & rolling window lengths (no, there's nothing to optimize there & no need in dynamic lengths). I think you can figure it out reading all the posts & studies I've posted lately.
I can give a hint: if you want to divide smth, you always try to divide it by 5 first. If you can't by 5, then by 4. If you can't by 4, then by 6. If you can't by 6, then by 3. If you even can't by 3, then by 7. And omg if you can't by 7, then in theory it's by 2, but not on our planet with our modern time system. Look at the 2 centuries of S&P chart in this post and see what I see.
3) If you a coward, or an overconfident prick, or a cheater, or a lier, or a snitch, you wont't succeed. You'll succeed if you're real & legit, in this case it's only a matter of time.
From there it seems like my path goes somewhere else, but this is the way, all good TV, was fun.
Remember, there's no noise, only the truth

Q&As: non-market dataThere's some curious personalities that trade (at least claim to trade) based on news, fundamental metrics, alt data n stuff. I don't mean invest, I mean trade. Well that looks like a skill to be proud off, superstimuli always feels cool aye? Good thing tho there no real reason in doing it all.
The most precise term to explain non-market data is, well, everything that ain't have a direct involvement with what happens inside the order matching servers of a given exchange.
So open interest is in fact a great example of non-market data.
The one & only real purpose for using all this data is to know (not to guess/predict/forecast, not to even anticipate), but to understand when the ACTION is going to happen. If you think deeper, ultimately it's all about asset selection to satisfy whatever purpose you got. if you ever got caught yourself feeling fooled when media release a bad info but prices go up, or media release a good info but prices go down, it's ok. It doesn't work that way, direction of prices can't be affected this way. Direction of prices is the result of how buyers meet sellers which is based on +inf number of factors, where a non-market data is simply just one of these +inf factors. It exclusively provokes action, meat, hype, momentum, volatility, whatever you call it. What's happening is that things start to happen very fast. Without a trigger event, the trading activity would've been the same, it just would've take longer to unwind. News don't change the structure, they make it all happen faster, that's it.
Examples of non-market data that can be used to expect action:
1) Trading schedule, eg the US, EU opening times;
2) Economic releases;
3) Commitment of traders reports;
4) Significant news;
5) Changes in yield curves;
6) "Fundamental" stock data;
7) Open interest;
8) etc etc etc
One really important thing to add is that, just like trading activity is understood in context (other resolutions), sizing also includes context (equity control, market impact), the same way every non-market data event lives in the context (previous releases, other releases, overall economy). You're interesting not in a new per se, but rather in what does it mean in the world. For example, inflation reports don't mean much when the rates are low, but when the rates are high, they trigger significant activity.
That's the area where statistical learning, automated learning, "machine" learning, 'Really' starts to make sense business-wise. The ultimate goal is to create a system that will process every kind of data you have (NLP and TDA should help) and output the tickers with raising/already risen levels of interest.

Flawed concepts: the way they sell volume & market profilesImagine daily profiles put on each day on the chart, and let the words in purple provoke some fruitful doubts in your mind.
The presented and advertised way of using volume & market profiles is essentially a way of approximating the real levels. This way is very bad.
1) The most fundamental and very obvious flaw is that it disregards the sequence of events. You can take a chart, reshuffle bars in order, or lol, just invert it horizontally. and you'll end up with different charts that have the same profile. All good bro? It's time series lol, sequence does matter. That's why you can't use profiles and non-weighted stats unless you have a very specific goal;
2) 70% rule, normal distributions & standard deviations have nothing to do with aggregated tick data. As a process, it can all can be modeled as a morphing distribution, a constant fight between normal and uniform distributions, the double auction dynamic distribution. But yeah, ofc course you can't read it in a book, gotta think for yourself a lil aye? In normal distribution 70% make sense, in the uniform one it makes sense to consider 100% (the whole distribution) as the area of interest. So overall it's somewhere in between 70 and 100. Also, confirmed with my R&D, bots give the best performance when a price channel includes 80-90% of data (mostly 80), best metrics converge around this number;
The real way to use profiles is when you consciously need to disregard an order of events within a certain period and have some kind of summary of it. It's applicable when a certain period has some distinguishable significance: when levels are formed, positioned and cleared. There, you are not really interested in order of things within these events, rather in summaries of these events, there you're doing the right thing. Otherwise, POCs of 'every' period doesn't have equal significance. Summarizing volumes within a week/day/months etc, making a profile & taking 70% so you gonna get VAHs and VALs of it won't magically calculate you the real levels, only approximate em, but 4 real there are better and less computationally intensive ways of doing it, just get a box plot with 10th and 90th percentiles.
This video might be really mind opening for you, I really respect it & its creator.
If you wanna know how to find levels 4 real, check the linked ideas & use it with pleasure.
