How to Choose the Right Indicator?Many traders, especially when starting out find themselves in a constant search of the best trading strategy.
A quick Google search is enough to scare anyone starting out, as the number of indicators and strategies to use under different market conditions is overwhelming.
🗒In this article, we will discuss *1* indicators nature and the correct way to use it, *2* how to choose the right indicator, and most importantly *3* how to know if the indicator is reliable or not.
---------------------------------------------------------------------------------------------------------------------
📌 First, what are indicators? Origin and Nature
Indicators are statistical tools that digest price data, OHLC of each candle, add a formula to it, and then convert it into visual information such as graphs or oscillators. Indicators provide information about the strength of a trend, momentum, and possible reversals.
When it comes to indicators, we can divide them into four classes: Momentum indicators, Trend indicators, Volatility indicators, Volume Indicators.
Knowing which one belongs to which category can help you make much better trading decisions. On the other hand, combining indicators in a wrong way can lead to a lot of confusion, wrong price interpretation, and, subsequently, to wrong trading decisions.
📌 The correct way to use indicators. Indicators don’t provide signals.
Most traders never look at the indicators they are using and even less have ever tried to understand the formula the indicator uses to analyze price. They then use their indicators in the wrong context and wonder why nothing works.
🗒Indicators don’t tell you when to buy or when to sell. They don’t even tell you when something is overbought or oversold.
Indicators are great tools if a trader understands their true purpose. Indicators provide information about price, how the price has moved, how candles have shaped, and how recent price action compares to historical price action. Again, not a direct signal to buy or sell.
Thus, the job of a trader is to interpret the information on their indicators in a meaningful way and turn it into a story about price action and buying/selling pressure.
Who is in control right now? Is the market ranging or trending? Is price losing strength or gaining momentum?
📌 How to choose the right indicator? That suits your trading style and personality
-----------------------------------------------------------------------------
📕 * Meaningful: Represents important information.
-----------------------------------------------------------------------------
Your indicator choice should match your trading style. The purpose of indicators/strategies is to offer a way to identify clues and to provide a framework for traders to work in. Our main job, as traders, is to collect clues and combine them in a meaningful way to have an edge over the market.
🗒 Only add indicators that help you put the odds in your favor. -- If it doesn’t, you don’t need it.
-----------------------------------------------------------------------------------------------------------
📕 * Objective: Has a clear operational definition of what is being measured.
-----------------------------------------------------------------------------------------------------------
Indicators are ideal for rule-based trading as indicators take out the guesswork by providing information that is totally objective especially for newbies who are struggling with discipline.
The most successful strategies/indicators are those where not a lot of individual interpretation is required.
🗒 Only use indicators that help you make objective decisions. -- If it doesn’t, you don’t need it.
-----------------------------------------------------------------------------------
📕 * Understandable: Easy to comprehend and interpret.
-----------------------------------------------------------------------------------
Indicators are great tools especially for amateurs who do not know how to relate price data into meaningful relationships.
Indicators' main purpose is to make your life easier, not more sophisticated.
🗒 Remember: K.I.S.S. Keep it simple stupid! -- If it is complicated, you don’t need it.
📕 Last but not least, less is more:
The problem with indicator redundancy is that when a trader picks multiple indicators that show the same information, he/she ends up giving too much weight to the information provided by the indicators.
🗒 “All Strategies / Indicators are good; if managed properly.”
~ Richard Nasr
---------------------------------------------------------------------------------------------------------------------
📌 How to know if the indicator is reliable? Cheat Sheet Checklist
📕 * Does it repaint, disappear or recalculate?
We have all been there. An indicator looking good /profitable on the chart, but perform horribly under live market conditions. Most indicators are designed to only show/keep winning signals. Do not, ever, include an indicator in your trading plan before testing it on a demo account.
🗒 Here is a simple step by step guide on how to test indicators:
- Attach your indicator to any chart.
- Keep your trading platform running for a while for the indicator to plot a couple of signals.
- Take a screenshot of the chart.
- Refresh by switching between the timeframes.
- Compare your chart with the screenshot
If the indicator’s signals /drawings change location or disappear, then it is a red flag. Such indicators are not reliable and shouldn’t be used in any way.
📕 * Does it lag?
In general, indicators are lagging, but so is price action. An indicator can only analyze what has happened already. Just as a candlestick or chart pattern only includes past price data.
Nothing to worry about so far, as we mentioned above, indicators only provide information and do not offer signals.
However, some indicators are too lagging. This kind of indicators looks good on historical data but appear too late under live market conditions.
🗒 Pro Tip: Always take into consideration when, where, and how does the signal appear.
📕 * Is it TradingView friendly?
90% of custom indicators do not work on TradingView, because PineScript does not allow recalculation. Thus, the signal/drawing can’t be modified once it is generated by the indicator.
Therefore, indicators that are available on TradingView stand out from the crowd, and they are considered more reliable.
---------------------------------------------------------------------------------------------------------------------
📌 In brief, indicators are very famous tools and used by millions of traders. However, often traders don’t really know what their indicators are doing or how to use them.
Always be aware of the objectives of your trading style and what you are trying to accomplish with the indicators. Then, adjust accordingly. Once a trader can stop using indicators as signal-tools, he will be able to transform his trading to new heights.
Happy trading!
Always follow your trading plan regarding entry, risk management, and trade management.
~Rich
Market

Understand the difference between BOS and CHoCHIn this diagram we aim to help you understand the difference between BOS and CHoCH. Pay careful attention to the annotations made on the chart.
Happy Trading
Team Lamda

🟨 TV Crypto Market Caps - TICKERSThese are quite useful to follow.
We have 4 major ways to track Crypto Market Caps
$TOTAL = Crypto Market Cap
$TOTAL2 = Crypto Market Cap - BTC
$TOTLA3 = Crypto Market Cap - BTC - ETH
$TOTALDEFI = Crypto Market Cap for DeFi
Clearly all are below the purple line (200D SMA) and clearly in Stage 4 downtrend (as per Stage Analysis criteria).
This mean "no-touch" for me. Actually the clear sign to get out for INVESTORS (not traders) should have been all the way back in January!

🟨 Pausing rates - Bullish tendancy?The market is a forward looking mechanism. I have discussed before that the current correction can play out like 1994 bear market. For this reason I look at this as a historical precedent.
When the market sees pause it anticipates a decline, this pushes stock prices up, at least in practice :)

🖐 5 Rules For Successful Trading!Hello TradingView Family / Fellow Traders. This is Richard, also known as theSignalyst.
Trading is simple, but not easy. Traders have difficulty succeeding simply because they are unable to follow clear rules over extended periods of time.
So what are the rules that every trader should follow?
💸 1- Only invest what you Can Afford to Lose.
Only invest money you can afford to lose, never ever borrow money or take a loan from the bank to invest. Because if you do, you will get emotional and make irrational mistakes.
⚔️ 2- 1% Risk per Trade.
We only risk a small portion of our account per trade. We enter with 1% risk per trade (2% max). We enter with a fixed risk per trade, not with a fixed stop loss in pips, nor with a fixed lot size.
Remember: All Trades Have To Have The Same Weight / Effect On Our Account!
📉 3- Three Confluences Trades. (Technical Edge)
Trading is nothing but a game probability. Moreover, we consider ourselves risk managers not only traders, as the only thing we have control over is "risk". The market can go anywhere.
To be on the winning side, we need to have an edge over the market.
One way to put the odds in our favor is by only entering trades when we have at least three confluences/clues, three things telling us to buy or sell lined-up together. One confluence may be random.
For example: Only enter when you have a pattern, support, and divergence. And your rules have to be objective following a well-defined / back-tested trading plan.
📕 4- Positive RRR - Risk Reward Ratio. (Risk Management Edge)
Our second edge is going to be through risk and money management by entering with a positive risk-reward ratio. That’s exactly why we enter with a ½ RRR (or higher), which means we always target at least double our stop loss. This way even with a 50% win rate, we are still profitable.
Remember: It is not about how many trades you win, what matters is how much you win when you are right, and how much you lose when you are wrong.
🧘♂️ 5- Emotional stability.
In the trading world, emotions are considered the enemy of traders. Knowing how to control emotions while trading can prove to be the difference between success and failure. When getting into a bad trade, the trader who can manage his psychology well will be able to minimize risk, while the trader who is emotional may make the situation worse.
Remember: You Are Getting Paid; To Wait!
Moreover, if you are not feeling well, don't trade.
Remember: You don't have to catch every trade, and you don't have to trade every week.
In fact, our 5 rules are all connected in a way or another.
If you invest money you can’t afford to lose or enter with 10% risk per trade, chances are that you will get emotional and not follow your trading plan objectively by closing your trades before reaching 2R or even entering trades that are not according to your strategy.
In parallel, even if you invest money you can afford to lose and risk 1% per trade, you won’t be consistently profitable if you don’t have a well-defined strategy that gives you an edge over the market technically or through risk management.
In brief, stay away from trading if you don’t have these 5 rules.
Always follow your trading plan regarding entry, risk management, and trade management.
Good luck!
All Strategies Are Good; If Managed Properly!
~Rich

HOW-TO [TTI] IBD Market SchoolHOW-TO instruction.
This video shows how my custom IBD Market School Indicator works for TradingView.
–––––––HISTORY & CREDITS–––––––
This indicator is based on the Market School Program from IBD and it is the core logic for which I have developed the indicator. The whole system is based on the model books for the greatest winning stocks from the past. The names of the people who have contributed to this system are William-Oneil, Mike Webster and Charles Harris.
–––––––WHAT IT CALCULATES–––––––
10 Buy Signals:
👉Follow Through Day
👉Additional Follow Through Days
👉Low above 21-Day MA
👉Trending above 21-Day MA
👉Living above 21-Day MA
👉Low above 50-Day MA
👉Accumulation Day
👉Higher High
👉Downside Reversal BuyBack
👉Distribution Day Fall Off
14 Sell Signals:
👉Follow Through Day Undercut
👉Failed Rally Attempt
👉Full Distribution minus One
👉Full Distribution
👉Break Below 21-Day MA
👉Overdue Break Below 21-Day MA
👉Trending Below 21-Day MA
👉Living Below 21-Day MA
👉Break Below 50-Day MA
👉Bad Break
👉Downside Reversal Day
👉Lower Low
👉Distribution Cluster
👉Break Below Higher High
–––––––HOW TO USE–––––––
Each buy signal is a +1 and each sell signal is -1 point to the general count.
We will add all buy and sell signals to produce an overall count from 0 to 5. Based on the count this will translate to market exposure from 0 (at count 0) to 100% (at count 5). Essentially this will help you scale in and out of the market.

2 Simple modules to pass FTMO ChallengeThese are the two types of entry modules that can be used across any market to take low risk high rewards trade. Pay close attention to annotations made. First High / Low acts as a trap for early sellers or buyers as this point is used to create liquidity for the market makers. Market makers sweeps this liquidity and mitigates extreme POI like orderblocks etc. and thus finally the banks load their short orders/long orders to break the structure.
TRUE STRUCTURE MAPPING AVAILABLE ON OUR YT CHANNEL. DO WATCH THAT VIDEO TO KNOW HOW REALLY MARKET STRUCTURE IS REALLY MAPPED AND DON'T FORGET TO LIKE AND SUBSCRIBE TO OUR CHANNEL
Happy Trading
-Team Lamda

Key to unlock the true market structure!!!Have you been struggling with marking market structure? You may have come across many Youtubers who aim to teach the market structure, but in a very wrong manner either by taking fibonacci tool or by discretion. This Video can be an eye opener for you all who are struggling in marking valid market structure.
Market structure is the backbone for every other SMC concepts. Without market structure there will be no orderblocks, breakers etc. Even if you are a beginner in market structure, that is much better since you won't be acquiring the wrong knowledge in the 1st hand.
So are you ready to uncover the real mechanical market structure?
Video will be uploaded on YT at 6:30AM GMT on 25th November 2022
Subscribe our YT channel to never miss any content from Lamda Trading.
Happy Trading!!!
-Team Lamda

2B Trading PatternIn an uptrend, if a higher high is made but fails to carry through, and then prices drop below the previous high, then the trend is apt to reverse. The converse is true for down trends. This observation applies in any of the three trends; short-term, intermediate-term, or long-term.
A 2B on a minor high or low will usually occur within one day or less of the time the high or low is made. For 2B's on intermediate highs or lows preceding a correction, the new high or low point will usually break within three to five days. At major market turning points, long-term 2B's, the new high or low will usually break within seven to ten days. In the stock market, after the new high is made, the failure to carry forward usually occurs on low to normal volume, and the confirmation of a reversal occurs on higher volume.
The above can be found on the internet, just look up 2B chart pattern.
I would usually recommend your default as being, sell low, buy lower. & buy high, sell higher.
My next trading mantra would be that double bottoms are not Support, and double tops are not Resistance. They are where the stops are. And therefore a major target.
But every now and then the market does turn. After a period of impulsive moves, the market comes to rest and goes into a consolidation. It may make one last attempt at continuing the prevailing trend, only to find there are fewer market participants willing to push it on. This is when you look for 2B's

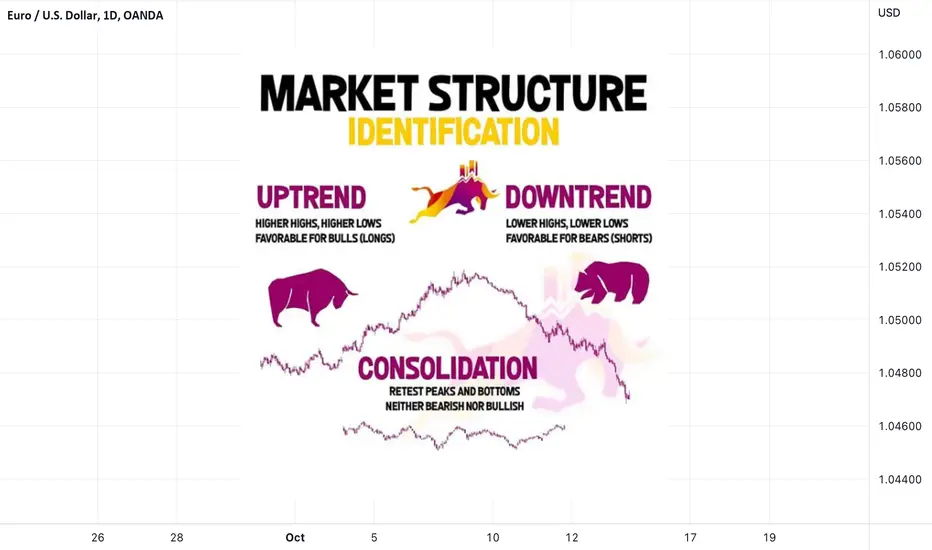
Market Structure Identification ✅Hello traders!
✅ MARKET STRUCUTURE .
Today we will talk about market structure in the financial markets, market structure is basically the understading where the institutional traders/investors are positioned are they short or long on certain financial asset, it is very important to be positioned your trading opportunities with the trend as the saying says trend is your friend follow the trend when you are taking trades that are alligned with the strucutre you have a better probability of them closing in profit.
✅ Types of Market Structure
Bearish Market Structure - institutions are positioned LONG, look only to enter long/buy trades, we are spotingt the bullish market strucutre if price is making higher highs (hh) and higher lows (hl)
Bullish Market Structure - institutions are positioned SHORT, look only to enter short/sell trades, we are spoting the bearish market strucutre when price is making lower highs (lh) and lower lows (ll)
Range Market Structure - the volumes on short/long trades are equall instiutions dont have a clear direction we are spoting this strucutre if we see price making equal highs and equal lows and is accumulating .
I hope I was clear enough so you can understand this very important trading concept, remember its not in the number its in the quality of the trades and to have a better quality try to allign every trading idea with the actual strucutre
The Psychology of The Market Cycle Explained
The market cycles can be explained from the psychology side of the average investor.
Throughout the various stages that develop in the market, the investor's emotions are also cyclical according to the "mood" of the market.
Market movements are explained by the investor when often hope and fear motivate his thoughts and actions and can predict his future actions.
Throughout the various stages that develop in the market, the investor's emotions are also cyclical according to the "mood" of the market.
The range of emotions ranges from despair to euphoria, and investors usually drive the wrong actions.
Awareness of the psychological side of the masses helps to avoid the effects of negative or positive sentiment and remain feckless on the market. In addition, we can also identify a stage or strengthen our position on the state of the market, explaining investors' feelings.
Once you understand this chart, you can control your emotions and deal without your hurt and with only your mind.
As this market cycle chart is repeating all the time, if you understand where you are located in the graph at any moment, you can take a cold decision of buy or sell a particular asset to maximize gains.

Weekend Learning: Recognizing the Market CycleOne of the biggest problems that I faced at the beginning of my trading journey was recognizing the market cycle.
I have seen people who have spent a lot of time and effort learning candlestick patterns, but know that without understanding the market cycle, even the best patterns will fail.
The graph above can help you to first find the market cycle and then look for different patterns to trade.
Every chart has only and only 1of this 4 patterns:
1.Breakout 2.Tight Channel 3.Broad Channel 4.Trading Range
1.Breakout:
Has no pullbacks or just 1 small pullback. Only buy or sell in direction of breakout.
Stop is far so risk is high, trade with smaller position size.
Better to get swings but scalp is ok.
Don't trade against the breakouts.
Example:
2. Tight Channel:
It's breakout on higher timeframe.
Most pullbacks last 1-3 bars.
Stop is wide like breakout.
Trade only with trend.
Example:
3. Broad Channels:
Trade mostly in direction of channel, other side can scalp.
Have strong opposite side legs but stays above/below prior low/high.
Buy/Sell at 2/3rd of prior leg.
Example:
4. Trading Range:
Bulls and Bears scalp.
Bulls buy low and bears sell high.
Example:
I am a price action trader and all my knowledge and the mentioned material is from Brooks Trading Course.

Market Structure Identification ✅Hello traders!
✅ MARKET STRUCUTURE .
Today we will talk about market structure in the financial markets, market structure is basically the understading where the institutional traders/investors are positioned are they short or long on certain financial asset, it is very important to be positioned your trading opportunities with the trend as the saying says trend is your friend follow the trend when you are taking trades that are alligned with the strucutre you have a better probability of them closing in profit.
✅ Types of Market Structure
Bearish Market Structure - institutions are positioned LONG, look only to enter long/buy trades, we are spotingt the bullish market strucutre if price is making higher highs (hh) and higher lows (hl)
Bullish Market Structure - institutions are positioned SHORT, look only to enter short/sell trades, we are spoting the bearish market strucutre when price is making lower highs (lh) and lower lows (ll)
Range Market Structure - the volumes on short/long trades are equall instiutions dont have a clear direction we are spoting this strucutre if we see price making equal highs and equal lows and is accumulating .
I hope I was clear enough so you can understand this very important trading concept, remember its not in the number its in the quality of the trades and to have a better quality try to allign every trading idea with the actual strucutre

MarketMaking and MarketMaker. What is it and who is it?All participants in financial exchanges can be divided into two categories - market makers, who set the mood in the market, and market makers, private investors with small capital.
Market makers ( they are in minority ) will always manipulate market makers ( they are in majority ).
What is a market maker, who he is, what he does at the exchange and why he is needed?
WHO IS A MARKET MAKER AT THE STOCK EXCHANGE?
This is a professional in the market with very large money, without whom trading is impossible - because this figure is considered a key player in the market and moves the price. Most often, this is the whole financial organization.
MARKETMAKER is the one who creates and maintains the liquidity level of exchange , currency , cryptocurrency , futures instruments , etc.
It is only possible to make transactions on the market through the market maker, who regulates the processes so that the exchange is not dominated by only sellers or buyers.
The MARKETMAKER is obliged to buy even if the market is dominated by sellers and even if it leads to losses. And when the market is dominated by buyers, the market maker must sell in order to balance the market. The main purpose of the market maker is not to make money, but to regulate supply and demand, to maintain liquidity.
CATEGORIES OF MARKETMAKERS
Large commercial banks, but not by themselves, but united in groups: they are called institutional market makers.
Brokerage companies
Dealing centers
Investment funds
Private investors with significant capital.
WHY DO WE NEED A MARKETMAKER?
It stabilizes the market, controls price movements, satisfies traders' demand. And since large financial institutions take on this role, they can be both sellers and buyers.
The market maker makes a huge number of deals every day and ensures the liquidity of assets.
The peculiarity of their work is that market makers can support the quote both in the buy and sell direction simultaneously on the same financial instrument, which makes the price move more smoothly and price gaps disappear.
TASKS OF MARKET MAKERS
Ensure profitable deals for all participants
To maintain sufficient liquidity for any instrument throughout the trading session
To accumulate orders within the instrument being traded
Find and consolidate the best price offers and record them in the price book
Provide all participants with information on current quotes as soon as possible
WHAT AND HOW DO MARKET MAKERS MAKE MONEY?
The best way to make money on the exchange is to be able to correctly predict large price movements and timely open positions in this direction.
No market maker can do it on a large scale, but a small impulse is enough to start the process of a large price movement. And for this market maker first forms a trend in the direction he needs, after which he acts in the opposite direction. Thus, the market maker makes a profit, while other participants lose more or less.
Since market makers are the first to review current orders, they are the first to find out about the emergence of a trend in one direction or another and do everything necessary to balance the market and not allow a large surge of volatility. For the fact that he keeps the market price of the instrument in the predetermined limits, the market maker receives a significant discount on the commissions. And his profit is the difference between the bid and ask prices, which is called the dealing spread.
Because the exchange is interested in maintaining the liquidity of assets, it encourages healthy competition and advocates the presence of several market makers on one floor. It reduces the cost of transactions, increases the speed of transactions and makes pricing transparent. Even the exchange rules often contain a clause that a deal is legal if a market maker is involved, i.e. it is quite a significant and influential market player.
HOW DOES THE MARKET MAKER WORK?
He establishes a connection with his clients through a program, analyzes the market and executes orders of his broker's clients. Often he prefers to work with mid-sized brokers to have the necessary volume of transactions to make money.
Marketmaking. Order-Making and Order-Making.
The function of Order-Making is to watch a particular company's stock and make predictions. Order-taking is to execute traders' orders and take additional profits.
HOW DOES PROFIT TAKING TAKE PLACE?
Like other market participants, market makers can also incur losses, which occurs if a position is chosen incorrectly. But due to the fact that market makers work with large volumes of trades and a large number of clients, they always have an opportunity to cover their losses.
Regards! R.Linda!

Market Structure Identification ✅Hello traders!
✅ MARKET STRUCUTURE .
Today we will talk about market structure in the financial markets, market structure is basically the understading where the institutional traders/investors are positioned are they short or long on certain financial asset, it is very important to be positioned your trading opportunities with the trend as the saying says trend is your friend follow the trend when you are taking trades that are alligned with the strucutre you have a better probability of them closing in profit.
✅ Types of Market Structure
Bearish Market Structure - institutions are positioned LONG, look only to enter long/buy trades, we are spotingt the bullish market strucutre if price is making higher highs (hh) and higher lows (hl)
Bullish Market Structure - institutions are positioned SHORT, look only to enter short/sell trades, we are spoting the bearish market strucutre when price is making lower highs (lh) and lower lows (ll)
Range Market Structure - the volumes on short/long trades are equall instiutions dont have a clear direction we are spoting this strucutre if we see price making equal highs and equal lows and is accumulating .
I hope I was clear enough so you can understand this very important trading concept, remember its not in the number its in the quality of the trades and to have a better quality try to allign every trading idea with the actual strucutre

How To Analyze Any Chart From Scratch - Episode 11Hello TradingView Family / Fellow Traders. This is Richard, as known as theSignalyst.
Today we are going to go over a practical example on GBPAUD, but you can apply the same logic / strategy on any instrument.
Feel free to ask questions or request any instrument for the next episode.
You can find the previous episodes below "Related Ideas"
Always follow your trading plan regarding entry, risk management, and trade management.
Good luck!
All Strategies Are Good; If Managed Properly!
~Rich

BITCOIN IS THIS BOTTOM OR JUST STARTING At the outset, I would like to inform you that I have been a big fan of the wave theory in the last five years, but in science there are no feelings and biases, as well as in markets, and also the theory has not reached the limit of idealism and some critics say that it did not reach the limits of theory, it is only a hypothesis and It has been going on for such a long time because of its many possibilities. anyway , this discussion will be as simple as possible and easy for the public to understand, even non-specialists, and from them I will present some scenarios that I see as possible to happen on the Bitcoin chart.
# The first scenario:
Have we finished the FLAT and are heading to ATH ???!!!!
I wish if the answer to this question was clear and certain , this perception takes the third place out of four, and the reason for this is the downward wave from the top of 69 to the current levels not clear five wave .
Well, according to this scenario, the end of the correction is expected at the 23k, from which we start a new bull market (remember this scenario takes the third place among the possibilities)
The second scenario:
It is a rare but possible pattern, like what happened in the Dow Jones Index in 1966, which is the expanding triangle
In the wave principle, there are four triangular patterns(Without counting the irregular top) , and the below chart shows the expanding pattern, and it may develop and change into a second type of the family of triangles. One must be careful that the triangle is one of the most difficult patterns to anticipate early, and its volatility is very high.
There may be some intellectual fanaticism on the part of some wave analyzers regarding the internal structure of waves. they assert that they be from the zigzag family, and this condition is not true
The third and fourth scenarios:
They are the most important and most likely, which is that the wave from 69 to the current price is the first corrective wave of the model and it is formed with a 3 waves structure that is very satisfactory to the rules and guidelines, anyway, the main reason for my preference for this scenario is to study time cycles (note that time cycles are more scientific and have been worked on a lot), so since we are in the A wave of the structure and this wave was 3 waves , so the possibilities will be limited to that the pattern It evolves and takes a flat or develops and takes a triangular shape and the balance tends to the triangular model due to the economic and global conditions
I know that this perception of the next movement is boring and takes the sideway character (and sorry, but your Lamborghini will be delayed this time ) and the correction may end in the first quarter of 2024, but remember the markets are not devoid of opportunities
Well, what do we gain after all this talk showing charts ??
It is very simple and here lies the strength of the wave theory, so that all the mentioned scenarios agree in the upcoming movement, which is the rise to the levels of 48-50 thousand. This wave at least gives twice the profit without using the leverage, and what do you expect to happen to the rest of the alt coins in this rally : )
I wanted to post some mysterious Fibonacci sequences for Fibonacci fans but it might take a lot of time
Anyway, a little advice from me
Life is more beautiful than the trading markets, do not be addicted to the price movement and lose the most valuable thing you have (your time) I wish luck to everyone
My greetings

How To Spot Economical Cycles Top Using [DXY- SPX and VIX]
Hi Everyone
In this video I want to share an overview of the importance of economic cycles for traders and investors and how we can use Trading View charts
with no indicators to figure out key economic signals on the following charts:
DXY tops for the end of previous bear markets
VIX normal ranges vs Bear cycles ranges
The Dow Jones Industrial average is another key chart with SPY charts because everyone has a 401K retirement account these days and people are use to the headlines of the Dow Jones Industrial Average new highs and new lows to shift emotionally between despair and exuberance. It's not unusual for people to throw in the towel just as the market begins to rise in the next economic cycle.
As a student of the markets, you need to know when it's time to load up on bargain priced assets and ride the next cycle up and when it is time to slowly sell or fade into the tops of the markets and avoid the downturns.
Are we in a normal healthy correction 10-20% or are we heading toward the Great Depression type 50% correction from the top? These charts will help you answer the question.
Mastering the market and economic cycles is the key to becoming wealthy in all asset classes - Stocks, Real Estate, and Cryptos
Hope it helps...
@Marc

Market Entry ‼️I will try to explain how do i use HTF in order with LTF.
HTF - higher time frame usually those are timeframes that are higher then H4 like D1,MN1.
LTF - lower time frame usually those are timeframes that are lower then H1 like M30,MAT,M5
When i take trades i wait for price to approach a HTF POI and then zoom out on LTF to find a better risk-reward entry like the photo says HTF intent LTF execution helps you to get a better risk-reward ratio and a higher probability trade, this is working on every financial asset from crypto to forex to commodities and stock market
POI - POINT OF INTERES an area in the market where price have a higher probability to go bullish then bearish lets say 70/30 % probability.
Example price come into a ,,support,, area this means we have a BULLISH POI we have a better probability to go higher then lower

US02Y-US10Y 🎯Wells Fargo Chart of the Week 🎯💰🤔Hey Fam. 😊🙏Just wanted to share this information with you all.. I found it very interesting.. This was a chart of week that Wells Fargo shared on there site. I thought it was interesting how they saw a 4 week inversion roughly 43 weeks on average in regards to our last seven Recessions before they happened (Shaded Areas on chart) Before a US recession officially started.. which is roughly about 10 months..🎯💰🤔👌🙏😊

RISK ON vs RISK OFF ‼️Risk-on risk-off is an investment setting in which price behavior responds to and is driven by changes in investor risk tolerance. Risk-on risk-off refers to changes in investment activity in response to global economic patterns.
During periods when risk is perceived as low, the risk-on risk-off theory states that investors tend to engage in higher-risk investments. When risk is perceived to be high, investors have the tendency to gravitate toward lower-risk investments.
RISK ON - is when investor are looking to multiply their money, they are looking for RISK. MORE RISK - MORE MONEY
RISK OFF - is when investors are looking to keep/save their money, they are looking to protect more than to RISK. MORE PROTECTION - LESS MONEY

Upcoming Important Events in the Cryptocurrency Universe in 2022If you find the analysis useful, please like and share our ideas with the community. Any feedback and suggestions would help in further improving the analysis!
Don't you think 2021 was a big year for cryptocurrency? Many cryptos have gained, while others have lost their battle. On the other hand, significant crypto players such as Bitcoin, BNB, and Dogecoin have upgraded to boost their efficiency.
Ethereum (ETH)
After Bitcoin comes the world's second-largest cryptocurrency, Ethereum. As we all know, it has operated on a Proof-of-Work system until now. But it is soon going to upgrade itself to Proof-of-Stake. With PoS, the blocks can be assigned randomly, significantly reducing energy consumption and being environmentally friendly. The transition to ETH 2.0 has been in the works for quite some time now. EIP 1559, as part of the London Hard Fork upgrade, made Ether a deflationary asset and brought it closer to ETH 2.0. The ETH's current execution layer will be ported over to the incoming PoS consensus layer and supported by the clients currently in charge of the Eth1. Interacting with ETH will remain incredibly similar post-Merge too. The Ethereum Virtual Machine remains an enigma to people with a high level of programming skills. To address this, ETH 2.0 will be using web assembly language in a system called eEASM. With great improvement, it can execute Ethereum app code right in today’s web browser. Since one of the major issues with ETH is its high gas fees, the cost can significantly fall with this upgrade, encouraging many projects to build on the ETH blockchain. Other benefits would be concerning the impending upgrades such as sharding, rollups, and call data improvements after the Merge, which will focus on increasing scalability without compromising decentralization.
Cardano (ADA)
Do you remember Cardano’s software engineer Sebastian Nagel estimated the release date for IOHK's Hydra upgrade would happen between 6 and 12 months? If that comes out true, it is most likely that ADA can be upgraded in 2022. It would do wonders for the crypto's price, which lost about 57% of its value in 2021. By the way, what does Hydra do? It can give ADA a massive processing speed. For instance, the world's leading payments network, Visa, can process 15,000 transactions per second, while with this upgrade Cardano network can process up to 1 million transactions per second. It is an enormous step towards scalability.
XRP (XRP)
As we all know, XRP is the native cryptocurrency for products that Ripple Labs develop. It uses a distributed consensus ledger using a network of validating servers and crypto tokens called Ripples or XRP. The most impactful event that Ripple will have in 2022 concerning the lawsuit with the SEC. If the verdict favors XRP, then the crypto price can increase drastically. On the other hand, Ripple has also announced a few more partnerships that should come online in 2022, one among those could be with LuLu Exchange. It will use RippleNet for making payments between the UAE and Pakistan. Another significant project would be the Ripple Liquidity Hub, which is set to launch this year. You can find the best cryptocurrency prices from a variety of sources.
Terra (LUNA)
Last year was an excellent start for Terra. The crypto team has been developing innovative features to provide the best metaverse experience for all its users. Terra is all set to launch its Metaverse Alpha Version in 2022. The version is still under testing. The main goal is to open it for early access with an implemented video conference function. Terra's team is also working on the early access ticket sale with limited NFT editions.
Polkadot (DOT)
Polkadot is rolling out to be the most robust platform for scalability, security, and innovation. DOT is now working on Parachain Rollout. Parachains are the diverse individual layer-1 blockchains that run parallel on Polkadot, connected to the Polkadot Relay Chain, and secured by the Relay Chain's validators set. Polkadot's cross-chain composability allows any data or asset to be sent between parachains, opening up many new use cases and applications. Let's hope to see this new upgrade launching in 2022.
Avalanche (AVAX)
Avalanche is an open-source platform for launching highly decentralized applications, new financial primitives, and interoperable blockchains. It is the fastest blockchain in the industry by time to finality and has compatibility with the ETH smart contracts. Even though Avalanche is the fastest level-scaling contract in the market, its team is now working on more scaling solutions to make it even faster. This upgrade of the Avalanche protocol can make it even quicker. With an increasing number of projects on the Avalanche network, the value of the Avalanche token is likely to increase in 2022.
Final Words
World entering the new era of metaverse cryptocurrencies will hold great promise having various benefits. We are sure that these upgrades will boost efficiency and attract people to invest in cryptocurrencies.
----------------------------------------------------------------------------------------------------------------------------------------------------------------------------
More details can be found on the Mudrexofficial reddit page

⚠️ Read this if you trade ⚠️The impact of the subconscious and emotions on trading with simple solutions.
Why can't we make a profit even though we have a correct analysis of the chart?
Why does the price return from where we sell it?
Why do all those who enter with a small volume make a profit which is also a small one, but when the same one is entered with a large volume, it becomes a loss?
Why do we get scared and sell soon?
Why are we so hopeful when we are at loss, but still close our position in the same situation?
Maybe these and similar questions have arisen for you in your trading, but where is the problem?
Why is it that even though we know everything and predict everything correctly, we still don't make much money?
The answer to all these questions lies in the subconscious. As you know, the subconscious is programmed by us, and an important duty of the subconscious is taking the necessary actions when the conscious is not able to, and these actions are taken according to the plan.
The ones we give ourselves come into being.
The subconscious mind usually appears when we are experiencing emotions (happiness, excitement, fear, anger, sadness, etc.) and takes the necessary actions.
For example, when we make a lot of money, we feel happy, and from here on, the decisions are based on emotions, or when we lose and get upset or angry, and from now on, our decisions are still based on emotions.
So here is the problem.
What is the solution that emotions take the permission to function correctly from us and we can not do the necessary work properly?
In order to solve this problem, we must point out the cases that cause emotions to be extremely dominant and decisions to be sent from the subconscious.
1- No entry strategy: Many only listen to the news for trading, which is certainly harmful, there is news for friends who have no entry and exit strategy, and they are the first group to be easily preyed upon by whales.
What is the strategy? Strategy means selecting an entry, exit, and stop-loss point based on specific techniques and conditions. This is done before entering and opening the position. The problem is that many of us only think about the entry point and we never know where we are going to sell. We just want to sell whenever we go up a little, or we may even have a price for sale, but we do not place an order for that price, and we want to sell whenever it reaches that price.
Rest assured, in the second case, you will never sell at a good profit because the subconscious does not allow it, and a voice in your ear says: it is going up, do not sell!
So strategy in one sentence means knowing what I am doing and to know how much I will gain before I enter a share or cryptocurrency and also if I've made a mistake, how much I will lose.
So if you do this before buying, you won't have to deal with feelings and you will find the correct and logical points to enter and exit.
If you are going to decide what to do after the purchase or when you are at a loss or a profit, be sure that all your decisions are made unconsciously. And you can not have the correct performance and in 90% of cases, your position is closed with a loss.
