Gann Trading Strategy: Understanding Gann Price CyclesGann Trading Strategy: Understanding Gann Price Cycles.
Gann Trading Strategy with a deep dive into Gann Price Cycles and candle range averaging to forecast upcoming highs and lows. Learn how to apply Gann's time and price principles, predict market turning points, and enhance your trading accuracy.
Gann Price Cycles: Understanding Market Movements with Precision
- Gann Price Cycles are a fundamental concept in W.D. Gann's trading methodology, used to predict market highs and lows based on historical price movements and time cycles. Gann believed that markets move in predictable cycles, influenced by both price and time relationships. By studying these cycles, traders can anticipate future turning points with greater accuracy.
Key Principles of Gann Price Cycles:
1. Repeating Market Patterns – Price movements follow specific cyclical patterns that repeat over time. Identifying these patterns helps traders forecast future price swings.
2. Time and Price Symmetry – Gann emphasized that time and price must be in balance. When a market completes a significant time cycle, it often results in a reversal or acceleration of trend.
3. Natural Market Rhythms – Just like planetary cycles, financial markets move through predictable 360-degree price cycles, based on Gann’s Square of Nine and Gann Angles.
4. Averaging Price Ranges – By analyzing historical price ranges and averaging them, traders can estimate the next high or low in the market.
Tradingstrategy

Gann Trading Strategy | Predict Market Highs & Lows with Gann.Gann Trading Strategy | Predict Market Highs & Lows with Gann Trading Strategy
In this video we will unlock historical secrets of Sacred Geometry and how they apply to financial markets through W.D. Gann's Time & Price concepts. This video explores the deep connection between natural mathematical principles, the Golden Ratio (0.618), Fibonacci levels, and market structure—all rooted in ancient sacred geometry used in art, architecture, and astronomy.
Markets are not random; they follow universal laws found in nature, human anatomy, and celestial movements. Gann discovered that time and price cycles repeat in predictable patterns, allowing traders to anticipate reversals with precision. This video will guide you through how to use these ancient principles in modern trading.
What You'll Learn in This Video:
✅ Understanding Gann’s Time & Price Geometry – The foundation of market movements
✅ Golden Ratio & Fibonacci Trading – How 0.618, 0.786, and 1.618 shape market trends
✅ The ABCD Pattern in Trading – How to use structured price action setups.
Discover the hidden connections between Sacred Geometry, W.D. Gann’s Time & Price principles, and financial markets in this powerful Gann trading lesson. Markets are not random; they move according to natural laws, mathematical ratios, and planetary cycles—the same principles found in ancient architecture, astronomy, and human biology. Gann’s work revealed that time and price must synchronize for major market reversals, and by understanding these patterns, traders can anticipate key turning points with accuracy. This lesson will dive deep into Gann’s geometric approach, the Golden Ratio (0.618), Fibonacci levels, and structured price action setups, all of which play a crucial role in market movements.

About the Volume OBV indicator...
Hello, traders.
If you "Follow", you can always get new information quickly.
Please click "Boost" as well.
Have a nice day today.
-------------------------------------
I think TradingView is attractive because users can create charts as they want.
However, since the number of indicators that can be added to the chart is limited depending on the plan, you have to add indicators that fit your plan.
As a result, I ended up integrating multiple indicators into one indicator.
-
The HA-MS indicator in this chart is a public indicator.
If you search the Internet, you can find detailed explanations on how to interpret the OBV indicator.
I expressed it as follows to make this interpretation method more realistic.
The body color of the candlestick is indicated by the 4-stage OBV indicator.
The OBV indicator is distinguished in the same way as the Price Channel indicator.
You can interpret it like the Bollinger Band.
That is, if the middle line that divides 2 and 3 rises by more than 3, you can interpret that the buying force is increasing.
1: It means below the lower line of the Price Channel and is indicated in dark red.
If you enter this section, there is a high possibility of a sharp decline.
You should check the support and resistance points because it is likely to stop falling soon and rise to 2.
2: It means between the lower line and the middle line of the Price Channel and is indicated in red.
This section is likely to show a weak downward sideways movement.
Therefore, if it rises from 1->2, there is a possibility of a short rise. However, if it fails to rise to 3, it is likely to fall back to 1, so it is recommended to make short trades.
3: It means between the middle line and the upper line of the Price Channel and is displayed in green.
This section is likely to show a weak upward sideways movement.
If it rises from 2 -> 3 and shows a sideways movement, you should focus on finding a buying point.
4: It means above the upper line of the Price Channel and is displayed in dark green.
If it enters this section, there is a high possibility of a sharp rise.
Since it is likely to stop rising soon and fall to 3, you should check the support and resistance points.
-
What we should pay attention to is when it changes from 1 -> 2, 4 -> 3.
As explained above, 1 is a section located below the lower line of the Price Channel, so there is a high possibility of a sharp fall.
4 is a section located above the upper line of the Price Channel, so there is a high possibility of a sharp rise.
Therefore, you can proceed with an aggressive buy when it changes from 1 -> 2, and you can proceed with a sell when it changes from 4 -> 3.
In the case of futures, it can be used as reference information for entering and liquidating LONG and SHORT positions.
-
They say that the only things you need on a chart are price and trading volume.
However, it is not easy to interpret this in reality.
To compensate for this, we hid the colors of the existing candles and displayed them in 4 stages of OBV so that you can intuitively see which stage the current price is at.
-
Thank you for reading to the end.
I hope you have a successful transaction.
--------------------------------------------------

Chart Analysis and Trading Strategy (2)
Hello, traders.
If you "Follow", you can always get new information quickly.
Please also click "Boost".
Have a nice day today.
-------------------------------------
If you look at the candle that the finger is pointing to, you can see that it is a bearish candle with Open > Close.
If you look at this on a 30m chart, you can see that it moves as follows and forms lows and highs.
These candle movements come together to form a candle arrangement, and by looking at this, we ultimately set support and resistance points.
As your understanding of candles deepens, you will study charts in various ways.
The reason is that you may know it when you look at the chart, but you cannot when you trade.
That is, because the understanding of candles is not clear.
As you study the charts over and over again, you will learn that charts tend to converge to the median and average values.
You learn that they converge to the median and average values while studying various indicators, but you end up not knowing what you can learn from them.
What is important in the arrangement of candles is that the arrangement of the Open and Close bodies and the Low and High tails that make up the candles play an important role in setting support and resistance points.
I recommend that you understand this explanation through the Internet or a book.
The reason is that it is something that requires a lot of time investment to acquire.
-
The HA-MS indicator was created to quickly display support and resistance points as objective information.
Therefore, you can see that when the channel composed of the HA-Low indicator and the HA-High indicator is broken, a trend is formed, and if not, a sideways movement is shown.
The HA-Low, HA-High indicators are indicators created by combining the arrangement of candles and the RSI indicator on the Heikin-Ashi chart.
Therefore, the trading strategy is used to create a trading strategy depending on whether there is support near the HA-Low, HA-High indicators.
The other indicators, BW(0), BW(100), DOM(-60), and DOM(60), are used as support and resistance to create a detailed response strategy.
-
Based on this information, trading should be divided into trading in the sideways section and trading in the trend to create a trading strategy.
This trading time is created based on whether there is support in the HA-Low, HA-High indicators.
Since it is made of indicators, I think it provides objective information for chart interpretation with others, reducing the room for controversy.
This is the fundamental reason for using indicators.
It is because we can share objective information with each other.
-
In trading within the sideways section, information about the trend is not particularly necessary.
If you set the sideways section with your own indicator or support and resistance points, you can trade based on whether there is support at the end of that section.
-
However, when you leave the sideways section, information about the trend is necessary.
That is why we use the M-Signal indicator and Trend Cloud indicator on the 1D, 1W, and 1M charts as indicators for the trend.
For short-term information, you can use the M-Signal indicator and Trend Cloud indicator on the 1D chart.
If the Trend Cloud indicator is displayed in green and the price is maintained above the M-Signal indicator on the 1D chart, it can be interpreted that there is a high possibility of a turn to an uptrend.
If not, it can be interpreted that there is a high possibility of a downtrend.
The mid- to long-term trend can be identified by checking the arrangement status of the M-Signal indicator on the 1W chart and the M-Signal indicator on the 1M chart.
That is, if the M-Signal on the 1W chart > the M-Signal on the 1M chart, it can be interpreted that the mid- to long-term trend is maintaining an uptrend.
Therefore, in order to continue the uptrend from a long-term perspective, the price must be maintained above the M-Signal indicator on the 1M chart.
If not, it is recommended to make short trades if possible.
-
To better set the support and resistance points, look at the 1M chart > 1W chart > 1M chart in that order and draw a horizontal line on the indicators (HA-Low, HA-High, BW(0), BW(100), DOM(-60), DOM(60)) displayed on the chart and mark them on the chart.
Mark the support and resistance points on the chart as above.
This marks the support and resistance points with the low and high points.
-
It is not easy to start trading at the low or high points every time.
Therefore, as I mentioned earlier, it is important to create a detailed response strategy based on the median and average values.
For this, the StochRSI 50 indicator is displayed.
In addition, the Close of the Heikin-Ashi chart of the 1D chart, which can be usefully utilized when trading below the 1D chart, is added.
-------------------------------------------------
The information I mentioned above is ultimately information that can be obtained through chart analysis.
You can create a trading strategy by deciding whether to check it directly with your eyes and indicate support and resistance points, or to use an indicator that can be checked more quickly.
Chart analysis is about understanding the movement of the chart, and actual trading is conducted according to the trading strategy.
You may think that chart analysis is the trading strategy, but it is not.
No matter how well you analyze charts with your eyes, if you analyze charts when your psychological state is unstable due to subjective thoughts based on various information other than the chart, as I mentioned earlier, you may end up trading in the wrong direction.
To prevent this, it is necessary to use indicators so that subjective thoughts are not applied.
Even if you start trading at the support and resistance points created by the indicator, and it goes in the opposite direction and you suffer a loss, the influence will be weak.
The reason is that you created a trading strategy with the support and resistance points created by the indicator in advance.
Things to consider when starting a trade in a trading strategy are:
1. When to buy or how to buy
2. When to cut loss or how to cut loss
3. How to realize profit
For this reason, it is important to set support and resistance points through chart analysis.
-
It is better to do chart analysis briefly.
If you spend too much time analyzing charts, you may end up being trapped in your own subjective thoughts, so be careful.
I think you can tell whether you will do chart analysis in an analyst-like manner or in a chart analysis necessary for trading by looking at how the support and resistance points are marked on the chart.
The ideas of chart analysis often do not include things that need to be considered when starting a trade.
Therefore, in order to apply them to actual trading, you need to create a trading strategy through chart analysis.
The chart analysis for trading reduces the need for separate chart analysis because the information necessary for the trading strategy is displayed on the chart.
However, it may need to change depending on your investment style or the time frame chart you are actually trading on, but it can be advantageous for trading because the support and resistance points are marked.
To ensure this, you need to create an indicator and receive support and resistance points as objective information.
-
Thank you for reading to the end.
I hope you have a successful trade.
--------------------------------------------------

Dangers of Giving Up Too Soon on a Trading Strategy GOLD, FOREX
There are hundreds of different strategies to trade. Some of them are losing ones, some provide modest results and some strategies are very profitable.
Novice traders often struggle to find the right strategy that suits their personality, financial goals and risk appetite. Unfortunately, they also tend to make some common mistakes that can undermine their performance and confidence.
❌ One of the biggest mistakes that they make in their search is that they give a strategy a very short trial period. It simply means that they are trying to assess the validity of the strategy, trading that for a very short time span (usually a day to a week).
Please, realize the fact that the performance of the strategy can be measured only with extended backtesting - meaning that the strategy should be tested on multiple financial instruments and for a long period of time and applying multiple evaluation metrics.
Moreover, if the strategy proves its efficiency on backtesting, it should be traded on a demo account at least 2 months before the valid performance can be calculated.
❌ Another common mistake is that many traders drop the strategy once it starts losing. And by losing, I mean just 2–3 trades in a row.
Newbies are searching for the approach that never loses.
They may even abandon a trading strategy once they catch JUST ONE bad trade.
✅ In contrast, a smart trader realizes that one bad trade does not define the performance of the strategy. Moreover, such a trader calmly faces the losing streaks and sticks to the strategy.
Take a look at that picture.
On the top, we have the traits of a newbie trader and his equity curve.
He abandons the strategy after he faces the loss, not giving the strategy a chance to recover.
When he changes the strategy, he starts recovering a little bit and a losing period follows.
He drops a strategy again, and he keeps following this vicious cycle till his entire account is blown.
On the bottom of the picture, we see the equity curve of a smart trader.
Even though he faces losses occasionally, his strategy always gives him a chance to recover and with time his trading account steadily grows.
Please, realize the fact that a perfect strategy does not exist. You will lose the money occasionally anyway. What distinguishes a smart trader from a dumb one is his discipline and trust to his trading system and willingness to face losses.
❤️Please, support my work with like, thank you!❤️
I am part of Trade Nation's Influencer program and receive a monthly fee for using their TradingView charts in my analysis.

DISASTER Recipe for trading destruction (5 Points)🏊♂️ Do You Ever Try Swimming Upstream?
Unless you’re doing it for exercise and the strain…
You’ll know it’s exhausting.
And if you go against the direction of the waves, you’ll get nowhere very slowly—until you either reach the destination or give up.
Well, I find that trading against the trend is just as bad.
When you trade against the trend – your EGO starts to talk.
Your opinions start to enhance, and your irrational mind begins to take over.
I feel I need to explain why it’s so dangerous to go against the trend.
Let’s dive in.
🚫 Never Force a Trend
The worst thing you can do is bottom or top pick a market.
What makes you feel that you know the market is about to turn?
❓ Do you have inside information?
❓ Do you have a stronger intuition?
❓ Did you do some crazy future analysis?
And what’s the point?
Let the market reach its bottom or top, turn around – move a bit in the new direction until you have confirmation.
And then POUNCE.
You only need 30% of the trend and then close for a profit.
⏳ Patience Pays Off
The market moves in cycles.
📈 Sometimes it’s a roaring bull.
📉 Other times it’s a sulking bear.
🐢 And other times, it’s a bladdy tortoise – going sideways to Timbuktu.
The best thing to do is wait for the market to move from an unfavourable environment into a favourable time for your system and strategy.
🔄 Reassess and wait.
There’s no rush in trading.
🔄 Adjust and Act
The markets are always evolving.
You need to continuously adapt and act on:
📌 New markets to add
📌 Old markets to rid of
📌 Strategy tweaks to improve your win rate
📌 System considerations to boost winners and cut losses
Flexibility within your trading strategy is key.
🌊 Flow with Momentum
Ever noticed how surfers ride waves?
They don’t fight the ocean; they flow with it.
Traders should do the same with market momentum.
📈 When the market is going up – Go up with it.
📉 When the market is going down – Go down with it. (I mean short and sell, of course!)
➡️ When the market is moving sideways – Observe, report, and wait for better conditions.
Align your trades with the sentiment.
Going against the current market mood can be disastrous.
❌ Never Predict
Everything you see in the charts and fundamentals is based on past data.
So, it’s IMPOSSIBLE to predict with certainty where a market will go.
This is why you need risk management rules and stop losses with EVERY trade.
You can’t predict, BUT you can probability predict.
And that’s the difference between knowing and potential.
🎯 Recap: Trade Smart!
📌 Never Force a Trend: Be patient and wait for the right market conditions.
📌 Patience Pays Off: Let the market cycle play out before jumping in.
📌 Adjust and Act: Regularly review and tweak your strategy with new information.
📌 Flow with Momentum: Align your trades with the current market sentiment.
📌 Never Predict: React to market conditions rather than trying to predict them.
💡 Remember: The best traders ride the waves – not fight them.

Trading is the realm of response
Hello, traders.
If you "Follow", you can always get new information quickly.
Please also click "Boost".
Have a nice day today.
-------------------------------------
It's been a while since I made an indicator and explained it, so I'd like to take the time to introduce and explain something I heard a long time ago.
(Original text)
I made purchases at m-signal 1W in yesterday's fall as I see it rose above ha-low and closed above m-signals. It looks like m-signals can't prevent traps. Now I'm losing money again. I think it's better to make purchases when RSI is below 30. I don't want to feed market makers, somehow it happens over and over.
-
Looking at the above, it seems that the purchase (LONG) was made when the price rose above the M-Signal indicator on the 1W, 1D chart and then started to fall.
If we check this on the 30m chart, it is expected that the purchase (LONG) was made near the section indicated by the circle section.
I said that it would have been much better to buy (LONG) when RSI was below 30, but when RSI was below 30, it refers to the section from February 25 to March 1, so I think it's regret due to the loss.
-
If you look at what I explained as an idea, I said that you need to get support in the section marked with a circle to continue the upward trend.
And, I said that support is important near the HA-Low indicator when it falls.
Therefore, if it falls in the section marked with a circle, you should enter a sell (SHORT) position.
However, if you do not see a downward trend, you should trade based on whether there is support in the HA-Low indicator.
-
To check for support, you need to check the movement for at least 1-3 days.
Therefore, checking for support is a difficult and tedious task.
Since most futures transactions are made on time frame charts below the 1D chart, you cannot check for support for 1-3 days.
Therefore, you need to check the movement at the support and resistance points you want to trade and respond accordingly.
-
The coin market is a market where trend trading is good.
Therefore, it is important to know what the current trend is.
It is better to think of the basic trend based on the trend of the 1D chart.
The current trend of the 1D chart is a downtrend.
Therefore, the SHORT position can be said to be the main position.
As mentioned earlier, in order to turn into an uptrend, support must be received within the range indicated by the circle.
If not, it is likely to continue the downtrend again.
Since the HA-Low indicator has been newly formed, the 89253.9 point is the point where a new trading strategy can be created.
If it is not supported by the HA-Low indicator, it is likely to lead to a stepwise downtrend, so you should also think about a countermeasure for this.
-
What we want to know through chart analysis is the trading point, that is, the support and resistance points.
You should decide whether to start trading depending on whether there is support at the support and resistance points.
Even if you start trading properly at the support and resistance points you want, you must also think about how to respond to a loss cut.
If you cannot think of a response plan for a loss cut, it is better not to trade at all.
-
Indicators are only reference materials for your decisions, not absolute.
- The M-Signal indicator on the 1D, 1W, and 1M charts is an indicator for viewing trends,
- The HA-Low and HA-High indicators correspond to points for creating trading strategies.
The creation of the HA-Low indicator means that it has risen from the low range, and if it is supported by the HA-Low indicator, it is the time to buy.
If it does not, and it falls, there is a possibility of a stepwise decline, so you should think about a response plan for this.
The creation of the HA-High indicator means that it has fallen from the high range, and if it is supported by the HA-High indicator, there is a possibility of a full-scale upward trend.
If not, it may fall until it meets the HA-Low indicator, so you should think about a countermeasure for this.
-
If the price is maintained near the StochRSI 50 indicator on the 1D chart, it is expected to lead to an increase to rise above the HA-Low indicator on the 1D chart.
At this time, if it rises above the M-Signal indicator on the 1D and 1W charts, it is likely to lead to an attempt to rise near 94827.9.
If not, it is likely to end as a rebound.
-
Thank you for reading to the end.
I hope you have a successful trade.
--------------------------------------------------

Portfolio Selection for the Week – 10th February 2025This portfolio selection is for educational purposes only!
The key to successful trading lies in consistency. Consistent decision-making, combined with a positive edge, is what leads to long-term success in the markets. This is why we regularly conduct portfolio selection.
At present, the Japanese Yen (JPY) is the strongest currency, followed by the US Dollar (USD), Australian Dollar (AUD), and Canadian Dollar (CAD). On the weaker side, we see Swiss Franc (CHF), Euro (EUR), New Zealand Dollar (NZD), and British Pound (GBP).
Most currency pairs have been experiencing secondary trends. Once this phase concludes, we can look to align trades with the dominant market trend.
If you find this content valuable, hit the boost and share your thoughts in the comments!
Wishing you a profitable trading week! 🚀📈

Gann Time Cycles Strategy: How To Predict Market Highs & Lows ?Gann Time Cycles Strategy: Predict Market Highs & Lows with Precision.
Mastering Gann Time Cycles: The Key to Predicting Market Highs & Lows
In this Gann trading strategy on time cycles, we explore a powerful method to predict market highs, lows, and reversals with precision. Gann’s theory is based on the principle that time governs market movements and that price action follows a structured mathematical cycle. By understanding and applying Gann Time Cycles, traders can identify key turning points well in advance, giving them a significant edge in the market.
The Importance of Time in Market Movements
W.D. Gann famously stated that "Time is more important than price. When the time is up, the market will reverse based on time." This means that while price levels are crucial, it is the time factor that ultimately determines when the market will make a major move. By analyzing Gann’s time cycles, we can predict periods where a reversal or a strong trend continuation is likely to occur.
📌 Timestamps: Gann Time-Price Squares: The Secret to Predicting Market Highs & Lows
00:00 ▶️ Introduction.
00:25 ▶️ Risk Disclaimer.
01:30 ▶️ What is Gann Time and Price Square.
02:10 ▶️ Key Numbers in Gann's Method
03:10 ▶️ Constructing Time and Price Squares
04:19 ▶️ Step 1 - Identify a Major Swing High or Low
05:18 ▶️ Step 2 - Apply Gann’s Time Cycles
05:39 ▶️ Step 3 - Draw a Gann Square
06:15 ▶️ Step 4 - Look for Price Reactions at Time Point
06:45 ▶️ Step 5 - Use Gann Angles for Confirmation
07:20 ▶️ Step 6 - Confirm with Market Behavior
07:50 ▶️ Step 7 - Set Entry, Stop-Loss, and Take Profit
08:30 ▶️ Gann Time-Price Squares: The Secret to Predicting Market Highs & Lows | Example - 1
14:00 ▶️ Gann Time-Price Squares: The Secret to Predicting Market Highs & Lows | Example - 2
16:50▶️ Conclusion & Key Takeaways
Applying Gann’s Time Cycles to Identify Market Turning Points
To successfully use this strategy, traders need to:
✅ Identify major swing highs and lows in the market
✅ Apply Gann’s time cycles to determine potential reversal points
✅ Use the Gann Square in TradingView to map key price levels
✅ Recognize time-price intersections to pinpoint entry opportunities
✅ Utilize Gann angles for additional confirmation
✅ Set proper entry points, stop-losses, and take-profits based on time predictions
By integrating these steps into your trading plan, you can improve your entry and exit accuracy and anticipate market movements before they happen.
Conclusion: Why Gann Time Cycles Are a Game-Changer
Gann’s Time Cycles provide traders with an advanced forecasting tool that allows them to anticipate market movements with greater precision. Unlike traditional technical indicators that rely on lagging price data, Gann’s method allows you to predict future reversals before they happen, giving you an edge over other traders.
If you apply this strategy correctly, you will begin to see the certainty within the randomness of the market. The key is to remain disciplined, test these time cycles on real charts, and refine your understanding through consistent practice.

Trading strategy is determination and waiting
Hello, traders.
If you "Follow", you can always get new information quickly.
Please click "Boost" as well.
Have a nice day today.
-------------------------------------
BW(100) indicator and HA-High indicator show the high point range.
In other words, the fact that the BW(100) indicator and HA-High indicator were created means that it has fallen from the high point range.
Therefore, the range made up of the BW(100) indicator and the HA-High indicator is called the high boundary zone.
When it falls in this range, you can sell (SHORT), but it is not easy to enter the actual sell (SHORT) position.
Therefore, in order to reduce this difficulty, the box range was set and displayed based on the HA-High indicator.
Therefore, when it falls below the 2.9660 point and shows resistance, it is possible to enter a sell (SHORT) position for the last time.
In that sense, it can be said that entry was possible today.
-
Currently, the StochRSI indicator is showing a pattern of rising in the oversold zone and then failing to continue the upward trend and falling again.
This means that the decline is strong.
However, when the StochRSI indicator falls again to the oversold zone and then rises, it is highly likely to show a large increase depending on where it is supported.
In that sense, if it shows support in the second zone of 2.5127-2.6031, it is highly likely to show a large increase.
If not, there is a possibility of meeting the M-Signal indicator on the 1W chart.
-
(30m chart)
For a trend change, you can see where it is based on the MS-Signal indicator.
However, you need to check whether the trend is sustainable at the support and resistance points.
In other words, it is currently showing signs of rising above the MS-Signal indicator.
If it continues to rise like this, in order to continue the upward trend, it must rise above the M-Signal indicator and 5EMA+StErr indicator on the 1D chart to maintain the price.
If not, it will fall again.
Therefore, you need to buy (LONG) when it is supported near the HA-Low indicator and BW(0) indicator, and liquidate when it is resisted near the MS-Signal indicator.
If you continue trading like that, if the MS-Signal indicator rises higher and the price is maintained, you can check for support near the M-Signal indicator and 5EMA+StErr indicator on the 1D chart and respond.
Therefore, when looking at the 30m chart, it may be advantageous to trade with a buy (LONG) position.
Then, when you meet the HA-High indicator or BW (100) indicator, you trade with a sell (SHORT) position.
If you had previously traded with a sell (SHORT) position on the HA-High indicator or BW (100) indicator on the 30m chart, it would have been the best choice.
-
Thank you for reading to the end.
I hope you have a successful trade.
--------------------------------------------------
- Big picture
I used TradingView's INDEX chart to check the entire range of BTC.
(BTCUSD 12M chart)
Looking at the big picture, it seems to have been following a pattern since 2015.
In other words, it is a pattern that maintains a 3-year bull market and faces a 1-year bear market.
Accordingly, the bull market is expected to continue until 2025.
-
(LOG chart)
Looking at the LOG chart, we can see that the increase is decreasing.
Accordingly, the 46K-48K range is expected to be a very important support and resistance range from a long-term perspective.
Therefore, we do not expect to see prices below 44K-48K in the future.
-
The Fibonacci ratio on the left is the Fibonacci ratio of the uptrend that started in 2015.
That is, the Fibonacci ratio of the first wave of the uptrend.
The Fibonacci ratio on the right is the Fibonacci ratio of the uptrend that started in 2019.
Therefore, this Fibonacci ratio is expected to be used until 2026.
-
No matter what anyone says, the chart has already been created and is already moving.
It is up to you how to view and respond to it.
Since there is no support or resistance point when the ATH is updated, the Fibonacci ratio can be appropriately utilized.
However, although the Fibonacci ratio is useful for chart analysis, it is ambiguous to use it as a support and resistance role.
The reason is that the user must directly select the important selection points required to create the Fibonacci.
Therefore, it can be useful for chart analysis because it is expressed differently depending on how the user specifies the selection point, but it can be seen as ambiguous for use in trading strategies.
1st: 44234.54
2nd: 61383.23
3rd: 89126.41
101875.70-106275.10 (when overshooting)
4th: 134018.28
151166.97-157451.83 (when overshooting)
5th: 178910.15
-----------------

What I think trading is...
Hello, traders.
If you "Follow", you can always get new information quickly.
Please click "Boost".
Have a nice day today.
-------------------------------------
Thank you @TradingBrokersView for the great article.
🚨 Bitcoin update! 🚨 BTC rejected at MA50 (4h) inside a Channel Down pattern. If history repeats, we could see a Lower Low at 95K (-10.7%), aligning with MA100 (1d) support. RSI (4h) is confirming bearish momentum.
🔥 Trading Plan: Sell now before further downside!
I was thinking about how to say it, and I came up with this idea.
Thank you again.
------------------------------------
#BTCUSDT 1M
As shown in the chart, it has risen a lot, so it is natural to feel downward pressure.
No one knows how big this downward pressure will be.
However, what I can tell you is the flow of funds.
To see a more detailed flow, you need to look at the gap occurrence status on the 1D chart, but when looking at the overall flow of funds, it is true that a lot of funds are flowing into the coin market.
Selling all of this inflow of funds means that you will not be able to overcome the volatility in the upcoming bull market and will rather increase the probability of suffering losses.
The reason is that the average purchase price is likely to be set too high and is likely to be located in the volatility range.
Therefore, you need to respond according to your investment style.
In other words, if your investment style is one that wants to trade quickly and urgently, a strategy that sells whenever it shows signs of falling would be appropriate to gain profits.
If not, if you have a longer-term outlook or trade mainly in spot transactions, I think it would be better to leave coins (tokens) corresponding to profits rather than selling all of them so that you can more easily purchase them in the future bull market.
Leaving a coin (token) corresponding to the profit means a coin (token) with a purchase principal of 0.
In other words, it means that when the price rises after purchase, the purchase principal is sold.
In that sense, when looking at the BTCUSDT 1M chart, you can see that the Fibonacci ratio point of 1.618 (89050.0) is a very important support and resistance area.
#BTCUSDT 1D
This volatility period is expected to continue until January 31.
Therefore, it is expected that the key will be whether there is support near 101947.24 after this volatility period.
If it falls without support near 101947.24, it is expected that the trend will be determined again by touching the M-Signal indicator on the 1W chart.
If you have been reading my ideas, you will understand that you should not try to create a trading strategy by analyzing charts.
As I mentioned earlier, you should create a trading strategy that suits your investment style with the information obtained from chart analysis.
That is why the opinion that it will fall now and sell everything can be interpreted differently by different people, so you need to be careful.
Some people are currently making profits and others are losing money.
Those who are making profits will have the luxury of waiting even if the price falls, and those who are losing money may be suffering from psychological pressure.
The information I am giving you is to provide information on how to respond to all of these people.
In that sense, you need to focus on the price that I am talking about, that is, the support and resistance points or sections.
If your average purchase price is below the support and resistance points or sections that I am talking about, you can check the downward trend and intensity and judge the situation.
If not, you need to create a response strategy based on how much cash you currently have.
If your current cash holding is less than 20% of your total investment and you feel unstable psychologically, it is a good idea to sell some of it to secure cash.
This will allow you to secure the ability to purchase more even if the price falls, so you will be able to secure a certain level of psychological stability even if the price falls.
I think trading is about responding to your investment style and psychological state in this way.
Therefore, you should calmly look at your current psychological state, check your cash holdings, and create a response strategy that suits your investment style.
This is the strategy I can tell you.
-
Thank you for reading to the end.
I hope you have a successful trade.
--------------------------------------------------

Gann Trading Strategy | Harmonic Cycle & Vibration ModelGann Harmonic Cycle & Vibration Model Explained | Master Market Timing with Gann's Techniques.
In this video, we explore the Gann Harmonic Cycle-Vibration Model, a powerful trading approach inspired by W.D. Gann's timeless principles. This strategy revolves around the natural laws of market movement, where time and price operate in perfect harmony.
Key highlights:
1. End-to-End Cycles: Understand how markets repeat at consistent intervals, starting from significant highs or lows.
2. Square of 9: Learn how this mathematical tool predicts price movements and time cycles by identifying their natural connection.
3. Angles and Degrees: Discover how critical angles like 45°, 90°, and 135° reveal key support, resistance, and reversal points.
This structured system blends time-based cycles with actionable insights, enabling traders to forecast trends and pinpoint turning points effectively. Dive in to master this incredible trading strategy! Gann Astro works on all this major pairs and many more CAPITALCOM:GOLD CAPITALCOM:US100 BINANCE:BTCUSDT FX:EURUSD

Scalp Like a Pro: 5-Minute Trades for Big Wins in Micro-TradingMorning Trading Fam
I'm sharing how I use just price action and candlesticks for my scalping strategy. We'll look at where to enter and exit trades super fast. Perfect for beginners or to refine your skills. Let's get into it with our TradingView setups. Like, Boost, Follow and Share is much appreciated.
Kris/Mindbloome Exchange
Trade What You See

Understanding R/R and Win Rate: The Key to Profitable TradingWhy R/R and Win Rate Matter❓
What’s the one thing that separates consistent traders from those stuck in a cycle of losses? It’s the combination of Risk-to-Reward (R/R) and Win Rate. These two metrics aren’t just numbers—they’re the foundation of every profitable trading strategy.
Today, we’ll break down the facts and numbers behind R/R and Win Rate. You’ll learn how to evaluate whether your strategy is sustainable and why high win rates alone might not be enough. Let’s dive in!
🔍 The Relationship Between R/R and Win Rate
This chart tells the story: your R/R ratio determines the percentage of trades you need to win to break even. But let’s be clear—breaking even isn’t our goal. We aim for profitability, and that’s only possible when your R/R and Win Rate are optimized.
Here are some key examples:
R/R = 5:1 (High Risk, Low Reward):
Out of 100 trades, you need to win 98% just to break even.
One or two losses can wipe out all your profits.
Conclusion: This is unsustainable.
R/R = 1:1 (Balanced):
To break even, you need to win 50% of your trades.
While this ratio is popular, achieving consistent profits requires a Win Rate over 80%, which is challenging.
R/R = 1:2 (Ideal Minimum):
You only need to win 33% of your trades to break even.
With a 50-60% Win Rate, your profits can grow exponentially over time.
Conclusion: This is the most realistic and effective ratio for both beginner and professional traders.
Common Misconceptions About High Win Rates
Many traders mistakenly equate high win rates with profitability. While a Win Rate of 80% might sound impressive, it can still lead to losses if paired with poor R/R.
Example:
Imagine a trader whose win rate is 80%, but their R/R is 5:1. Those 20% losing trades will erase all profits. This is why it’s crucial to analyze both metrics together and not get distracted by flashy results.
The Psychology Behind R/R and Losing Streaks 🧠
Losing streaks are inevitable, even with a solid strategy. What matters is how your R/R and mindset help you navigate them:
The Role of R/R in Losing Streaks:
With an R/R of 1:2, even after a streak of 5 losses, a single win can recover your account.
On the other hand, with an R/R of 5:1, a losing streak can wipe you out entirely.
Mindset Tip:
Don’t fear losses. Instead, focus on executing your strategy consistently. Understand that a few losses won’t hurt your account if your R/R is optimized.
Crafting a Sustainable Strategy 🔧
Here’s how to create a strategy that balances R/R and Win Rate:
Step 1: Define Your R/R
Set a minimum R/R of 1:2 for your trades. This ensures that even with a 40% Win Rate, you remain profitable.
Step 2: Backtest Your Strategy
Test your strategy on historical data to calculate its true Win Rate. Adjust your R/R based on the results.
Step 3: Manage Risk Effectively
Never risk more than 1-2% of your account per trade. This minimizes the impact of losing streaks and allows for long-term growth.
💬 What’s your R/R ratio and how do you manage losing streaks? Share your insights in the comments below!
I’m Skeptic , dedicated to simplifying trading and helping you achieve mastery step by step. Let’s keep growing together! 🤍

Example of explanation of chart analysis and trading strategy
Hello, traders.
If you "Follow", you can always get new information quickly.
Please click "Boost" as well.
Have a nice day today.
-------------------------------------
There was an inquiry asking for detailed information on how to analyze charts and create trading strategies accordingly, so I will take the time to explain it.
Before reading this article, you need a basic understanding of charts.
That is, you need to understand candles and price moving averages.
If you study this first and then read this content, I think you will have some understanding of trading.
---------------------------------------
Whether you are trading spot or futures, marking support and resistance points according to the arrangement of candles on the 1M, 1W, and 1D charts is the first task you need to do before trading.
To do this, you need to understand the arrangement of candles.
Therefore, before using my indicator, it is better to study candles first and understand the arrangement of candles.
When studying candles, it is better not to try to memorize the names or shapes of various patterns.
This is because the overall understanding of candles is important, not the various patterns of candles.
If you study with a book or video, you will be able to understand candles after reading or watching them at least 3 times.
We study charts to trade, not to analyze charts and teach them to others, so we need to study efficiently and save time.
-
If you study candles, you will naturally understand the price moving average.
The indicator corresponding to the price moving average is the MS-Signal indicator.
This MS-Signal indicator consists of the M-Signal indicator and the S-Signal indicator, and the main indicator is the M-Signal indicator.
Therefore, we added the M-Signal indicator of the 1W chart and the M-Signal indicator of the 1M chart to the 1D chart so that we can see the overall trend.
-
You can see the arrangement of the MS-Signal (M-Signal of 1M, 1W, 1D charts) indicators in the example chart.
Currently, since the M-Signal of the 1M chart > the M-Signal of the 1W chart, we can see that it is a reverse array.
If you understand the price moving average, you will understand that we should not trade when it is a reverse array, but when it is a regular array.
Therefore, since the current state of the example chart is a reverse array, it is not suitable for trading.
However, the reason we brought this chart in this state is because the M-Signal indicators of the 1M and 1W charts are converging.
As convergence progresses, it will eventually diverge.
Therefore, since the possibility of price volatility increases, the possibility of capturing the timing for trading increases depending on whether there is support at the support and resistance points.
-
The indicators included in the example chart are drawn as horizontal lines to indicate support and resistance points.
This work performs the same role as the support and resistance points drawn on the 1M, 1W, and 1D charts according to the arrangement of the candles mentioned above.
Therefore, on the 1M, 1W, and 1D charts, horizontal lines are drawn on the indicators to indicate support and resistance points.
You can draw horizontal lines on indicators that are horizontal for at least 3 candles, and if possible, 5 candles.
-
Among the HA-MS indicators, the important indicators are the HA-Low and HA-High indicators.
The HA-Low and HA-High indicators are indicators created for trading on the Heikin-Ashi chart.
Therefore, it is the next most important indicator after the MS-Signal (M-Signal on 1M, 1W, 1D charts) indicator that can tell the trend.
You can create a trading strategy depending on whether there is support near the HA-Low, HA-High indicators.
-
The next most important indicator is the BW(0), BW(100) indicator.
When this indicator is created or touched, it is time to respond in detail.
That is, when you are trading with a trading strategy created from the HA-Low, HA-High indicators, when the BW(0), BW(100) indicators are created or touched, you can choose whether to proceed with a split transaction.
In addition, you can understand the OBV, +100, -100 indicators as response points for split transactions.
Therefore, you do not need to indicate support and resistance points for the OBV, +100, -100 indicators.
However, it is recommended to mark support and resistance points for the HA-Low, HA-High, BW(0), BW(100) indicators.
-
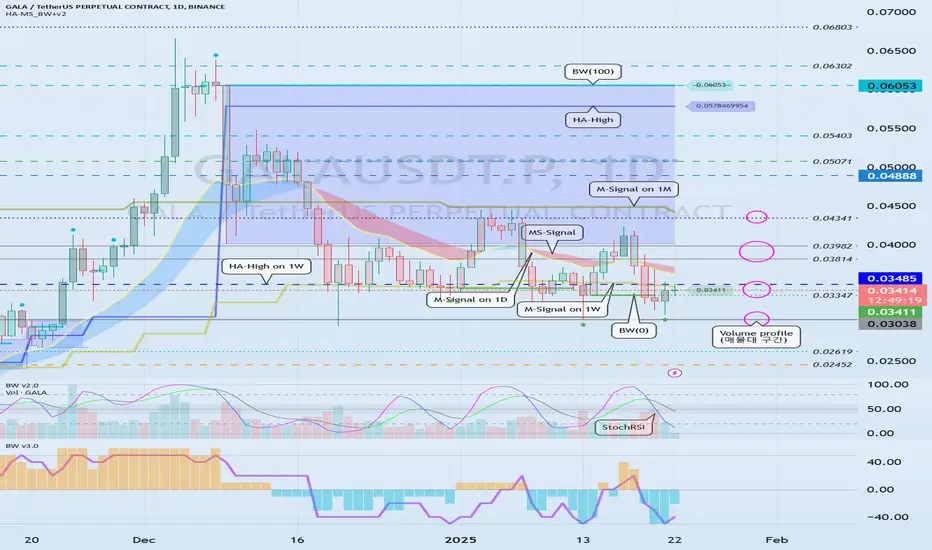
If you look at the price position in the example chart, you can see that it is located in the 0.03347-0.03485 range.
And, the M-Signal indicator of the 1W chart is passing through this range, and the HA-High indicator of the 1W chart is acting as support and resistance.
Therefore, whether there is support near 0.03485 is an important key point.
If support is confirmed near 0.03485, it is a time to buy.
However, since the MS-Signal (M-Signal on the 1D chart) indicator is passing between 0.03485-0.03814, the point to watch is whether the MS-Signal (M-Signal on the 1D chart) indicator can break through upward.
As I mentioned earlier, if the MS-Signal indicator passes, a trend change will occur, so it is significant.
Therefore, in order to turn into a short-term uptrend, it is likely to be supported around 0.03814-0.03982.
Therefore, the first split selling section will be around 0.03814-0.03982.
At this time, whether to sell or hold depends on your investment style and investment period.
-
Since the M-Signal indicator on the 1M chart is passing around 0.04341, it is likely to start when the price is maintained above the M-Signal indicator on the 1M chart in order to turn into a long-term uptrend.
Therefore, the second split selling period will be around the M-Signal indicator on the 1M chart.
This is also something you can choose.
-
An important volume profile section is formed around 0.03038.
Therefore, the 0.03038 point corresponds to a strong support section.
-
(30m chart)
When the time frame chart you are trading is below the 1D chart, it is recommended to activate the 5EMA indicator on the 1D chart.
(I just used the 30m chart as an example. The same principle applies to any time frame chart you usually use.)
This is because there is a high possibility of volatility when the 5EMA of the 1D chart and the M-Signal indicator of the 1M, 1W, and 1D charts are touched.
In other words, you can understand that it plays a certain role of support and resistance.
If it touches the HA-High, BW(100) indicator and falls and falls below the MS-Signal indicator, it will basically touch the HA-Low or BW(0) indicator.
On the other hand, if it touches the HA-Low, BW(0) indicator and rises and rises above the MS-Signal indicator, it will basically touch the HA-High or BW(100) indicator.
However, since it may not do so and may rise or fall in the middle, it is necessary for the support and resistance points drawn on the 1M, 1W, and 1D charts as mentioned earlier.
The support and resistance points drawn on the 1D chart are currently indicated at the 0.03347 point.
Therefore, even if it falls below the MS-Signal indicator, you can understand that there is a possibility of rising again around 0.03347.
Since the 5EMA of the 1D chart and the M-Signal indicator of the 1W chart are passing around 0.03485, we can see that the area around 0.03485 is an important support and resistance zone.
-
Since the StochRSI indicator is currently above 50, we should focus on finding a time to sell.
Since it has fallen below the BW(100) and HA-High indicators, it has fallen too much to start trading with a sell (SHORT) position.
However, if you can respond quickly, you can enter a sell (SHORT) position when it falls from the 0.03411 point where the MS-Signal indicator is passing.
When the StochRSI indicator falls below 50, we should focus on finding a time to buy.
At this time, you can trade based on whether there is support or resistance at the support and resistance points drawn on the 1M, 1W, and 1D charts or around the MS-Signal (M-Signal on the 1M, 1W, and 1D charts), 5EMA, HA-Low, HA-High, BW(0), and BW(100) indicators on the 1D chart.
As mentioned earlier, you should not forget that trading strategies can be created based on whether there is support at the HA-Low and HA-High indicators.
Therefore, if possible, it is recommended to trade based on whether there is support near the HA-High indicator point of 0.03443.
-
Thank you for reading to the end.
I hope you have a successful trade.
--------------------------------------------------
Example of how to use the Trend-Based Fib Extension tool
Hello, traders.
If you "Follow", you can always get new information quickly.
Please also click "Boost".
Have a nice day today.
-------------------------------------
There was a question about how to select the selection point when using the Trend-Based Fib Extension tool, so I will take the time to explain the method I use.
Since it is my method, it may be different from your method.
-
Before that, I will explain the difference from the general Fibonacci retracement tool.
The Fibonacci retracement tool uses the Fibonacci ratio as the ratio to be retracement within the selected range.
Therefore, the low and high points are likely to be the selection points.
The reason I say it is likely is because the lowest and highest points are different depending on which time frame chart it was drawn on.
Therefore, in order to use a chart tool that specifies a selection point like this, you must basically understand the arrangement of candles.
If you understand the arrangement of candles, you can draw the support and resistance points that make up it and determine the importance of those support and resistance points.
The HA-MS indicator that I am using is a more objective version of this.
Unlike the published HA-MS indicator, several have been added.
I do not plan to disclose the formulas of these added indicators yet.
However, if you share my ideas, you can use them normally at any time.
The selection point for using the current Fibonacci retracement tool is the point that the fingers are pointing to.
In other words, the 1st finger is the low point, and the 2nd finger is the high point.
One question may arise here.
Why is it the position of the 1st finger?
The reason is that it is the starting point of the current wave.
Therefore, you can find out the retracement ratio in the current rising wave.
In fact, it is not recommended to use the Fibonacci ratio as support and resistance.
This is because it is better to use the Fibonacci ratio to check how much wave is being reached and how much movement is being shown in chart analysis.
However, the Fibonacci ratio can be usefully used when the ATH or ATL is updated.
-
If the Fibonacci Retracement tool was a chart tool that found out the retracement ratio in the current wave, the Trend-Based Fib Extension tool can be said to be a chart tool that found out the extension ratio of the wave.
Therefore, while the Fibonacci Retracement tool requires you to specify two selection points, the Trend-Based Fib Extension tool requires you to specify three selection points.
That's how important it is to understand the arrangement of the candles.
The chart above is an example of drawing to find out the extension ratio of an uptrend
The chart above is an example of drawing to find out the extension ratio of a downtrend
Do you understand how the selection points are specified by looking at the example chart?
-
The chart above is the chart when the 1st finger point is selected.
The chart above is the chart when the 1-1 hand point is selected.
When drawing on a lower time frame chart, you should be careful about which point to select when the arrangement of the candles is ambiguous.
Examples include the 1st finger and the 1-1 finger.
It may be difficult to select 1-1 and 1 depending on whether they are interpreted as small waves or not.
The lower the time frame chart, the more difficult this selection becomes.
Therefore, it is recommended to draw on a higher time frame chart if possible.
The reason is that the Fibonacci ratio is a chart tool used to analyze charts.
In other words, it is not drawn for trading.
In order to trade, you trade based on whether there is support or resistance at the support and resistance points drawn on the 1M, 1W, and 1D charts.
-
Thank you for reading to the end.
I wish you successful trading.
--------------------------------------------------

I need objective information to help me interpret the chart
Hello, traders.
If you "Follow", you can always get new information quickly.
Please click "Boost" as well.
Have a nice day today.
-------------------------------------
With this decline, the BW(100) indicator was created at 104556.23.
Accordingly, the high boundary section is the 101947.24-104556.23 section.
Unfortunately, since it fell below 101947.24, the key is whether it can receive support near the MS-Signal (M-Signal on the 1D chart) indicator, i.e., around 98892.0, and rise.
If it falls below the MS-Signal (M-Signal on the 1D chart) indicator and shows resistance, it is highly likely to turn into a short-term downtrend.
-
The settings for the StochRSI indicator I use are 14, 7, 3, 3 (RSI, Stoch, K, D).
The source value is ohlc4.
If you set it as above, it will show a movement similar to the StochRSI indicator on my chart.
When the StochRSI indicator
- falls in the overbought zone,
- is located near the 50 point,
- rises in the oversold zone,
volatility is likely to occur.
However, you should check whether there is support near the support and resistance points drawn on the 1M, 1W, and 1D charts and think of a corresponding response plan.
Therefore, by checking the relationship between the movement of the StochRSI indicator and the support and resistance points drawn on the 1M, 1W, and 1D charts, you can choose the point where you can make a trade.
If you can calculate these selection points, I think it is highly likely that you will be able to create a trading strategy that suits your investment style.
It is good to predict future movements with trends or waves, but if you can calculate the point where you can actually make a trade, I think you can create a better trading strategy.
-
I wrote a long article, but
1. Will the StochRSI indicator fall in the overbought zone?
2. Will it receive support near the MS-Signal (M-Signal on the 1D chart) indicator?
3. Will it rise to the high boundary section?
You should focus on the three things above.
---------------------------------
The method of drawing support and resistance points is drawn according to the arrangement of candles.
This method can actually include subjective thoughts, so it requires skill.
Therefore, if possible, I recommend that you sign up as a paid member of TradingView and share my charts with me, and use the HA-High, HA-Low, BW(100), BW(0), OBV, +100, -100 indicators that appear on 1M, 1W, and 1D charts by the HA-MS_BW+v2 indicator as horizontal lines and use them as support and resistance points.
Then, even if others look at the charts, they will be easier to understand, and it will be easier to share opinions on trading strategies according to each other's investment styles.
By utilizing indicators that anyone can use in this way, you will be able to view the charts objectively.
If you trade based on what others tell you, you will likely not be able to respond quickly when sudden volatility occurs.
Therefore, when creating a trading strategy, you should roughly think about how to respond to all cases, both when it goes up and when it goes down.
That's why it's best to draw support and resistance points or other reference materials on your chart if possible and prepare countermeasures accordingly.
-
Thank you for reading to the end.
I hope you have a successful trade.
--------------------------------------------------

Key Elements in Trading & Investing ManagementKey Elements in Trading & Investing Management: Your Blueprint for Success 📊
🔍 Risk/Reward Analysis:
Every trade or investment should start with a thorough risk/reward assessment. This ensures you're not just chasing gains but are aware of the potential downside.
🎯 Clear Entry & Exit Strategies:
Define your entry and exit points before you trade. This discipline keeps your strategy on track, whether the market moves in your favor or against it.
🏞️ Embrace Market Volatility:
Accept drawdowns as part of the trading journey. Just as you'd celebrate profits, handle losses with the same composure to maintain your strategic approach.
🔄 Consistency in Strategy:
Avoid tweaking your strategy after a loss. Stick to your rules to foster a consistent trading methodology.
🔧 Utilize All Available Tools:
Leverage every tool at your disposal on platforms like TradingView—indicators, charts, and risk management features—to make informed decisions.
🎯 Set Profit Targets & Stop Losses:
Implement break-even points and stop-loss orders to secure profits and minimize losses, ensuring each trade is managed with precision.
💰 Focus on Capital Preservation:
Your primary goal should be to protect and grow your capital, not just to celebrate short-term wins. Long-term sustainability is key.
📈 Compound Your Success:
Use your gains wisely to compound your investments rather than risking them on speculative bets. Let your edge work for you over time.
🌟 Master Your Trading Edge:
Identify what gives you an advantage in the market, be it technical analysis, fundamental insights, or a unique approach, and harness it consistently.
💵 Implement Dollar Cost Averaging for Stability:Dollar Cost Averaging (DCA) is your ally for those looking to invest without timing the market. By investing a fixed amount at regular intervals, you buy more shares when prices are low 📉 and fewer when prices are high 📈, averaging out the cost over time. This strategy mitigates the impact of volatility 🌪️ and reduces the risk of investing a lump sum at a peak price.
Consistent Investment: Set up a schedule to invest, say, weekly or monthly, into your chosen assets. 🗓️
Emotional Discipline: DCA helps remove emotion from investing decisions, promoting a disciplined approach. 😌
Long-Term Growth: Over time, this method can lead to significant returns as you accumulate more shares at varied price points. 🌱📈
Incorporate DCA into your broader strategy to enhance your risk/reward balance, ensuring that you're not just reacting to market highs and lows but methodically building your investment base. 💡

Hidden Risk: How to Uncover and Control Before You Click 'Buy'As seasoned traders, we understand that risk management isn't just a beginner's concept; it's the bedrock of sustainable profitability. We've moved beyond the rudimentary rules and are fluent in position sizing and stop-loss orders. But in the dynamic landscape of TradingView, where opportunities arise and vanish in the blink of an eye, even intermediate traders can fall prey to impulsive decisions that erode our hard-earned capital.
The solution? Systematizing our risk assessment with a pre-trade risk profile. It isn't about reinventing the wheel but refining our approach to ensure that every trade aligns with our overall strategy and risk tolerance. It gives us an edge by keeping us disciplined.
The Pitfalls of Complacency
It's easy to become complacent when we've got a few winning trades under our belt. We start to feel invincible precisely when we're most vulnerable. We might skip steps, loosen our stop-losses, or increase our position sizes beyond our predefined limits. We are often driven by emotions rather than logic, and it's a slippery slope.
Remember, even a well-defined risk management plan is useless if it's not consistently applied. Each trade carries unique risks influenced by factors beyond our standard calculations.
Creating a Pre-Trade Risk Profile: A Refresher
Before hitting that buy or sell button, click on TradingView to create a simple risk profile for the specific trade. Ask yourself a series of critical questions:
1. The Asset's Volatility:
What's the current Average True Range (ATR)? How does it compare to the asset's historical ATR? Higher volatility demands wider stop-losses and potentially smaller position sizes.
Are there any upcoming news events or economic releases that could impact volatility? Factor these in, as they can significantly alter the risk landscape. Be aware of, for instance, earning reports.
2. The Trade Setup:
What's your entry point, and why? Is it based on an explicit technical signal, or are you chasing a move?
Where's your stop-loss, and what is your rationale behind it? Is it placed below a key support level or based on a multiple of the ATR?
What's your target price, and is it realistically achievable given the current market conditions? Avoid setting overly ambitious targets that expose you to unnecessary risk.
3. The Correlation Factor:
How does this asset correlate with other positions in your portfolio? Are you inadvertently increasing your exposure to a specific sector or market trend?
Could a single event trigger losses across multiple positions? Diversification is key, but it requires careful consideration of correlations.
4. The Time Factor:
What's your intended holding period for this trade? The longer the timeframe, the greater the potential for unforeseen events to impact your position.
Does your stop-loss need to be adjusted based on the timeframe? A wider stop-loss than a day trade might be necessary for a swing trade.
5. The "Gut Check":
Are you comfortable with the potential loss on this trade? If the answer is no, it's a red flag. Either reduce your position size or reconsider the trade altogether.
Are you trading based on a well-defined plan, or are emotions driving your decision? Be honest with yourself.
From Profile to Action: Implementing Your Assessment
Once you've answered these questions, you have a clearer picture of the trade's risk profile. Use this information to:
Fine-tune your position size: Ensure it aligns with your pre-determined risk per trade (e.g., 1-2% of your capital).
Set your stop-loss: Place it strategically based on the asset's volatility and your chosen support/resistance levels.
Determine your risk/reward ratio: Is the potential profit worth your risk? Aim for at least a 1:2 or 1:3 risk/reward ratio.
Bonus Tip: Develop Your Risk Score System
Consider creating a simple risk score system to streamline your risk assessment further. Assign points to different risk factors based on their potential impact.
For example, here is the Trade Impact Estimator (T.I.E):
Volatility: Low Volatility (Below Average ATR): +1 point
Average Volatility (Within Average ATR): 0 points
High Volatility (Above Average ATR): -1 point
News Events: Major News Event Scheduled: -2 points
Minor News Event: -1 point
No News Event: +1 Point
Correlation: High Correlation with Existing Positions: -1 point
Low Correlation: +1 point
Timeframe: Day Trade: +1 point
Swing Trade: 0 points
Long-Term Trade: -1 point
Trade setup: Good Risk/reward ratio: +1 point
Neutral Risk/Reward ratio: 0 points
Bad Risk/Reward ratio: -2 points
Set Thresholds:
Total Score of +3 or higher: Potentially a lower-risk trade, consider proceeding as planned.
Total Score between 0 and +2: Proceed cautiously; consider reducing position size.
Total Score of -1 or lower: Re-evaluate the trade, widen your stop-loss, significantly reduce position size, or avoid the trade altogether.
Disclaimer: This is a simplified example. You can customize your risk score system to include additional factors and adjust the point values based on your own trading style and risk tolerance. You can also assign more points to factors that have historically impacted your trading results. It's crucial to backtest and refine your system over time.
The Takeaway
Mastering risk management is a continuous journey. By incorporating a pre-trade risk profile into our routine, we elevate our trading from reactive to proactive. We transform ourselves from gamblers to calculated risk-takers. On TradingView, where information flows ceaselessly, this disciplined approach is not just an advantage; it's a necessity. So, refine your process, stay vigilant, and make your trades profitable.

Example of Interpretation of USDT, USDC, BTC.D, USDT.D
Hello, traders.
If you "Follow", you can always get new information quickly.
Please also click "Boost".
Have a nice day today.
Trading Strategy
-------------------------------------
(USDT 1D chart)
USDT is a stable coin that has a great influence on the coin market.
Therefore, the gap decline of USDT is likely to have a negative impact on the coin market.
Since the gap decline means that funds have flowed out of the coin market, it can be interpreted that funds have currently flowed out through USDT.
(USDC 1D chart)
USDC cannot help but have a lower influence on the coin market than USDT.
The reason is that USDC markets are not operated in all exchanges around the world.
In other words, USDC can be seen as having limitations compared to USDT as an American investment capital.
Therefore, the gap increase of USDT is likely to have a short-term impact on the coin market.
----------------------------------
(BTC.D 1D chart)
You can refer to BTC dominance to choose which side (BTC, Alts) to trade in the coin market.
Since the rise in BTC dominance means that funds are concentrated on BTC, it can be interpreted that Alts are likely to gradually move sideways or show a downward trend.
For this interpretation to be meaningful, USDT dominance must show a downward trend.
(USDT.D 1D chart)
Because the decline in USDT dominance is likely to result in a rise in the coin market.
Therefore, if USDT dominance rises, it may be a good idea to pause all trading and take a look at the situation.
-
You can roughly figure out whether funds are flowing into or out of the coin market with USDT and USDC.
You can roughly figure out which direction the funds in the actual coin market are moving with BTC dominance and USDT dominance.
As I am writing this, BTC dominance is rising and USDT dominance is falling, so it is better to trade BTC rather than Alts.
-
Thank you for reading to the end.
I hope you have a successful trade.
--------------------------------------------------

Example of how to trade without chart analysis
Hello, traders.
If you "Follow", you can always get new information quickly.
Please also click "Boost".
Have a nice day today.
-------------------------------------
Since the coin market can be traded 24 hours a day, 365 days a year, gaps do not occur as often as in the stock market.
(However, gaps may occur frequently in exchanges with low trading volume.)
In any case, I think that these movements provide considerable usefulness in conducting transactions.
Sometimes I told you to buy when the price drops by -10% or more.
Today, I will tell you why.
--------------------------------------
In order to trade, you must have basic knowledge of charts.
Otherwise, you are likely to conduct transactions incorrectly due to volatility.
However, such cases are less common in the coin market than in the stock market.
One of the reasons is that the current coins (tokens) are not being used for actual business purposes.
So, I think there are quite a few issues that cause volatility other than charts like stocks.
-
If the price falls one day and falls by about -10% from the high before a new candle is created, I buy.
The next day, if it falls by about -10% from the high again, I buy again.
When it falls by about -10% like this, I continue to buy in installments.
That's why I need to adjust my investment ratio.
-
If I buy like that, there will come a point where my price rises more than the average unit price.
In that case, when I'm making a profit, I sell the amount corresponding to the purchase principal in installments and leave the number of coins (tokens) corresponding to the profit.
If you want cash profit, you can sell a certain portion in installments.
Also, on the contrary, when it rises by about +10%, we proceed with a split sale.
-
As shown in the example chart, you can see that there are not many cases where it rises by -10% or +10%.
However, since it occurs more often in the case of altcoins than in BTC or ETH, you should pay special attention to adjusting your investment ratio when trading altcoins.
That is why you must check the price fluctuation range 1-3 hours before a new candle is created on the 1D chart.
This method is a method that can be traded even if you lack knowledge about charts.
If you let go of your greed a little and have the ability to split sell when you are making a profit, you will be able to meet the moment when a crisis becomes an opportunity.
-
Thank you for reading to the end.
I hope you have a successful trade.
--------------------------------------------------

Example of how to select a volatility period
Hello, traders.
If you "Follow", you can always get new information quickly.
Please also click "Boost".
Have a nice day today.
-------------------------------------
The date that I am talking about as a volatility period refers to a period in which there may be a movement that may change the trend.
In other words, it means that there is a high possibility of creating a new wave as the volatility period passes.
Basically, the volatility period is expressed as an issue regarding the coin (token) or a global issue, but the volatility period that I am talking about is expressed by the support and resistance points and trend lines drawn on the chart.
-
The support and resistance points refer to the points drawn on the 1M, 1W, and 1D charts.
In other words, they refer to the points of the HA-Low, HA-High, BW(0), BW(100), and OBV indicators displayed on each chart.
When indicating support and resistance points, indicators connected to the current price candle are unconditionally drawn.
Also, indicators that are not expressed up to the current price candle are drawn starting from the one with the longest horizontal line.
Among indicators that are not expressed up to the current candle, horizontal lines expressed less than 5 candles are not drawn if possible.
If there are support and resistance lines that are expressed too closely, the support and resistance lines that are closest to the current candle are used.
-
The StochRSI indicator is used to draw a trend line.
When the StochRSI indicator enters the oversold or overbought zone and reverses, that is, when a peak is created, those points are connected and expressed.
Therefore, the peak created in the 20~80 range of the StochRSI indicator is ignored.
Therefore, the trend line is created by connecting the high and low points of the StochRSI indicator.
However, the high point connection line connects the opening price of the falling candle.
If there is no bearish candle at the peak of the StochRSI indicator, move to the right and use the first bearish candle.
When drawing the trendline for the first time, it is better to draw it from the vicinity where the current wave started.
If the StochRSI indicator has two peaks in the overbought or oversold area, use both when it leaves the overbought or oversold area and then re-enters it.
Otherwise, use only one peak at a time.
-
Draw support and resistance points and trendlines on each chart.
-
Find and mark points where trend lines or support and resistance points intersect at least two times.
The importance is determined in the order of trend lines drawn on the 1M chart > trend lines drawn on the 1W chart > trend lines drawn on the 1D chart.
Therefore, in order to express a period of volatility with a trend line drawn on the 1D chart, there must be at least two intersecting points.
In other words, there must be at least two intersecting points when indicating a period of volatility, such as when trend lines intersect each other or when trend lines intersect support and resistance points.
In addition, support and resistance points are also important in the order of 1M > 1W > 1D charts, so when they intersect with support and resistance points, they are selected according to this importance.
-
Then, if you hide the trend line, you will complete the chart showing the period of volatility.
-
When drawing for the first time,
1. When indicating support and resistance points, if you do not understand the arrangement of candles, it may be difficult to select.
2. It may be difficult to select the peak and candle of the StochRSI indicator.
3. It may be difficult to select which intersection point to select when indicating the volatility period.
Since you cannot get used to everything at once, it is recommended to draw and observe one by one and try to solve the difficulty of the next step once you get used to it.
-
The StochRSI indicator on this chart is an indicator whose formula has been changed from the basic StochRSI indicator.
Therefore, if possible, it is recommended to use the StochRSI indicator on my chart.
If you use your own StochRSI indicator,
Settings: 14, 7, 3, 3 (RSI, Stoch, K, D)
Source value: ohlc4
If you change the values above, it will be expressed similarly.
-
Thank you for reading to the end.
I wish you successful trading.
--------------------------------------------------

What is Bitcoin ‘Pairs Trading’? (Example: ETH/BTC)This is for anybody who wants to sell some Bitcoin but is still bullish crypto. 🚀
It’s also if you’re neutral on crypto but think Bitcoin is overvalued vs other tokens.
It’s also just if you’re just interested to see a way to apply a pairs trading strategy .
In case you’ve been hiding under a rock, Bitcoin just broke over $100k - No more waiting for the HODLRS!!
Naturally after hitting this massive milestone, some traders are going to be thinking about taking profits. And if they’re thinking it, some of them are going to be doing it.
But let’s forget about selling for a moment, are you really buying more BTC when it just hit $100k and it's up ~150% this year?
So even if there is not more active selling interest, there’s probably less buying interest.
I think you’d be mad (or very brave) to bet against Bitcoin. BUT
Are these scenarios possible?
Bitcoin trades sideways for a while after hitting $100k
Alt season kicks in and other cryptos play catchup
If you think yes to at least one of these, my team and me have been looking at a pairs trade
What is pairs trading?
Pairs trading in crypto is a market-neutral trading strategy that involves taking a long position in one cryptocurrency and a short position in another, based on the assumption that their historical price relationship will revert to the mean.
The point is to profit from the relative price movement between the two assets, i.e. not the absolute ups or downs of one asset like Bitcoin.
ETH/BTC
I put this crypto pair this way around - I’m not sure if you’re meant to - it just kind of reminds me of EUR/USD in forex trading.
So as a reminder, ETH/BTC is Ethereum’s token Ether priced in Bitcoin. When Ether outperforms Bitcoin it goes up and when Ether underperforms Bitcoin, it goes down.
So it doesn’t actually matter if Bitcoin goes up, down or sideways, if you’re trading ETH/BTC - what matters is what one does relative to the other.
Well this thing has been going down a lot! Until recently.
Going back to the idea of pairs trading - the thesis here is that the Ethererum/Bitcoin price ratio has dropped to bargain levels and could be about to recover.
I’m not going to lie to you - there are a lot of sore hands out there from trying to catch this falling knife!
But this rebound off the 61.8% Fibonacci retracement of the 2020-21 rally has caught our attention.
Dropping to the daily chart, can you see how 0.4000 has acted like a magnet to the price both from above and below?
0.4 is our line in the sand for long positions.
Equally, our risk is well defined in this setup. A drop back under the 61.8% Fib level around 0.32 means the idea isn’t working and it's time to get out and let Bitcoin do its thing!
How to trade it
Specific entries and exits depend on your personal risk tolerance, but broadly there are THREE methods here:
1. Crypto-to-Crypto Spot Trading
Trade ETH directly for BTC (or vice versa) on a cryptocurrency exchange. This is straightforward and involves holding the actual assets.
2. CFD Trading (Contracts for Difference)
Speculate on ETH/BTC price movements using CFDs without owning the underlying cryptocurrencies. This allows for leverage and the ability to short-sell.
3. Spread Trading
Buy ETH and simultaneously short BTC (or vice versa) with equal dollar value to profit from their relative price movement while minimizing exposure to overall market trends.
But that’s just how we are seeing things?
Do you think this is bananas, or could we be onto something?
Please let us know in the comments
Cheers!
Jasper. Chief Market Analyst, Trading Writers
