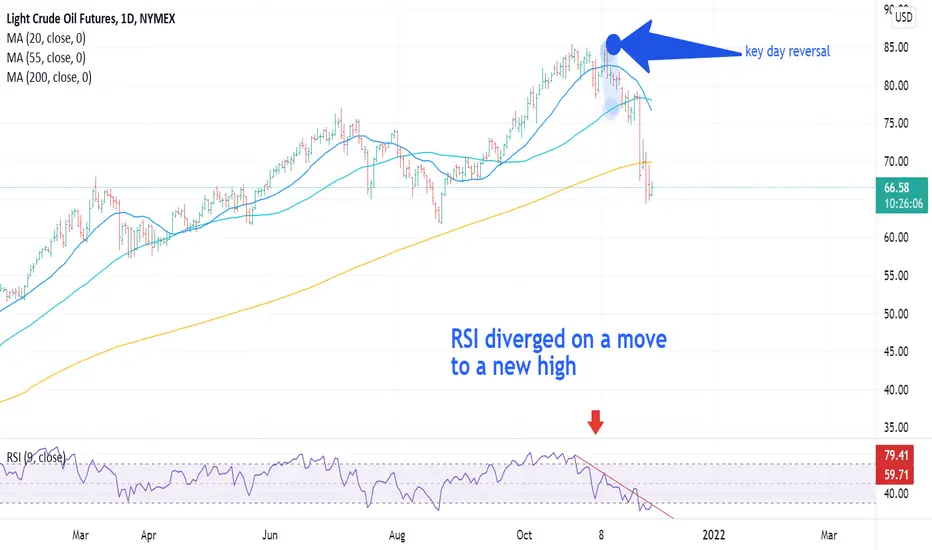
WEEKLY HIGH vs WEEKLY LOW ✅I tried to show you in this example how i use weekly high / weekly low to spot intra-week reversals bearish or bullish.
Just look for a drop below previous weekly low and a bullish confirmation - intra week bullish reversal
Look for a rise above previous weekly high and a bearish confirmation - intra week bearish reversal
Plain and simple, have a great trading week. ✅✅✅
Crude Oil WTI

Commodities - What are they and how do they work?This article is continuation to the series of educational articles on basic fundamentals in regards to particular asset classes.
If you have not read our previous article on stocks, feel welcome to do so:
In order to read the article click on the chart above.
Commodities are basic goods used in commerce that are interchangeable with other goods of the same type. They are usually refined or used for production of other goods. Commodities can be traded privately or on public market exchange where they must meet specified minimum standards like quality, weight, type, etc. They are great speculative investments which tend to be ruled by cycles and interaction between supply and demand.
Classification of commodities
In order to distinguish between particular characteristics of each group, commodities can be categorized according to their type and origin. Commodities that are mined or extracted are called hard commodities (oil, gold, silver, etc.) while commodities that are grown are called soft commodities (wheat, rice, livestock, etc.). Though, commodities can be sorted even further into smaller sub-categories. For example, metals can be divided into industrial metals (copper, nickel, iron, etc.) and precious metals (silver, gold and platinum). Additionally, the agricultural sector can be divided into livestock and grains; and the energy sector can be divided into oil, coal and natural gas. Other commodity sectors can be subcategorized in the similar fashion.
Raw materials
Primary commodities which are unprocessed and serve as input for production of other goods are also called raw materials. Raw materials involve, for example, crude oil, copper, iron, wheat and corn.
Commodities exchanges include:
Asia Pacific Exchange (APEX) - Singapore
Chicago Board of Trade (CBOT) - United States
Chicago Mercantile Exchange (CME) - United States
Dalian Commodity Exchange (DCE) - China
London Metal Exchange (LME) - United Kingdom
National Commodity Exchange Limited (NCEL) - United States
New York Mercantile Exchange (NYMEX) - United States
Shanghai Gold Exchange (SGEX) - China
Correlation
Some commodities tend to show correlation with other assets. Such correlation can be positive or negative. Positive correlation means that two assets behave in a similar way. For example, when gold rises then mining stocks rise as well. Contrary to that, negative correlation describes such behavior in which assets move in the opposite direction to each other. For example, when USD/EUR rises then gold in USD tends to decline.
Illustration 1.01
Illustration above shows the monthly chart of USOIL. It also shows USDEUR (orange line). Negative correlation between these two assets is observable. When USDEUR falls then USOIL tends to rise.
Participants, spot market and derivatives market
Commodities are great anti-inflationary assets which are often sought by producers and speculators alike. Producers tend to use commodities with purpose to hedge their risk; furthermore, they often demand delivery of physical goods. Speculators, instead, try to exploit volatile price movements in commodities with the goal to profit from it. Commodities can be bought and sold through the spot market or derivatives market. Spot market simply means buying or selling cash positions while derivatives market involves investing in futures, options, ETFs, etc.
Seasonality
Some commodities are prone to seasonal cycles which means that they tend to show the same or very similar behavior based on a particular calendar season. For example, in some countries, production of a certain crop may vary during the wet season and drought season. Similarly, heating prices tend to increase during the harsh winter as opposed to during the hot summer. Concept of seasonality is also applicable to commercial and industrial trends.
DISCLAIMER: This content serves solely educational purposes.

as predict before oil reach fibo 61% now gold can crash down or go upper , so pick sell near fibo 61% is good idea but with sl=78.80 and trailstop=0.80
if oil can break 73.80 can start new + trend to fibo 161% near 100$ so never remove SL

What you trade is just as important as how you trade!Hey Traders!
WOW! What a Monday! Excellent moves in the markets today at the US open, I don't want to sound like I am bragging, but we kinda prepared ourselves very well for today by working our asses off on creating our watchlist, we knew what could be moving and we made sure that they focused on the best setups, setups that had the highest rewards and the lowest risks!
Aside from a big miss on WTI, we aced EURUSD, NASDAQ, DAX and EURJPY.
Preparation of a watchlist is vital for us day traders and we make sure to invest time into creating our day trading watchlists!
This video explains a little better what we did to make today a BIG SUCCESS for ourselves and our members!

My rules for Reversal Watch CriteriaA couple of weeks ago I noticed the front page of the Economist publication, which had a front-page title – ‘The energy shock’ and it reminded me that market psychology plays a huge part as one of my reversal watch criteria. After all once a market starts moving a lot and grabbing more headlines, more and more people jump on that trend and once it gets to the front page of newspapers or publications, like The Economist, it is generally a good indication that a move is either at or very near the end of its move.
I have for many years worked on the trading floor of several large banks and have always found this to be a good indication of market in general. A few years ago I had a strong view on the fixed income markets as I had noted that the US 10Y yield had reached my long term downside target. I duly went off to tell the traders that the market had got to its target and they might like to think about covering their long positions on Fixed Income futures and not only was NO-ONE interested in hearing my view they simply told me to get lost – they had made money all year being long fixed income futures.
So, I went and sat back down and thought hang on if all these guys are already long, who is left to buy? Within a couple of days the market had turned lower very quickly with absolutely no new news or any fundamental reason that I could determine.
This is something I have observed over the many years in the business. But it does kind of makes sense as well, for a market to go up aggressively it takes a lot of buying and if most people have already bought who is there left to buy? For a market to go down, it does not have to be a change in fundamentals, it can just be a lack of buying….
So, if one of my reversal watch criteria is market psychology what are the other criteria?
1. The market is approaching a significant target area
2. The market is over-stretched or runaway ahead of target
3. We have heightened intraday volatility
4. We have Newspaper articles
5. All dealers/articles/people you speak to have the same view
We saw these conditions met recently on the Oil market. It is always extremely hard to cut a position that you are making money in and it helps when you have a list of criteria that you can watch. Once these criteria start to be met, it is a good idea to tighten up stops and think about lightening a position.
Disclaimer:
The information posted on Trading View is for informative purposes and is not intended to constitute advice in any form, including but not limited to investment, accounting, tax, legal or regulatory advice. The information therefore has no regard to the specific investment objectives, financial situation or particular needs of any specific recipient. Opinions expressed are our current opinions as of the date appearing on Trading View only. All illustrations, forecasts or hypothetical data are for illustrative purposes only. The Society of Technical Analysts Ltd does not make representation that the information provided is appropriate for use in all jurisdictions or by all Investors or other potential Investors. Parties are therefore responsible for compliance with applicable local laws and regulations. The Society of Technical Analysts will not be held liable for any loss or damage resulting directly or indirectly from the use of any information on this site.
If you think technical analysis does not work, look at this!I published this analysis on October 18, 2021.
Today, you can see it hit the target zone!
If you have no time to learn different tools in technical analysis, at least do yourself a favor and learn how to use regression channels!
However, Regression channels are not pure technical analysis!
It is actually a statistical tool..!
Most quant funds use statistical models to open and close their position..!
The most famous model is mean reversion!
What Is Regression?
Regression is a statistical method used in finance, investing, and other disciplines that attempt to determine the strength and character of the relationship between one dependent variable (usually denoted by Y) and a series of other variables (known as independent variables).
Now, let's consider Y=Price and X=Time!
Now, you should do the math..! But do not forget we have different types of regression models: Quadratic, Qubic, Sinusoidal, and logistic...etc.
Look at these examples:
Bitcoin:
Solana:
NFLX:
USOIL:

Education excerpt: OPECThe Organization of the Petroleum Exporting Countries (OPEC)
The Organization of the Petroleum Exporting Countries (OPEC) is a permanent intergovernmental organization with main goal to coordinate and unify the petroleum policies of its member countries. This pertains mainly to securing fair and stable pricing in the oil market; efficient and regular supply of petroleum to consuming nations and fair return on capital to the producing countries.
The OPEC was established in Baghdad, Iraq in 1960 by five countries. Founding countries were: Iraq, Islamic Republic of Iran, Kuwait, Saudi Arabia and Venezuela. One year later the organization was joined by Qatar in 1961. After that Indonesia and Libya followed in 1962. United Arab Emirates joined the cartel in 1967 and Algeria in 1969. Then Nigeria became member of the OPEC in 1971, Ecuador in 1973 and Gabon in 1975. Few decades later, Angola joined the OPEC in 2007, Equatorial Guinea in 2017 and Congo in 2018.
Ecuador suspended its membership in 1962. However, it rejoined the cartel in 2007. But then again in 2009 Ecuador withdrew its membership from OPEC. Similarly, Indonesia suspended its membership in 2009 and rejoined the cartel in 2016 only to leave it again in 2016. Gabon also suspended its membership in 1995. Although, Gabon reactivated its membership in 2016. Qatar was the last country to terminate its membership in 2019.
Current members:
1. Iraq
2. Iran
3. Kuwait
4. Saudi Arabia
5. Venezuela
6. Libya
7. United Arab Emirates
8. Algeria
9. Nigeria
10. Gabon
11. Angola
12. Equatorial Guinea
13. Congo
The OPEC's executive organ is called the Secretariat and it is run by the Secretary General. Secretariat was originally established in 1961. It also functions as headquarters for the organization. In the beginning, OPEC had its headquarters in Geneva, Switzerland for five years. However, OPEC's headquarters were moved to Vienna, Austria in 1965. Executive organ is responsible for implementation of all resolutions passed by the Conference. Secretariat also conducts research and fullfills all decisions made by the Board of Governeros.
The Secretary General is the representative of the OPEC who simultaneously acts as Executive of the Secretariat. The Secretary General is electable role and its term last three years. Although, there is possibility to renew this term once. The Secretary General is assisted by the Office of the Secretary general and several other officers and staff members of the OPEC. The Office of the Secretary general helps the executive chief of the Secretariat to maintain efficient relations with relevant international organizations and governments. Another important organ of the organization is the Legal Office which supervises legal matters of the Secretariat and provides legal advice to the Secretary General. In addition to that, there is also the Research Division that consists of three departments: Data Services, Energy Studies and Petroleum Studies. The Research Division is responsible for conducting research with regards to the energy and related matters. Infrastructure and services are provided by the Support Services Division.
OPEC Fund
The OPEC Fund for International Development is international finance development institution that was established in 1976. It consists of 12 members: Algeria, Ecuador, Gabon, Indonesia, IR Iran, Iraq, Kuwait, Libya, Nigeria, Saudi Arabia, the United Arab Emirates and Venezuela. Its purpose is to provide financial help to the developing countries and support advancement in these low-income and middle-income countries.
Disclaimer: This content serves solely educational purpose.

Today’s Notable Sentiment ShiftsHigh-Beta – AUD, CAD and NZD benefited from rising commodity prices on Tuesday, as markets set aside concerns about the spread of the Delta coronavirus variant. The notable outperformer in the commodities complex was oil prices, with WTI approaching $68 per barrel, up almost $2.50/+3% on the day.
Indeed, following today’s strong performance in WTI, TD Securities noted that: “With the impact on demand fueling chatter that OPEC+’s next monthly output hike could be delayed, and China’s “Zero-Covid” strategy appearing to have quickly contained the outbreak, crude oil could once again have a solid footing to challenge the $70s.”

Methodology overview & how we determine entries & exits (part 3)Hello.
Here is a quick 4-min video which mentions 3 indicators I have been using for many years.
- A modified ADX
- A short-term momentum indicator (it is not the Momentum Indicator... instead, it gives us the current momentum)
- A mid-term momentum indicator
This methodology includes other indicators but this video features those 3 indicators.
Thanks.
F. Normandeau

Crude Oil Spreads: A Quick Intro.Spreads are complex instruments. This is just an introduction and some ideas to get our brains ticking over. I had started writing a guide to understanding these three types of spreads, but it just got a little long. It might be easier to do it this way:
What do you see above?
Here are some observations to get started:
1
All spreads topped out well before June Crude Oil topped out. From about 17th Feb, those spreads stopped gaining. Could spreads be a way to take a contrary position as a trend exhausts itself, and have a little room for error? It certainly is here (although not always the case).
2
Look at the ATR for each. Spreads show lower volatility.
3
Correlations (the CC shows the spread correlation to the underlying June contract). Correlations seem strong during a trend then do their own thing at other times. Change creates opportunity. Constant correlations are not as fun.
4
Basic spreads: bull and bears – are directional. That is, they move closely with the underlying. More complex spreads, like the fly and condor seem to be suited to shifting sentiment along the forward curve.
5
Flies and condors are very similar. The condor tends to have a little more volatility than the fly. In this case, it’s not much.
-
It can be a complex subject, worthy of something closer to a book, than a comment here, but it’s a start.
Just a warning – going down the spread trading path might change everything.
-
A couple of futures markets where flies and condors are often traded: Crude, Natural Gas, Grains, Eurodollars (and most other STIRs). Options - that's a totally different chat....

You Can't Predict Which Trade Will Succeed. How To Deal?This is why I prefer to open many small positions - you never know which one will be successful!
---
How to understand price action.
It is very easy to read price action if you have a reference point. These support/resistance lines are there to help you read where the buyers and sellers are likely to make a stand.
You can also think of these indicators as moving pivot points .
MasterChartsTrading Price Action Indicators show good price levels to enter or exit a trade.
The Blue indicator line serves as a Bullish Trend setter.
If your instrument closes above the Blue line, we think about going Long (buying).
For commodities and Forex, when your trading instrument closes below the Red line, we think about Shorting (selling).
For Stocks, I prefer to use the Yellow line as my Bearish Trend setter (on Daily charts ). A stock has to close below the Yellow line first, then rally towards the Red line and top out there. This is where I would short it.
Be sure to hit that Follow button! Please find me on social networks via the link on my profile page for more ideas from @MasterCharts!

OIL (VIDEO IDEA UPDATED) - AMAZING RESULT Last night video idea ended up being a HUGE success.
Oil did drop up to 6% at some point and closed the day at a 4% minus!
Take a look at yesterday's video and notice how the price of Oil did drop indeed and how it rebounded and stopped at our previous support which now became a resistance.
Technical analysis for a seminar!


Btcoin to be pumped by NI225 MTH ATH's, SPX, TNX, & WTI Like the last QTR of 2017 Btcoin to be pumped by NI225 MTH ATH's, SPX, TNX, & WTI NOT ADVICE DYOR

Bitcoin set to smash ATH in the next 8 to 12 WKS thanks to......Astronomical returns possible: Bitcoin set to smash ATH in the next 8 to 12 WKS thanks to "Big Oil" signal after SPX setting ATH's >> WK 16 DEC 19 63% 8 WKS >> WK 25 SEPT 18 437% 11 WKS >> WK 28 JAN 13 1383% 10 WKS. The only time signal did not work was when bitcoin MACD histogram was in red. CAVEAT: WTI Crude Oil Weekly MACD line (source HIGH) has not yet closed >0. Big Oil signal still needs to confirm. NOT ADVICE. DYOR.

To the rescue 17yr Cycle reveals post COVID19 futureTo the rescue 17yr Cycle reveals: bull market in SPX Gold WTI & bounce in TNX & bear market in USDCHF & DXY. Importantly on 3 occasions no change in DXY after 39 WKS. NOT ADVICE. DYOR

Bitcoin just closed WK above $10,491 is "Big Oil" about to pumpBitcoin just closed WK above $10,491 is "Big Oil" about to pump. NOT ADVICE. DYOR.
June 13 posted - Bitcoin loves "Big Oil" 1,2,3,4 will it be different this time

CRUDE OIL (WTI) Weakening Market & Consolidation
Crude oil is becoming weaker and weaker.
though many fundamentalists promised a quick return to "normal" price levels after the lockdown removal,
it looks like things are much more complicated than that.
if you are a swing trader and you are looking for an opportunity to jump in in the market,
I guess it is not the best moment.
for the entire month, we could not set a new high.
ATR drops as crazy and volatility is missing:)
let the market start moving.
let it pick the direction and then just act accordingly.
swaps are now very expensive on oil, so no need to incur these losses.

If BTC is Steady, We Are Steady in Small Caps BoiCheck out the latest blog post for more boi:
www.derzzycharts.com
Same deal, short weakness, buy strength. When BTC is giving the market room to breath, we own altcoins. It works every time. We don’t need to know why, we just know that it does. So what did we do today? We looked at the top 500 coins, and picked some charts to buy. Let’s have a look.
Here we have WTCUSDT and FTMUSDT. You don’t even need to know what they are, just that they have strong charts. That is the beauty of technical analysis, it could be anything! It could be corn, it could be soybeans, it could be any altcoin out there. If the chart looks good, we put in an order. We bought WTCUSDT earlier, but we are waiting for the pullback in FTMUSDT. So how did we pick these out of all of the charts? Good question… well we didn’t want bearish divergences on the RSI, we wanted a good cloud, and a MACD that had room to run. A lot of coins have pumped, but you don’t want to hold bags in crypto. So you have to pick positive charts. Don’t chase bro!
For a look at the indicators and the decisions, see the linked post.
Happy Trading!
Brandon Anderson
brandon@derzzycharts.com
@derzzycharts
www.derzzycharts.com

What Do You Say? Drop or Top?Got 3 Points in PIC
What do you mean?
Drop to one of them or get up?
You can also Follow and Copy me at ETORO (ProfitSearcher)


Brent Crude Updated Map - More Down 32.90/29.70Current consolidation is a classic flat within double three WXY (white labels).
Which is in its turn is the wave ((X)) of the larger yellow degree - the junction between ((W)) and ((Y)).
After it gets completed another drop would follow to hit the blue box between 32.90 (38.2% Fib) and 29.70 (50% Fib).
