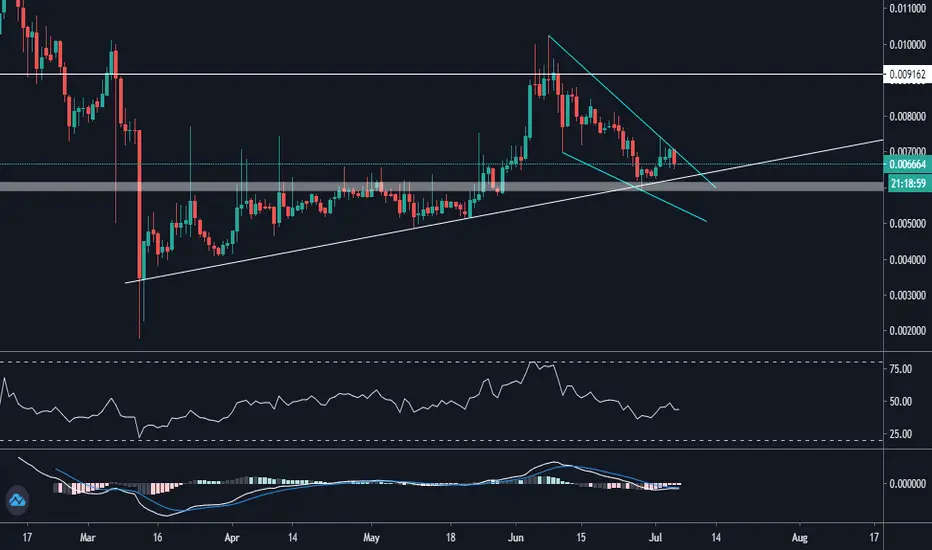
Let's See The Power of Triple BottomThere is a MainNet and it planned to launch until 15 December 2020!
Stacks 2.0 is coming at the same time as MainNet. Stakers will earn BTC while stacking STX after Stacks 2.0. You can confirm it from Blockstack's official announcements.
Now, let's look at the chart. I'm observing triple bottom formation. Also STX in oversold zone. Indicators which in oversold zone are Bollinger Bands %B , Relative Momentum Index, Relative Strength Index.
My discourses, my analysis and my drawings are definitely not investment recommendations. Cryptocurrency trading involves high market risk. Please take care of your transactions. My analysis is for educational purposes, I am not responsible for your losses.
Wedge

AUDNZDAUDNZD is still following our previous analysis. The best thing about swing trading is that you can add more entries as the price retraces.

SOYBEAN Higher Time Frame Outlook on structureHello traders:
Looking at soybeans from the higher time frame perspective and its price action structures.
We see strong bearish impulse down from mid of 2018, and has been in this larger channel like structure ever since.
Price has been consolidating for these few years, and finally breaking to the top in the recent times.
What I like about the price from a structure point of view is that we just broke the previous top, but on the lower time frame the price broke up in a corrective structure.
I see this type of price action over and over again. Price breaks up, catching a lot of buyers, then see a strong sell momentum down.
I wouldn't be surprise to see some bearish impulse from the lower time frame, to bring the price right back into this larger channel structure, and we can potentially see the next bearish move from the top.
For now, happy to be a bit more patient, and wait for price to develop a bit more.
thank you

What is a pennant?A pennant is a continuation pattern.
Statistics of pennant patterns
- In 75% of cases: a pennant’s continues in the same direction.
- In 15% of cases: a pennant’s continues tries to continue in the same direction but pulls back.
- In 55% of cases, a pennant continues in the same direction and reaches his target.
Notes on pennant patterns
- pennants with a narrow base perform better
- A pennant is stronger if there are no false breaks (false pattern exits).
- If their are pullbacks after exit from the pennant: its bad for its performance.

Rising Wedge - "Learn More Earn More" with usWhat makes the chart interesting today is that:
. BTCUSD challenging the Wedge's UpTrend.
. A break bellow Wedge's UpTrend could push the pair to its $10,400 ~ $10,500 previous support areas.
. A rejection at the Wedge's UpTrend, however, could lead to another retest of the Wedge's top.
Will the BTC see an downside breakout against the USD?
No one knows it! We have to wait and see!
Learn More,
Earn More,
With ForecastCity!

Rising Wedge - "Learn More Earn More" with usWhat makes the chart interesting today is that:
BTCUSD challenging the Wedge's UpTrend.
A break bellow Wedge's UpTrend could push the pair to its $10,400 ~ $10,500 previous support areas.
A rejection at the Wedge's UpTrend, however, could lead to another retest of the Wedge's top.
Will the BTC see an downside breakout against the USD?
No one knows it! We have to wait and see!
Learn More,
Earn More,
With ForecastCity!

How To Trade a Falling Wedge Chart Pattern - Educational PostIn the above example you can see a continuation chart pattern.
After a strong rally, price start to reverse and formed a falling wedge.
How to trade the falling wedge?
1. Wait for a breakout.
2. Enter at the retest of the breakout.
3. Set your stop-loss bellow the market structure.
4. Set your target at the higher high of the falling wedge.
This tutorial contains educational material.
Please hit the LIKE button to support me!
FOLLOW ME if you liked this post and want to see more educational post and trading ideas.
Thank you!

GBPCHF Trade Analysis & Review Hello everyone:
Here is a quick trade analysis and review video on my recent GBPCHF trade.
What is my thought process behind executing a position, and the management follow after it.
Thank you

Binance Hot list coin July, 8th 2020 : XRPUSDT #1A simple deduction of current price action and the chart pattern of ripple. With the structure of bullish falling wedge pattern, there is a possibility of the price to moves up higher and challenge each fib levels especially the golden pocket as a strong resistance. The fact that there is a bullish divergence on RSI and MACD making this structure is very interesting. The key movement is to breaks out of the white resistance trend line and the upper line of this falling wedge.

Binance Hot list coin July, 7th 2020 : ONGUSDT #3This coin is worth to see, some confluence reasons to go long is strong enough with current bullish structure. The price is now trending slightly above the yellow support trend line which has held the price since June 15th. Another side is that the price is now forming a bullish falling wedge which usually will shows us some sort of bounce in near future. Entry buy when the price breaks above the upper line of the wedges.

Binance Hot list coin July, 6th 2020 : KNCUSDT #2On the 2 hours chart, the price is trending slightly above the 55 EMA which acts as a strong dynamic support (yellow). Beside that the price is now forming a strong bullish falling wedges. This is however could be the action to complete ABC zig zag correction structure. I will only catch the B wave which align with the golden pocket zone as well before shorting the C wave. Just like usual, open long position when the price breaks out of the upper line of the falling wedges.

Binance Hot list coin July, 6th 2020 : TCTUSDT #1TCT is trending slightly above the strong support which has the alignment with the white support trend line. Currently it's forming a falling wedges pattern which usually ends up breaking out toward the upside. All we have to wait is when the price breaks out of the upper line of the wedges and targeting the swing high as usual. This set up will be invalidated if the price breaks down below the white support trend line.
🏋️ 10 STEPS HOW TO DRAW TREND LINE IN 5 MINUTES [WRX — WazirX]Hello, have you familiar with 10 steps technic how to draw trend line in 5 minutes?!
— I am not 😅
But in this 7 min video I explained how to make Simple TA for any asset using TradingView basic tools to understand where it goes.
In this video:
1. How to draw trend line
2. Descending Wedge (Falling Wedge)
3. WazirX WRXBTC coin analysis, entries and targets.
Previous WRX analysis and HOW TO MAKE TA in 10 min:
Have fun, enjoy your trading
This is Artem Crypto

Why I decided to change my trading style and method after years Why I decided to change my trading style and method after years:
First of all, I am not here to bash and talk negative on other traders who are consistent traders who do use these methods to their success.
I am sharing my on personal journey and opinions, based on past experiences and past journal/history.
By no mean I am saying my current style or strategies are better. I am creating this post for educational purpose only, no offense/criticize is done here to anymore.
1. I actually used to trade with S/R, supply/demand zone, and small number of indicators (MACD, EMA, RSI...etc), you can look back at my tradingview post years ago.
2. I have been somewhat consistent with those strategies and methods, and do generate profits within the years that I have adapted those type of strategies.
3. The time when I decided not to implement those methods anymore, is because when I back test and look back at my trading journals and history, I find out ways that I could improve my trading potential.
4. I realized many of these S/R, indicators are actually acting as an invisible barrier for me when I trade.
5. Many of my trades in the past have been short lived due to me sticking to my trading plan and exit a trade when the price hits a certain "criteria" such as 50 EMA, some S/R zone, or fibs level...etc..
6. While its good to follow and stick to my trading plan and risk management, but when I do self reviews on past trades, I begin to find out there is a lot of profit I am leaving on the table.
Or, poor trade management due to similar issues.
7. I begin to do in depth research on these topics and come to my personal conclusion.
8. The true is, I dont need any of those indicators and S/R level/zones on my chart. Simply remove all of them and see how the price is on a raw level.
9. I fully understand when the price is in its impulsive phrase, none of these indicators or levels can "resist" or "support" the price. The price simply breaks them or "impulse" through them.
When the price is in its corrective phrase, this is when those levels or indicators work since price is in a correction nature and allowing those levels or indicators to "catch up" to the price.
10. When I dig deeper and more research and analysis, I begin to see the market on a totally different level. I realized how the market moves, and why it moves.
11. There is a saying, "Dont just believe what the others are telling you", or "Try it yourself before saying it out loud". I certainly put in time and effort into this and have done substantial amount of work to be confidence to express here.
I hope this brief post is helpful for those traders who are still trying to identify how to trade and what to adapt in their trading plan. I welcome any positive/constructive comments, feedback, suggestions or opinions.
Thank you

RISING AND FALLING WEDGES
Good afternoon.
Today we are looking at another chart pattern
RISING AND FALLING WEDGES .
Let’s get on it.
Wedges can either be continuation or reversal patterns.
Just to refresh your memory, continuation patterns are formations that show side way price action, signalling a temporary pause in the trend; whereas reversal patterns indicate a change in the trend.
Whether wedges are continuation or reversal, it’s not really significant, what matters is spotting the pattern, and knowing how to make money out of it.
Wedge patterns are classified as either RISING WEDGES OR FALLING WEDGES.
Rising wedges, as the name implies, slopes upwards, and they eventually break to the downside
Graphically, rising wedges look like the above sketch chart(Sketch 1)
notice how the slope of the support line is steeper than that of the resistance.
This indicates that higher lows are being formed faster than higher highs. That is precisely how the wedge pattern get to be formed.
The inverse of the rising wedge is the FALLING WEDGE , which usually breaks to the upside.(Sketch 2)
Just like on the rising wedge pattern, the falling trend line connecting the highs (resistance) is steeper than the trend line connecting the lows (support).
As mentioned earlier, rising and falling wedges can either be continuation or reversal patterns.
But whether they be continuation or reversal patterns is not our focus, our focus is on making money when these patterns ‘BREAKOUT’ .
If you case you are wondering what we mean by ‘breakout’; consider the chart above(Sketch 3) of a falling wedge and a rising wedge, and how they typically break to the upside and downside, respectively
Now let’s look at how we can make money out of a RISING WEDGE PATTERN.
Let’s start by considering the chart (Sketch 4)
Now, when entering a Short trade based on a rising wedge, it’s important to wait for a break and close below the support line.
After this close, aggressive traders can ‘pull the trigger’.
But a more conservative way to enter the trade, is to wait for a retest of the previous support (now resistance) before pulling the trigger.
In this case the sequence will be something like this:
1. Wait for a close below support
2. Wait for a retest of the previous support
3. If the previous support act as resistance, then enter short trade
A Long trade based on a falling wedge is entered on the same principle (but in reverse), that is,
1. Wait for a price close above resistance
2. Enter Long trade at that close (for aggressive traders)
3. For conservative traders, wait for a retest of the previous resistance (now support) before pulling the trigger
That’s ENTRY, now let’s look at placing stop loss and take profit levels when trading wedge patterns.
Take profit target should ideally be the height of the wedge formation.
Consider the chart above(Sketch 4)
Stop loss orders should always be placed at a level that if hit, it will invalidate the trading set up.
In the case of rising wedges, this level will be the area just above resistance.
The opposite is true for falling wedges, place stop loss just below support.
Thanks for your Likes and Support....
Until next time, let’s keep if Profitable!

btcusd log chart from start in 2001-2002 projected into 2050This is a btcusd log chart from when I think btc started to where it may go by 2050

EURUSD | Falling Wedge & Trend Line...!!EURUSD (Update)
In 4h Chart, EURO Has been forming Falling Wedge Pattern.
At the Moment, It's Heading towards the Major Trendline. (Still in Uptrend)
Now There Are Two Possible Scenarios...!!
1- If Trendline Broken Down, It Might test the 1.102** (Fib 38.2%) Area.
2- If Bulls Hold the Trendline, & Bounced Back, Expecting Wedge Breakout.
In Case of Wedge Breakout, EURO Might test the 1.138** Area (Major Resistance)
So Be Ready for Both Bearish & Bullish Scenarios..!!
Please like the idea for Support & Subscribe for More ideas like this and share your ideas and charts in Comments Section..!!
Thanks for Your Love & Support..!

Update to simple analysis Possible buy seeing we in some sort of trend / pattern .. seeing I was right about the drop let's see if the rise shall come seeing a smaller pattern in the H1, if it continues good if it reverses from here you know what to do

Bitcoin | Halving FOMO & Wedge Formation..!!BTC/USD (Update)
Bitcoin Has been doing Awesome Job since 12th March Crash, Majority Were Waiting for 1k Dip & Missed it.
At the Moment, Bitcoin Has Recovered up to 140% Since 3.8k Dip/Bottom.
It's Been Breaking the Every Single Resistance one by one & Liquidating the Bears .
In Bigger Chart, It's Following the Expending Wedge Pattern & Now Heading towards the Major Resistance (9.6k)
Yesterday, Bulls Did Great Job & in Strength (That's the Real Halving fomo, We're Waiting for)
I Hope You Guys Enjoying the Bitcoin Ride & We're too Closer to Bitcoin Halving ( Almost 12 Days Away)
Please like the idea for Support & Subscribe for More ideas like this and share your ideas and charts in Comments Section..!!
Thanks for Your Love & Support..!

Judge the price action momentum - rising wedge pattern and RSIThere are a number of ways to judge the price action momentum. In the previous post, I show you using trend channel as an alternative to up wave or upward thrust to gauge the buying or selling momentum.
In this video, I also adopt the same example S&P 500 futures ( CME_MINI:ES1! ) to show you using the popular pattern - rising wedge and RSI indicator to achieve the same objective.
Yet, what I would like to emphasize is to understand the rationale behind the pattern and the indicator, which we can always go back to the first principle to find out, i.e. why a rising wedge is bearish in nature or what bearish divergence in RSI actually means?
Once you understand the rationale or the first principle about the price action momentum, you can start trading without memorizing every single pattern or indicator if you prefer.

Gold | Expanding Wedge & Key Support..!!#XAUUSD (Update)
Forming Expanding wedge Pattern & Trying for Breakout in 4h Chart.
In Case of Breakout, It Could Test 1750$ Resistance.
If Failed to Breakout, then It Might Retest the 1640$ Support.
I'm Expecting Support (1640) Retest Before Breakout..!!
Please like the idea for Support & Subscribe for More ideas like this and share your ideas and charts in Comments Section..!!
Thanks for Your Love & Support.. !

NZDUSD Aloha, welcome to the new week!
Wanted to share a tip that has helped me save money and kept my psychology sane:
Let the market develop for the first few hours before placing a trade. Reason being is spreads are usually steep and the market can be volatile and choppy.
NZDUSD was on my watch at the end of last week and my last analysis shows that I would be going long on this trade, however, applying a the rule of "let the market decide in the first 4-5 hours", minimum, has saved me from a quick loss of -1% on this trade and countless others trades.
I like the 15min wedge for a continuation, the 50ema on 4hr, 1hr, and 15min all support my thoughs of going long. However, The daily is stil developing to either break above the 50 or reject it and have a
crash.
Any way, hope this in your trading journey!
Stay patient and wait for your strategy to play out, no need to rush it! Mahalo for reading, happy trading all!

How to use trend channel to judge the price action momentumIn this video, I use S&P 500 futures CME_MINI:ES1! as an example to show you using trend channel to judge the price action momentum. At the later part of the video, I also show the use of upward thrust, and the up wave on top of the channel to judge the momentum.
It is important to assess the price action momentum of any trading instruments (i.e. stocks, Forex, futures, bond, bitcoin, etc…). If there is a fading of momentum, this is the first sign of weakness to pay attention to before we start to anticipate a change of character, e.g. a down-wave to at least stopping the uptrend, if not reversing the trend immediately.
Having said that, do not get misled that if we see loss of momentum of the trading instruments, we need to get bearish to short, simply because this is only a red flag for us to anticipate potential weakness ahead. And it will take time to materialize.
As long as we have a structure with higher high and higher low, the up trend is still intact.
