"rising wedge" with VWAP for supportReference/training*
not an ideal situation. Example here is to demonstrate consequences of low volume at support area. ( horizontal, Vwap, MA, EMA etc)
Background was late into an uptrend
High volume points located into higher prices creating rejection
Test at VWAP returns highly diminished strength/demand.
Tricky fake out attempt back into trading range with subsequently violent rejection back out.
If you are having issues interpreting volume, think of it as peaks and valleys.
Vally at support is generally a weak support
Vally at resistance is generally a weak resistance.
Wedge

Ascending wedge in Bull market situationBroadening Ascending wedge in Bull market situation. If price does not reach the trendline and after rotation to short it will create partial rise, trade/buy on the breakout of previous high.

EURAUD Entry On A Retest - Wedge PatternEURAUD price broke diagonal wedge support. Diagonal support line now becomes diagonal resistance because price broke and closed below the diagonal level.
WAIT FOR THE RETEST OF THE DIAGONAL LEVEL.
Enter on the retest at level 1.63084 with a market execution order or sell limit order. Exit at the next horizontal support resistance line for Take Profit. Exit at 1.61072.
Note: There is confluence when diagonal support resistance line intersects with horizontal support resistance line. A higher probability trade set up for the wedge pattern in using "intersections."

Dominance : Elliot wave perspective and road map to 50%Hello Fellas, Happy Monday and I hope that this week could be the a better week for another trading journal for all of you. Current bitcoin movement is still in play with my previous analysis and perspective, beside bitcoin is still moving in the consolidation area whether it is on short term or long term perspective. That's why a few days ahead i will be more concern with the dominance and market capitalization of this crypto industry. I will frequently give you an update about this highlighted factor that keep the crypto space on its balance. Here we start the analysis!
So, on this chart, I try to make a long term projection for the bitcoin dominance possible movement in the future. Remember that you don't have to be worry even if the bitcoin dominance will melt however to lower level or bitcoin itself which will decrease value a lot lower than current level. The decreasing of bitcoin dominance will become another stepping stone of bitcoin's future. The decreasing in bitcoin dominance will make the crypto space more healthier and the money inflow in this industry will spread out evenly between 1 coin to another. This thing especially will indicate a decrease of manipulative number, even for the institutional level, it will be harder to manipulate the price of crypto. More evenly the fund distributed, more healthier this market will be.
I see that the current movement of bitcoin'd dominance will melt however to lower level. I see a losing momentum as well on current level of dominance. Based on the technical analysis, it looks like the previously bullish falling wedges could be the first leading diagonal on higher structure. I expect an ABC zig za corrective wave to the down side and I expect the dominance will stay at around 50% level. It has a lot of reason for the dominance to be at those level.
Thank you and enjoy your Monday.

The Insider and systematic dumpHello fellas, here is my opinion about bitcoin based on the dominance side of the crypto market. I hope you enjoy this technical analysis!
The daily chart for Bitcoin dominance shows that Bitcoin is fighting hard to retain its dominance of the cryptocurrency market. Recently, Bitcoin dominance broke out of a falling wedge and found temporary support on the 50% fib retracement level. However, I believe that this level won't hold from further decline. traders need to be very careful here as this is not the time to be bullish.
It is premature to say that this move to the upside has come to an end. We are certain that a decline is going to follow sooner or later but short term further manipulation could be around the corner. We recently saw Bitcoin pump by more than 43% in two days. There have been times when we have seen similar pumps in the altcoin market follow soon after. I wouldn’t discount the possibility that this could be one of those times which is why it is not a good idea to be short on the altcoin market just yet. However, despite what happens short term, Bitcoin is ready to decline below $8,000 and it could happen in a matter of days.
The cryptocurrency market is in trouble and insiders have known this for a long time. They have been dumping systemically but as more and more retail investors begin to catch up with what is really happening, they are now in a rush to get out of their positions. This is why we have seen such naked manipulation in the past few days that shook out most of the retail bears and got the bulls really excited. The bulls are still quite excited and expecting further. The Fear and Greed Index is still in the neutral zone but traders could soon get even more optimistic with another fake out. In my opinion, it is very likely that we might see another fake out near term

Triangles are awesome: a great exampleHello, I just posted an idea on why I don't like taking breakouts, I mostly do double bottoms on support, but I really loooooove Bit. Connnneeeect. Er I mean triangles.
And as a support and resistance "expert", I know when to buy or not (well sometimes). I got a idea of when they are probably not going to hold much longer, and you see, from one strategy it can open towards another one indirectly. Not good to short at resistance and you got a great pattern right under it? Might as well buy.
If I think shorting at a resistance is a losing strategy, then why not flip it on its head and go the opposite direction?
Looking quickly at some examples, not even S/R or EW, just the pattern, I can eyeball the smelly ones and potentially good:
I probably already made an idea on this, but let's go over it again :)
And guess where it went? Like a fing magnet!!!
Actually this one was really easy to spot, I even remember posting about it.
I don't think I took it and I think it was because I was afraid of being in mid july, I just decided to avoid the mid july to mid august period entirely. Have to take a break at some point anyway.
So unless you are a c**t like me, you have a brain therefore was bullish on gold rather than nonsense like Bitcoin, I really see no reason not to buy this if that's your timeframe and you trade gold (and didn't have other correlated trades going on...).
This is the kind of thing that you have to practice as so to be able to spot more easilly.
I want to look at agri, they're basically what extends most, more than anything else, and they have made so many people rich quick and famous.
This is where people get absolutely massive winners in short periods. Especially when they keep adding to their winner.
Warren Buffet had a massive winner with coca-cola, and people that bought Bitcoin in 2011, but that took a couple of years.
Here we are talking of a few days or weeks to get an absolute insane ripper.
I heard that once a future traded up to limit for 26 days straight, not sure what it was. Lmao I imagine anyone being short there XD RIP.
(trading up to limit means the price goes up the maximum that the CME will allow at which point trading is halted for the day...)
This is ok:
Well anyway, I know there are some nice formations in FX & hard commodities, and also Bitcoin, apart from that I don't really know.
There might be in other markets, but I just stick to what I know.
In any case it is something to look at backtest and if it works add to the list of tools.

BNB doesn't deserve this levelHello fellas, welcome back to our podcast. This will be a very interesting podcast during this week! BNB is having my attention here. a lot of concern and update will be covered here. Let's do it.
Looking at the white trend line, it has been holding the price since August 2017 which means a 2 years trend line! And specifically, the price is coming very close to this trend line right now. Whenever I see the price moves like this and coming close to this trend line, I firmly believe that the price MUST respect this kind of trend line with a bounce.
My above statement is coming align with current pattern that I found on the market, we can easily deduce during the drop recently that the price is forming a bullish falling wedge which will always end up bullish. In my opinion, the APEX of the wedge is near and I believe that we will get the confirmation very soon to enter the long position.
Keep watching boy!

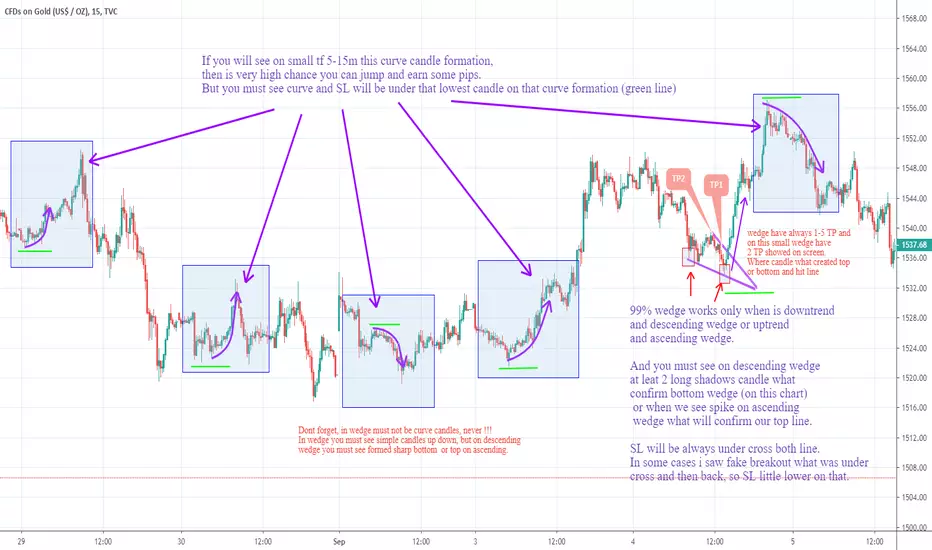
Curves and wedgeFor all please look at this for i created for learn
If you will see on small tf 5-15m this curve candle formation,
then is very high chance you can jump and earn some pips.
But you must see curve and SL will be under that lowest candle on that curve formation (green line)
99% wedge works only when is downtrend
and descending wedge or uptrend
and ascending wedge.
And you must see on descending wedge
at leat 2 long shadows candle what
confirm bottom wedge (on this chart)
or when we see spike on ascending
wedge what will confirm our top line.
SL will be always under cross both line.
In some cases i saw fake breakout what was under
cross and then back, so SL little lower on that.
wedge have always 1-5 TP and
on this small wedge have
2 TP showed on screen.
Where candle what created top
or bottom and hit line
Elliot wave count, 5th wave could be truncated : short term biasHello fellas, once again I provide you my analysis about bitcoin. without further chit chat, let's get to the point.
Here it is my detailed elliot wave count on bitcoin. Right after the call of bearish rising wedge or we can call it a leading first wave diagonal, we've seen a really huge up trend push form the bulls. I will label this moves as the 3rd wave going up on bitcoin on my short term view which has just finished, This means that current price is at the 4th wave phase which is the correction wave for wave 3. Based on elliot waves rules and guideline, we can easily deduce that the 4th wave could end up on fibonacci levels whether it is on 23.6 , 38.2 , 0.5 or the golden pocket as long as the price doesn't drop more than a wick of the 1st wave territory. The wave 4 trade is usually the most tricky wave that occur between the others wave so we have to be cautious.
yes, there is a possible moves of one more waves up which will be labeled as the wave 5. But, I want you all to remember that even the wave 5 can be truncated which can make a lower high comparing to the wave 3 and considering the current price is trending just below the upper line of the huge channel (green dotted line) this truncated wave 5 could occur too.
As of now, I am still on my long position and I use the white support trend line on smaller timeframe as the guideline. If the price breaks this support trend line, I will switch my long position into short and try to catch the wave 4. But, If this trend line can hold, I do believe that the price will touch at least the previous high.

XPTUSD Target Price 914.459 Objective 5.03RXPTUSD Target Objective 5.03R. The Stop Loss goes beneath the breakout candle. Entry on retest of horizontal support resistance.

Example of a bearish wedgeI try to draw a Bearish wedge using an ETF AOA, I know it's not a perfect draw but I do it the best fo me

Bitcoin - Dynamic Candlestick Patterns ~ 8/26/19I focus on providing live education and support to those interested in trading, Cryptocurrencies, and Blockchain technology. You will learn charting techniques, technical analysis, and the most popular cryptocurrencies for trading. My content is ideally suited for beginner to intermediate level traders.

Cuña alcista en GBPJPYUna posibilidad de irse largos apoyados en dos figuras, el canal y una cuña alcista muy pronunciada.

Signature of perfectionist buyers to trade a small reboundFor those who still wonder by what miracle chart analysis can work well, here's a proof:
Such proofs, I often see and they are an integral part of my publications, but I had not yet had the idea to dedicate a small Tutorial, and this proof is perfect for its simplicity and its obvious!
It is simply a question of proving that Chartism is neither a science nor divination or pure chance.
In technical analysis , there is especially a strong psychological dimension to study, interpret, and try to anticipate or at least use to his advantage.
This proof is an ascending channel that is anything but the product of hazard: a whale (market maker) or a set of individuals (I did not check the order book because it doesn't matter) traced a bullish trend resistant between the two recent peaks as you can see in white on my graph, then reported a parallel (you have the dedicated tool "Parallel Channel" to do the same in Tradingview), adjusted on the bottom of my graph: and he has (they have) placed their (their) purchase order very exactly on this parallel during the dump of the Rising Wedge of my previous publication (here in dashed for reminder), which also coincides with the expected target of this pattern of reversal (return bearish to the base of the wedge ).
The perfection of the pattern with this rebound leaves no room for doubt: it was not the result of chance, which gave the opportunity to anticipate and enjoy it with the interesting probability that there is a greater number of Long trades on the same simple track as on a direct continuation of the dump without rebound.

CHFJPY - My own top down analysis.Here is a video of my own top down analysis for CHFJPY. Still waiting for confirmations for any sort of bias. Stay tuned!


NAS100 Here we see endless opportunities if we correctly identify trend-line, support and resistance zones (highlighted by a red dots), and patterns (mostly triangles, and wedges). The entries are highlighted by small blue squares.

Rising wedgeRisisng wedge, bearish pattern
How to trade that: wait the confirmation of the breakdown. It's less aggressive but safer.
Target ? It's written on the chart how to have an idea.
On that case, there was a rounded top

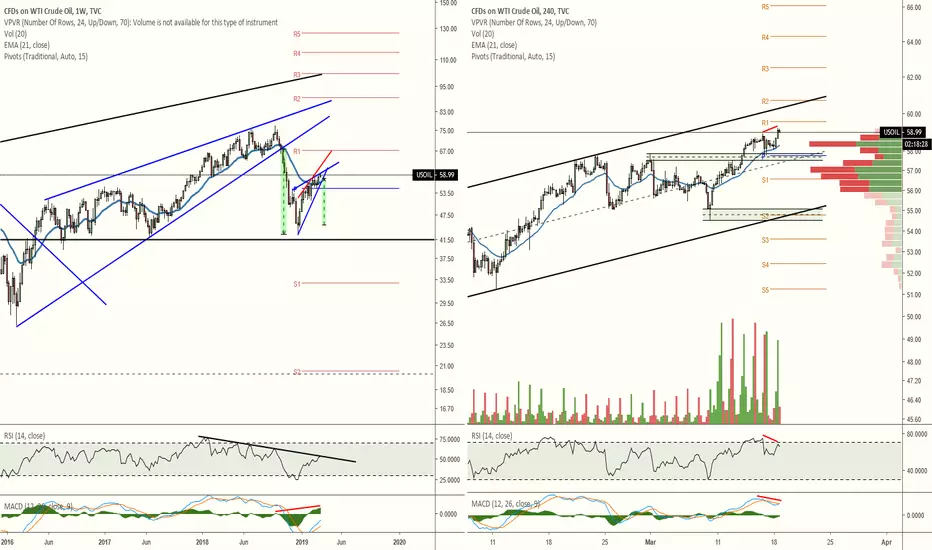
USOIL headed downWeekly chart shows price nearing the apex of the ascending wedge with a target of $45. RSI is hitting resistance and MACD's histogram is possibly printing hidden bearish divergence.
H4 chart shows RSI, and possibly MACD, printing bearish divergence. The nearby demand has already been tapped once making it much easier for the next drop into it to potentially fall further. I would watch for the demand below that at around $55 to provide some support. It also aligns with the ascending channel's support. If that support cannot hold then, based on the height of the ascending channel, we should be looking at $49.70/$50 for the next likely support. That target is a mere $5 away from the weekly breakdown target.

BTCUSD H4/D1 charts (3/14/2019)Good morning, traders. The consolidation for Bitcoin continues along an S/R line (H4 dotted red horizontal line) that's been prevalent since December. I have continued to readjust the H4 RSI descending channel to more correctly fit the price movement. At this point, we see RSI nearing a potential break of the channel's resistance as well as having just recently broken the short-term triangle's resistance. However, price remains just under the 21 EMA after having bounced off the bottom of the ascending channel this morning. This has price at the apex of a triangle created by the descending broadening wedge's resistance and ascending channel's support. The daily chart shows a possible ascending wedge printing in red. Based on the height of the wedge, that would signal a target of around $3590 which also is at an S/R level as noted by the blue horizontal line and another HVN.
If further movement to the downside occurs, then I would want to see the February 27th swing low hold at $3658.19. What this means is that I don't want to see a daily close below that. A wick below and close above would print a bullish SFP and signal likely upward price progression once again. If this were to play out, it would be a strong liquidity grab to fuel that price appreciation. Prior to that point, I would want to see the H4 March 8th swing low at $3760.10 hold.
The weekly 200 MA is sitting at $3408 right now, so it is possible to see price fall toward that level as that is also the ascending support of the monthly symmetrical triangle. Furthermore, as I have continued to mention, price is not out of the woods yet so we cannot rule out a flash drop to $2400 either. Interestingly, for channel traders, that would confirm a large ascending channel from the 2013 high to the 2015 low to the 2017 high. This kind of drop would need to just appear as a wick on the weekly chart with a close back above the 200 MA, otherwise we could be in for a much longer correction.
Every day, we have a choice to act positively or negatively, so if you get a chance, do something decent for someone today which could be as simple as sharing a nice word with them. You just might change their day, or even their life.
Remember, you can always click on the "share" button in the lower right hand of the screen, under the chart, and then click on "Make it mine" from the popup menu in order to get a live version of the chart that you can explore on your own.


BTCUSD D3/W1 charts (3/7/2019)Just taking a wider TF look at the pair. We can see a much clearer picture of a the possible ascending triangle that is printing. Weekly supply zone in green denotes the resistance at the top of the triangle. The W1 chart suggests that a clean close above that resistance should have price targeting the orange zone just below the weekly HVN. The D3 chart shows that area as the first level of support as price fell from $6000. Supply remains in that area, which should provide initial resistance on any movement up.
Today will close the current D3 candle and we can see that it is printing a nice bullish engulfing after the doji. It is also above the pivot as well as the 21 EMA. All of these are bullish.
As we can see on the weekly chart, the target based on the triangle takes price right into that supply. We can also see the ATH's descending wedge resistance sitting just a few hundred dollars above the current price. A close above this resistance should set up a $14,500 target, at least, based on the height of the wedge.
Every day, we have a choice to act positively or negatively, so if you get a chance, do something decent for someone today which could be as simple as sharing a nice word with them. You just might change their day, or even their life.
Remember, you can always click on the "share" button in the lower right hand of the screen, under the chart, and then click on "Make it mine" from the popup menu in order to get a live version of the chart that you can explore on your own.
