Bitcoin Dominance..!!BTC (Dominance)
As Bitcoin Failed to Clear the Major Resistance (7400) & Now It's ALTS/BTC Turn.
It's Time to Grab Some Strong Alts (Not Shitcoins) Coz Alts Are Ready to FLY..!!
Please like the idea for Support & Subscribe for More ideas like this and share your ideas and charts in Comments Section..!!
Thanks for Your Love & Support..!
Wedge

Bitcoin | Rising Wedge & CME GAP..!!BTC/USD (Update)
In 4hr Chart, #Bitcoin Forming Rising Wedge Pattern & Almost Ready for Big Move.
If Wedge Broken Upside, Then Bulls Might fill the $800 Unfilled gap in Coming Days.
If Wedge Broken Downside, then It Might Test the 5.8k Area.
BTW Rising Wedge is Bearish Pattern.(70/30)
In 8h Chart, Still Bulls trying to Clear the Important Resistance (6840-6960) but Bears Defending it.
Waiting for Strong Confirmations i.e RSI, MACD, Volume & EMA50 & 100!!
Please like the idea for Support & Subscribe for More ideas like this and share your ideas and charts in Comments Section..!!
Thanks for Your Love & Support..!

👨🏽🎨👩🏽🎨👨🏻🏫HOW TO MAKE TA IN 10 MIN 👨🏫👨🏻🎨🧑🎨Hello guys! In next 10 min I will teach you how to make TA!
Really simple steps to create your TA.
4 useful tools to build your TA:
-Trend Line
-Head and Shoulders
-Levels
-Fibonacci
ATTENTION: Dear followers please consider to appreciate my ideas on tradingview with your likes, this will help bring more quality content in next trading ideas. And if new to my work, and you like it, you can Follow my page to receive ideas in your Ideas Stream. Thanks 🤝😊
Stay tuned to Artem Crypto

Two shapes of Rising Wedge PatternsI have explained about Rising Wedge Patterns on this Tutorial in detail.
Rising Wedges are bearish pattern and it generates bearish signal; Rising Wedge Patterns forms with Higher Highs and Higher Lows.
Rising Wedge pattern basically forms in two shapes ; If rising wedge pattern forms in an uptrend it will make reversal and if rising wedge pattern forms in a downtrend it will make continuation.
The higher highs and the lower lows along makes a trend resistance and trend support. When breakout occurs downside, price breaks the trend support line.
In rising wedge breakout occurs downside 60 to 70% of the time.
To confirm a true breakout, we can take help of Volume indicator. In a true breakout there will be big volume than usual.
We should use other indicators like MACD and RSI also to confirm that it will turn bearish before taking entry in a trade. (We can see MACD divergence, RSI Divergence and where the RSI is...)
Thank You;
Stay Tuned 👍, more tutorials and strategies coming!

Two Shapes of Falling Wedge PatternsIn the previous educational post, i posted about Rising Wedge patterns and in this post i have explained about Falling Wedge Patterns. (Falling Wedge is opposite of Rising Wedge pattern; for every chart patterns there are opposite patterns excluding some.)
Falling Wedges are Bullish Patterns and it generates bullish signal, Falling wedge patterns forms with Lower highs and Lower lows.
Falling Wedge pattern basically forms in two shapes same as Rising Wedge ; If Falling wedge pattern forms in an uptrend it will make continuation and if Falling wedge pattern forms in a downtrend it will make reversal.
The Lower highs and the lower lows along makes a trend resistance and trend support. When breakout occurs upside, price breaks the trend resistance line.
In Falling wedge breakout occurs upside 60 to 70% of the time.
To confirm a true breakout, we can take help of Volume and other indicators. In a true breakout there will be big volume than usual.
We should use other indicators like MACD and RSI also to confirm that it will turn bullish before taking entry in a trade. (We can see MACD convergence, RSI convergence)
Stay Tuned 👍 ;
Thank You;
Check out Rising Wedge if you didn't ()

Some wedge symmetryExample of wedge symmetry, rising wedge turned falling wedge on the ETCUSD pair. The falling wedge begins wide at the top and contracts as it proceeds, eventually tightening to a point where it 'explodes' which can be seen. The rising wedge is the same except beginning wide at the bottom and tightening as it proceeds upwards, eventually leading to bearish movement. Apologies for the top red line it is not symmetrical at all!

USOil May Reverse Like This - Exercise PatienceFor educational and demonstration purposes. Currently in bear trend; when watching for possible reversal it may not be an aggressive spike but it could look more like this. Just something to consider and study.

How to trade the current markets!In this video I explain how you should be trading the current market movement and conditions. This video is more educational than anything else.


Raising wedge + throwoverRAISING WEDGE - everyone knows this typical pattern, which always occur in 1st or last wave on the chart - raising/falling wedge MUST have 5 touches of trendline, then we usually see strong move to the opposite direction.
On this chart of BTC dominance, we also saw THROWOVER - it´s pretty nasty thing, when the 5th touch goes above the wedge, but then price quickly drop and then we finally see break of the wedge.

Nifty in range 12500 to 11200 till May 2020Nifty in range between 12500 to 11200 till May 3rd week..
Possible wedge break down in May last week or June First week.....17.5 fall expected from
11150 ..Nifty wedge break down target
9300... On upside 12480 to 12500 shows
resistance which could be top this year in Apr 2020

Golden Cross V Rising Wedge and Low VolumeHello Traders, Bitcoiners, Hodlers and Chart Watchers,
Looking mostly at the Daily BTCUSD Pair:
On the current trend the 50MA/200MA golden cross will happen ~ 2/20/2020 - Within a week
The BTCUSD pair on the daily chart is showing a steep rising wedge that will break within a week
Xi Jinping Resistance ranges between 10,480 - 10,580
What is most interesting about this chart is that that Xi Jinping announced support for blockchain technology right after the Death ~ 10/24/2019 and The BTCUSD pair rose sharply with volume. Had there been no positive news at the time, the BTCUSD pair should have tanked to the long term support set in December 2018 to march 2019.
What will happen when we make the golden cross in a week? Time will tell.

GOLD patterns bigger picture so just have a look right at both price bars and ask yourself at this current moment do you really think gold is still gonna move higher ? yes might creep up a little bit more but this does show more signs for moving lower again at some point in time
my overall bias for gold is to move higher eventually but i cant see this happening anytime soon and just look at the size of the last corrective phase ? course there's going to be buys and sell within this structure zoom out and just look at price action
this tells you everything you need to know but yes this could all fail and gold could just fly to the moon but just be aware that this shows signs of moving lower
hope this help a few as i've been getting a lot of messages about gold this is just what i see has anything can happen
hope you've all had a great weekend lets get some profits :)

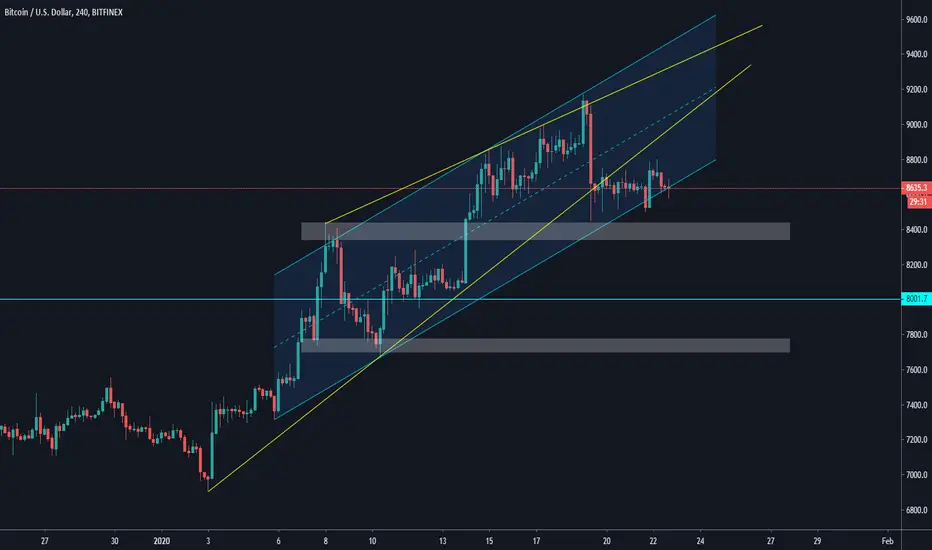
Bitcoin : 4 hours time frame is very crucialHello all, let make this real quick about the chart work of bitcoin.
Looking at the chart above, We can see a potential 2 patterns here. The first one is the rising wedge pattern which has been broken previously and the second one is the parallel channel of up trend moves. Things that I want to say is that currently the price is touching the lower line of the channel which acts as a support trend line. And if we use the 3 method of break out strategy, the price has already broken out the lower line of the rising wedges, therefore there might be a retest toward this previous broken support that is now become resistance. Will it be this time to touch those resistance?
Of course, we might see what the price action brings when the 4 hours candle closes. If we see any bounces, we might see retest toward the lower line of this rising wedge. But, if the price breaks down of current support, we might see the price drop to test the next support of $8400, $8000 and $7700.
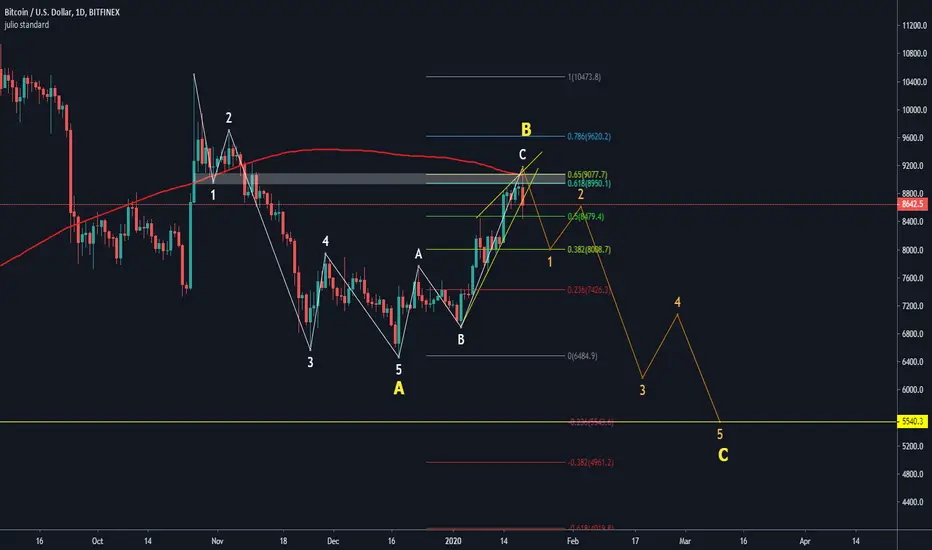
Bitcoin : I'm bearish since the first time and so what??Hello all, the bitcoin update is up again during this very crucial market update. Let's enjoy this technical analysis!
We've seen a violent 8% drop since the high of today's candle. This is also once again confirming the white area which is the major resistance and the confluence zone of the 200 MA, golden pocket and previous broken support that is now become resistance.
For me, a spike to the upside with current parabolic moves since $6500 is no more than a dead cat bounce. Which I've already give a clear explanation in my previous analysis. And for the elliot wave structure, it looks like that my bias is still holding true and with this rejection candle in the daily, we might see the next potential of lower low pattern around $5500 region.
I will give you more detail analysis after the weekly candle closes. With current momentum and price action, My bias is extremely bearish. And for the people who predicts the new ATH for this 2020, it's still a long way to go and for me, it's almost impossible to see their new ATH in 2020. Later on the next analysis, I will give a detail explanation about this.
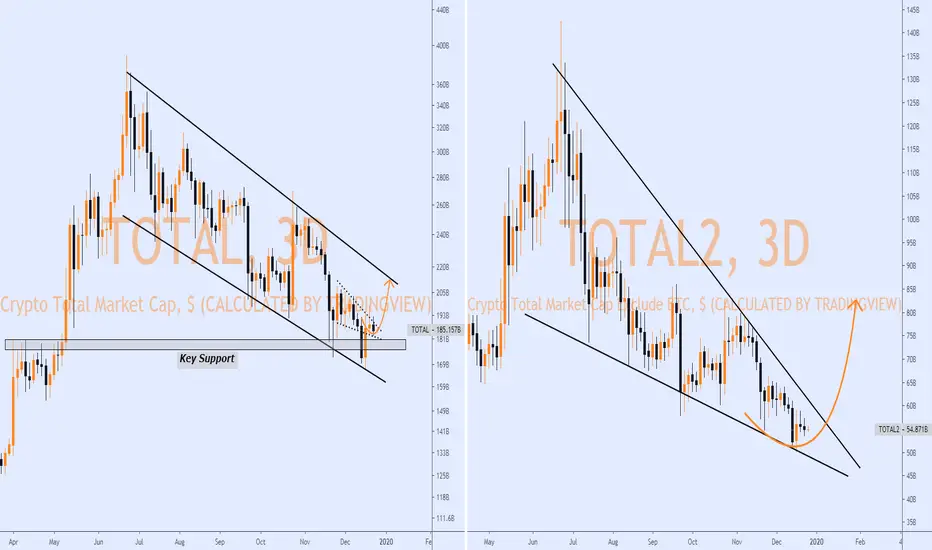
Crypto MarketCap Analysis..!!- Total MarketCap
Holding the Key Support in 3d Chart & Just Like Bitcoin, It's Also Forming Descending Channel.
If Bitcoin Price Jump from 7k Support then Total MarketCap will Automatically Grow & Follow the BTCUSD.
- ALTS_MarketCap
On the Other Hand, ALTS MarketCap is Forming Bullish Wedge Pattern in Bigger Time frames & I Think Q1 2020 Will be Bullish Year For ALTS too.
ALTS Need Some Strong Volume For Wedge Breakout & Growth.
- Bitcoin Dominance
On The Other Hand, Bitcoin Dominance is Also Increasing after Wedge Breakout & Now Holding the Key Support, (70%)
If Support Broken Then We Could See Some Growth in ALTS in Coming Days,
Some Bitcoin Updates..!!
Please like, subscribe and share your ideas and charts with the community!

Ripple | Holding the Bottom Support ..!!XRP/USD (Update)
Ripple price is still struggling to gain momentum and declining below $0.1920 against the US dollar.
In Bigger TF Chart, XRPUSD Is Forming Wedge Pattern & Holding Bottom Support As well.
Recently, Ripple (XRP) Hits 27-Month Low & Now holding the Bottom Support.!!
Ripple’s price action in 2020 will largely depend on the movement in Bitcoin’s market.
For instance, the 2020 Bitcoin halving event is expected to drive the price to highs above $20000. The correlation between the assets will impact XRPUSD into a bullish rally and could pull the price to levels above $1.0.
However, I still believe 0.9$ is a very conservative price for XRP.After Wedge Breakout.
Ripple Regulation..!!
Ripple has particularly struggled with regulation for its XRP cryptocurrency, especially in the United States.
The Securities and Exchange Commission (SEC) is torn between categorizing XRP as a security token or leave it to ride along as crypto.
However, XRP has gained traction in the United Kingdom, which recently referred to it as crypto, just like Ethereum.
Many experts and enthusiasts believe that unclear regulations for the industry are stifling innovation.
Ripple Future and Growth
Ripple is often regarded as the future of cryptocurrencies in terms of technology infrastructure as well as mainstream adoption.
Armed with its flagship products: RippleNet and xRapid the network is set to be the bridge between cryptocurrencies and the traditional banking system.
More importantly, Ripple believes that it will soon overtake SWIFT to become the preferred cross-border money transfer platform.
SWIFT has its own share of struggles that are dealing with including long processing time and unreliability.
On the other hand, Ripple as mentioned above already has signed partnerships with more than 200 banking institutions.
Besides, this number is expected to grow with the current expansion to the Middle East and the Asian regions.
Ripple’s XRP demand in the future will mainly come from banks as adoption increases supported by the need to send money across the border faster, reliably and a low cost.
Please like, subscribe and share your ideas and charts with the community!

Ethereum | 2020 Will be Bullish Year For Ether..!!What is Ethereum.??
Ethereum is an open source, public, blockchain-based distributed computing platform and operating system featuring smart contract functionality. It supports a modified version of Nakamoto consensus via transaction-based state transitions.
Ether Milestones
Late 2013 - Ethereum White Paper released by Vitalik Buterin.
July/August 2014 - Ethereum Crowdfunding to fund development.
30th July 2015 - Public launch (Version 1, codename “Frontier”) with 72 million coins pre-mined to support development.
October 2015 - First Ethereum Improvement Proposal (EIP-1) lays out the rules for governance and community consensus.
14th March 2016 - First “stable” release (Version 2, codename “Homestead”) with updates to security, transaction processing and pricing.
June 2016 - The DAO hack.
20th July 2016 - ETH/ETC Hard Fork.
16th October 2017- Version 3 (codename “Metropolis: Byzantium”) with updates to the Ethereum Virtual Machine and smart contracts.
2017 - Ethereum Smart Contracts enable the funding of many crypto-currency projects via Initial Coin Offerings (ICOs).
December 2017 - Cryptokitties brings out scaling problems in Ethereum, with the network being congested and transactions being delayed.
28th February 2019 - Version 3.5 (codename ”Metropolis: Constantinople”) implementing zk-SNARKS borrowed from ZCash.
ETH/BTC (Update)
Now Let's Take a Look on Ether Technicals, In Bigger Chart (Monthly) Forming a Wedge Pattern & I Think 2020 Will Be Bullish Year For Ether.(If Follows my Plan)
ETH/USD (USD Pair)
Just like BTCUSD , Ether is Also Moving inside the Descending Channel (Downtrend) in Daily TF Chart.
Recently Tested the Lower Channel Line & Now Bouncing up Towards the Key Resistance (144), Just like BITCOIN .
It's Decreasing the Volume since 25th June Top & Now I Think It's Time For Reversal..(Major Indicators ( MACD & RSI ) Are Also Turning Bullish )
Now If Key Resistance Broken in Coming Days Then ETHER Will be Back in Uptrend & It Might Test (195) Resistance.
In 3D & Weekly Chart, It's Forming Bullish Wedge Pattern as well ..
Please like, subscribe and share your ideas and charts with the community!

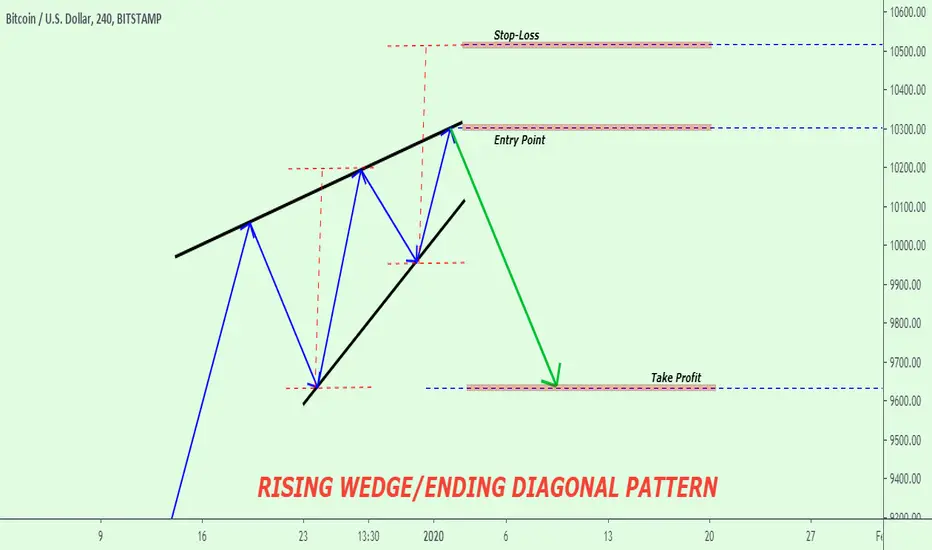
RISING WEDGE/ENDING DIAGONAL PATTERN. How to Trade it...Rising Wedge
A Rising Wedge is a chart pattern within the context of an uptrend composed of two upward sloping and converging trendlines connecting a series of higher swing/pivot highs and higher swing/pivot lows.
Rising wedge (also known as the ascending wedge) pattern is a powerful consolidation price pattern formed when price is bound between two rising trend lines. It is considered a bearish chart formation which can indicate both reversal and continuation patterns – depending on location and trend bias. Regardless of where the rising wedge appears, traders should always maintain the guideline that this pattern is inherently bearish in nature.
HOW TO IDENTIFY A RISING WEDGE PATTERN:
~ Establishing Downtrend.
~ Rising wedge consolidation formation
~ Linking higher highs and lower lows using a trend line assembling towards a narrowing point.
~ Confirm divergence between price and volume may also be used.
~ Look for break below support for short entry.
HOW TO TRADE THE RISING WEDGE PATTERN:
All Details are labelled in the Chart..

What is an ascending broadening wedge? (Educational, Example) An ascending broadening wedge is a bearish chart pattern (said to be a reversal pattern). It is formed by two diverging bullish lines.
An ascending broadening wedge is confirmed/valid if it has good oscillation between the two upward lines. The upper line is the resistance line; the lower line is the support line.
Each of these lines must have been touched at least twice to validate the pattern.
NB: a line is said to be "valid" if the price line touches the support or resistance at least 3 times.
This implies that the ascending broadening wedge pattern is considered valid if the price touches the support line at least 3 times and the resistance line twice (or the support line at least twice and the resistance line 3 times).
An ascending broadening wedge does not mark the exhaustion of the buying current, but the sellers’ ambition to take control. The divergence of the two lines in the same direction (increase in price magnitude) informs us that the price continues to increase with movements that are increasingly high in magnitude. The buyers manage to make the price rebound on the support line but lose control after the formation of a new highest point. The lowest point reached during the first correction on the ascending broadening wedge’s support line forms the support. A second wave of increase then occurs with more magnitude, signalling the loss of buyers' control after a new highest point. A third wave is formed afterwards but buyers lose control again after the formation of new highest points.
During the formation of an ascending broadening wedge, volumes do not behave in any particular way but they increase strongly when the support line breaks.

Eduational: Example of a descending broadening wedge. A descending broadening wedge is bullish chart pattern (said to be a reversal pattern). It is formed by two diverging bullish lines.
A descending broadening wedge is confirmed/valid if it has good oscillation between the two upward lines . The upper line is the resistance line; the lower line is the support line.
Each of these lines must have been touched at least twice to validate the pattern.
NB: a line is said to be "valid" if the price line touches the support or resistance at least 3 times.
This implies that the descending broadening wedge pattern is considered valid if the price touches the support line at least 3 times and the resistance line twice (or the support line at least twice and the resistance line 3 times).
A descending broadening wedge does not mark the exhaustion of the selling current, but the buyers’ ambition to take control. The divergence of the two lines in the same direction (increase in price magnitude) informs us that the price continues to fall with movements that are increasingly low in magnitude. The sellers manage to make the price rebound on the resistance line but lose control after the formation of a new lowest point. The highest point reached during the first correction on the descending broadening wedge’s resistance line forms the resistance. A second wave of decline then occurs of more magnitude, signalling the sellers' loss of control after a new lowest point. A third wave forms afterwards but the sellers lose control again after the formation of new lowest points.
During the formation of a descending broadening wedge, volumes do not behave in any particular way but they increase strongly when the support line breaks. source:Centralcharts
