MTF Candles [Fadi x MMT]MTF Candles
Overview
The MTF Candles indicator is a powerful tool designed for traders who want to visualize higher timeframe (HTF) candles directly on their current chart. Built with flexibility and precision in mind, this Pine Script indicator displays up to six higher timeframe candles, complete with customizable styling, sweeps, midpoints, fair value gaps (FVGs), volume imbalances, and trace lines. It’s perfect for multi-timeframe analysis, helping traders identify key levels, market structure, and potential trading opportunities with ease.
Key Features
- Multi-Timeframe Candles : Display up to six higher timeframe candles (e.g., 5m, 15m, 30m, 4H, 1D, 1W) on your chart, with configurable timeframes and visibility.
- Sweeps Detection : Identify liquidity sweeps (highs/lows) with customizable line styles, widths, and colors, plus optional alerts for confirmed bullish or bearish sweeps.
- Midpoint Lines : Plot the midpoint (average of high and low) of the previous HTF candle, with customizable color, width, and style for enhanced market analysis.
- Fair Value Gaps (FVGs) : Highlight gaps between non-adjacent candles, indicating potential areas of interest for price action.
- Volume Imbalances : Detect and display volume imbalances between adjacent candles, aiding in spotting significant price levels.
- Trace Lines : Connect HTF candle open, close, high, and low prices to their respective chart bars, with customizable styles and optional price labels.
- Custom Daily Open Times : Support for custom daily candle open times (Midnight, 8:30, or 9:30) to align with specific market sessions.
- Dynamic Labels : Show timeframe names, remaining time until the next HTF candle, and interval labels (e.g., day of the week for daily candles) with adjustable positions and sizes.
- Highly Customizable : Fine-tune candle appearance, spacing, padding, and visual elements to suit your trading style.
How It Works
The indicator renders HTF candles as boxes (bodies) and lines (wicks) on the right side of the chart, with each timeframe offset for clarity. It dynamically updates candles in real-time, tracks their highs and lows, and displays sweeps and midpoints when conditions are met. FVGs and volume imbalances are calculated based on candle relationships, and trace lines link HTF candle levels to their originating bars on the chart.
Sweep Logic
- A bearish sweep occurs when the current candle’s high exceeds the previous candle’s high, but the close is below it.
- A bullish sweep occurs when the current candle’s low falls below the previous candle’s low, but the close is above it.
- Sweeps are visualized as horizontal lines and can trigger alerts when confirmed on the next candle.
Midpoint Logic
- A midpoint line is drawn at the average of the previous HTF candle’s high and low, extending until the next HTF candle forms.
- Useful for identifying potential support/resistance or mean reversion levels.
Imbalance Detection
- FVGs : Identified when a candle’s low is above the next-but-one candle’s high (or vice versa), indicating a price gap.
- Volume Imbalances : Detected between adjacent candles where the body of one candle doesn’t overlap with the next, signaling potential liquidity zones.
Settings
Timeframe Settings
- HTF 1–6 : Enable/disable up to six higher timeframes (default: 5m, 15m, 30m, 4H, 1D, 1W) and set the maximum number of candles to display per timeframe (default: 4).
- Limit to Next HTFs : Restrict the number of active timeframes (1–6).
Styling
- Body, Border, Wick Colors : Customize bull and bear candle colors (default: light gray for bulls, dark gray for bears).
- Candle Width : Adjust the width of HTF candles (1–4).
- Padding and Spacing : Set the offset from the current price action and spacing between candles and timeframes.
Label Settings
- HTF Label : Show/hide timeframe labels (e.g., "15m", "4H") at the top/bottom of candle sets.
- Remaining Time : Display the countdown to the next HTF candle.
Interval Value: Show day of the week for daily candles or time for intraday candles.
- Label Position/Alignment : Choose to display labels at the top, bottom, or both, and align them with the highest/lowest candles or follow individual candle sets.
Imbalance Settings
- Fair Value Gap : Enable/disable FVGs with customizable color (default: semi-transparent gray).
- Volume Imbalance : Enable/disable volume imbalances with customizable color (default: semi-transparent red).
Trace Settings
- Trace Lines : Enable/disable lines connecting HTF candle levels to their chart bars, with customizable colors, styles (solid, dashed, dotted), and sizes.
- Price Labels : Show price levels for open, close, high, and low trace lines.
- Anchor : Choose whether trace lines anchor to the first or last enabled timeframe.
Sweep Settings
- Show Sweeps : Enable/disable sweep detection and visualization.
- Sweep Line : Customize color, width, and style (solid, dashed, dotted).
- Sweep Alert : Enable alerts for confirmed sweeps.
Midpoint Settings
- Show Midpoint : Enable/disable midpoint lines.
- Midpoint Line : Customize color (default: orange), width, and style (solid, dashed, dotted).
Custom Daily Open
Custom Daily Candle Open : Choose between Midnight, 8:30, or 9:30 (America/New_York) for daily candle opens.
Usage
- Add the indicator to your TradingView chart.
- Configure the desired higher timeframes (HTF 1–6) and enable/disable features via the settings panel.
- Adjust styling, labels, and spacing to match your chart preferences.
Use sweeps, midpoints, FVGs, and volume imbalances to identify key levels for trading decisions.
- Enable sweep alerts to receive notifications for confirmed liquidity sweeps.
Notes
Performance: The indicator is optimized for up to 500 boxes, lines, and labels, with a maximum of 5000 bars back. Can be slow at a time
Time Zone: Custom daily opens use the America/New_York time zone for consistency with major financial markets.
Compatibility: Ensure selected HTFs are valid (higher than the chart’s timeframe and divisible by it for intraday periods).
Multitimeframe

[FREE] Multiple Indicators Screener [NASAlgoTrading] Multiple Indicators Screener indicator is designed to help traders quickly scan multiple cryptocurrencies across different timeframes using a combination of proven technical indicators. It provides a comprehensive, at-a-glance view of market conditions to help identify high-probability trading opportunities.
How It Helps Traders Maximize Profits
✅ Saves Time – No need to switch between charts; all key metrics are displayed in one place.
✅ Confirms Trends – Combines multiple indicators to filter high-probability setups.
✅ Multi-Timeframe Alignment – Finds trades where short-term and long-term trends agree.
✅ Overbought/Oversold Alerts – Helps spot potential reversals using RSI, Stochastic, and TSI.
✅ Trend Strength Validation – ADX and Supertrend confirm whether a trend is worth trading.
Why Use This Script?
✔ Completely Free – No hidden costs or premium upgrades.
✔ Easy to Use – No complex setup; works out of the box.
✔ Customizable – Adjust timeframes, indicators, and assets to fit your strategy.
Best For:
Swing Traders – Identify trends across multiple timeframes.
Day Traders – Quickly scan for intraday opportunities.
Crypto Traders – Optimized for popular cryptocurrency pairs.
Start using this powerful screener today to enhance your trading efficiency and spot the best setups with ease! 🚀

Highs and Lows By ScalprHighs & Lows (HL) – Multi-Time-Frame Levels
What It Does
Highs & Lows plots the most important reference levels for up to four different time-frames at once. It displays divider lines that mark the start of each new period, opening lines showing the first price of the period, highs lines tracking the highest price reached, and lows lines tracking the lowest price reached in each period. Use it to read market structure at a glance, trade opening-range returns, gap fills, sweeps and other level-based setups.
Key Features
Multi-Time-Frame Engine
Choose from 4 Hour, 1 Hour, 30 minutes, 15 minutes, 10 minutes, 5 minutes, Daily, Weekly or Monthly for each of the four slots. Turn individual slots on/off from one global panel for easy management.
Per-Time-Frame Display Controls
For every active slot you can independently toggle divider lines, opening lines, highs lines, lows lines, and hide current opening to keep only completed periods visible.
Smart "Show Last X" Filters
Keep charts clean by limiting history. Control how many recent periods to show for lines and how many recent text labels to display. For example, show only the last 2 hours on a 1-hour chart.
Hide Swept Highs/Lows
Automatically hide any highs or lows that price has traded through, keeping your chart clean and focused only on unswept levels that remain relevant.
Text Labels
Add optional custom text for highs and lows like "H1" and "L1". Labels automatically position above highs and below lows with horizontal alignment options of left, center, or right. Adjust color, size and font weight to match your preferences.
Styling Freedom
Independent color, line style including solid, dashed, or dotted options, and width settings for each level type. Transparency is applied automatically when hiding current period information.
How to Use
Start by enabling the time-frame slots you need in Global Settings. In Multi-Time-Frame Settings, pick the interval for each slot and toggle which lines you want displayed. Fine-tune visibility using "Show Last X" in Time-Frame Lines to limit historical lines, and "Show Last X" in Text to limit labels. Adjust colors and widths in the Time-Frame Lines sections to match your chart theme.
Notes
The script is lightweight and deletes old objects in real time to maintain TradingView's limits. It works on any symbol and chart resolution with levels updating live. Text labels are purely textual with no background boxes to maximize clarity and reduce chart clutter.
Happy trading and stay level-headed!

HTF Candle Extremes Zigzag (Drawn on LTF)HTF Candle Extremes Zigzag (Drawn on LTF)
This indicator plots zigzag lines connecting the extremes (highs and lows) of Higher Timeframe (HTF) candles directly on your lower timeframe (LTF) chart. It visually highlights trend changes and HTF candle structure by drawing colored lines representing uptrends and downtrends based on HTF candle extremes.
"Key Features"
Higher Timeframe Tracking: Select any HTF to track candle extremes using the built-in security function.
Zigzag Lines: Connects HTF candle lows to highs in an intuitive zigzag pattern.
Trend Indication: Uptrend lines are green, downtrend lines are red (customizable colors).
Customizable Line Width: Adjust the thickness of the zigzag lines for better visibility.
Drawn on Lower Timeframe: All lines appear on your active lower timeframe chart, allowing easy visual correlation.
"How It Works"
The script fetches the open, high, low, close, and time data of the specified HTF candle. It detects new HTF bars and identifies trend direction changes by comparing the highs and lows of consecutive HTF candles.
- When an uptrend is detected, vertical lines are drawn from low to high of the HTF candle, connected to the previous extreme low.
- When a downtrend is detected, vertical lines are drawn from high to low, connected to the previous extreme high.
- Transitions between trends are highlighted by connecting the last extreme of the previous trend to the current extreme, creating a clean zigzag pattern.
Usage Notes:
Ideal for traders who want to visualize HTF market structure and trend changes while analyzing price action on lower timeframes.
---
© The_Forex_Steward
(mozilla.org)

MTF Trend + SMC Structure (EMA/SMA Mix - HH/HL)Objective
To provide a quick, visual, and reliable reading of market trends and structure.
Combines dynamic moving averages and SMC (market structure) logic.
Effectively integrates into the chart via a clear table displayed in the top right corner.
📊 What the indicator displays (by timeframe: M5, M15, M30, H1, H4, D1, W1)
🟢 1. MA Trend
Based on two moving averages (short and long).
Average Type:
EMA for M5 to M30 (reactive)
SMA for H1 to Weekly (smoother)
Display:
🟢 Up if short MA > long MA
🔴 Down if short MA < long MA
Customizable lengths per timeframe
🧱 2. Structure (SMC logic)
Detects Higher High / Higher Low and Lower High / Lower Low
Based on significant pivots (pivothigh, pivotlow)
Logic inspired by SMC swing trading
Display:
🟢 Up = bullish structure (HH + HL)
🔴 Down = bearish structure (LH + LL)
⚪ Neutral = no clear structure
✅ Advantages
🔍 Instant view of the overall multi-timeframe context
📉 Combines trend by MA and SMC structure
🎯 Helps filter out bad entries Countertrend
⚡️ Very useful for intraday, swing, or SMC traders

EdgeXplorer - Dynamic Price ActionEdgeXplorer – Dynamic Price Action
Dynamic Price Action by EdgeXplorer is a high-precision structural framework that detects and maps market structure shifts, liquidity zones, and sweep events in real time. Built for traders who prioritize price behavior over indicators, this suite intelligently interprets swing pivots, volatility ranges, and institutional footprints to surface key decision-making zones on your chart.
Whether you trade Smart Money Concepts (SMC), classical price action, or hybrid strategies, Dynamic Price Action helps you visualize where price is reacting, where it’s hunting stops, and when structure is shifting — without the noise.
⸻
🔍 What Does Dynamic Price Action Do?
This indicator tracks three core elements:
1. Market Structure Shifts – Bullish and bearish swing breaks (BOS and MSS)
2. Liquidity Zones – Dynamic detection of potential buy-side and sell-side liquidity pools
3. Sweep Events – Real-time detection when liquidity is taken out (aka stop hunts or raids)
It also contains logic for Order Block detection, giving you a foundational structure for further Smart Money analysis (note: OB visuals are currently off by default but fully supported).
⸻
⚙️ How It Works – Technical Breakdown
1. Market Structure (BOS / MSS)
• Detects swing highs and lows using a 3-bar pivot system
• When a valid swing is confirmed:
• A BOS (Break of Structure) line is drawn for bullish shifts
• An MSS (Market Structure Shift) line is drawn for bearish transitions
• Lines are plotted with customizable styles and optional labels
2. Liquidity Detection
• Liquidity zones are marked based on:
• Recent confirmed swing highs or lows
• ATR-based range check (swing must exceed Liquidity Sensitivity threshold)
• Post-swing candle direction (bullish or bearish close)
• Sell-Side Liquidity = swing highs likely containing stop clusters
• Buy-Side Liquidity = swing lows likely containing stop clusters
• Each zone is tagged visually and stored for later sweep checks
3. Sweep Recognition
• If price breaches a previously tagged liquidity level:
• A “Sell Sweep” label appears above the former sell-side zone
• A “Buy Sweep” label appears below the former buy-side zone
• Zones are removed after being swept to reduce clutter
4. Order Block Logic (Optional)
• The script includes full logic to detect bullish/bearish order blocks based on:
• Body-based or wick-based structure (user preference)
• Candle volume criteria
• Visuals are turned off for now but can be easily re-enabled
⸻
📈 What You See on the Chart
Visual Element Meaning
Green BOS Line Bullish break of market structure (higher high)
Red MSS Line Bearish shift in structure (lower low)
“Sellside Liquidity” Label Area above a swing high likely to hold resting liquidity
“Buyside Liquidity” Label Area below a swing low likely to hold resting liquidity
“Sell Sweep” Label A stop hunt above a prior high
“Buy Sweep” Label A stop hunt below a prior low
All elements are dynamically drawn, adapting to price behavior with zero repainting.
⸻
📊 Inputs & Settings Explained
Market Structures
Setting Description
Enable Market Structures Toggle BOS/MSS logic
Detection Mode Conceptual filter: Short-Term, Mid-Term, Long-Term (doesn’t affect logic)
Show Labels Display BOS and MSS labels above/below structure
Line Style Choose between Solid, Dashed, or Dotted
Bullish/Bearish Colors Customize line and label appearance
Liquidity Zones
Setting Description
Liquidity Sensitivity How large a swing must be (ATR multiplier) to qualify as a liquidity point
Order Blocks
Setting Description
Use Candle Body If true, OB zones are based on open/close instead of high/low
⸻
🧠 How Traders Can Interpret Dynamic Price Action
Structure-Based Bias:
• BOS = bullish structure continuing → look for long setups
• MSS = bearish structure breaking down → caution for reversals
Liquidity Zones:
• Price nearing a Sellside Liquidity zone? Watch for sweep + rejection
• Price tapping Buyside Liquidity? Look for absorption or reversal
Sweep Events:
• A Buy Sweep can signal accumulation
• A Sell Sweep can mark distribution or a trap breakout
Use sweeps as confirmation, trap detection, or entry filters.
⸻
🧪 Strategy Use Cases
• 🔍 Smart Money Concepts (SMC): Combine BOS/MSS + sweeps for refined CHoCH entries
• 🔄 Reversal Traders: Wait for sweep + structure shift before entering against prior trend
• 📉 Trend Continuation: Use BOS + liquidity clears to confirm direction
• 🎯 Scalping: Sweep zones act as high-probability entry areas on LTFs

Higher High Lower Low Multi-TF📊 Higher High Lower Low Multi-Timeframe Indicator
Detects market structure shifts (HH, HL, LH, LL)
Identifies trend direction (bullish / bearish / neutral)
Works across multiple timeframes (M5 to Weekly)
Displays a compact trend summary table on the chart
Customizable pivot sensitivity (Left/Right Bars)
Visual labels on chart for structure points
Ideal for structure-based trading and SMC traders

Enhanced Multi-Timeframe Bias Dashboard + VolatilityProvides a table that indicates the RSI, MACD and overall bias across the daily, 4 hour and 1 hour timeframes

Multi Indicator Version 2This Pine Script combines multiple technical indicators into one TradingView overlay: two EMAs (High/Low), Supertrend, VWAP with flexible anchoring (e.g., Session, Week, Earnings), previous day’s high/low for intraday analysis, and RSI-based visual cues. The Supertrend dynamically shades the background based on trend direction and generates alerts on trend changes. VWAP visibility can be toggled and is hidden on daily or higher timeframes if desired. RSI stars indicate overbought (above 70) and oversold (below 30) conditions. This comprehensive tool aids traders in identifying market trends, momentum, and key support/resistance levels for better decision-making.


Range Filter Buy & Sell 5min + Multi-TF DashboardElevate your edge with Range Filter Buy & Sell 5min + Multi-TF Dashboard—a precision-engineered trend companion that scans your favorite markets from the 5-minute tick to the higher-timeframe horizon. By harmonizing short-term signals with the broader trend, it delivers crystal-clear buy and sell cues—and the confidence to act on them. Whether you’re scalping, swing trading, or investing for the long haul, this all-in-one dashboard empowers you to ride only the strongest trends and step aside before the noise hits. Trade smarter. Trade with clarity. Trade with conviction.

Multi-Time Period ChartsI have made it so you don't have to change the candle value each time you switch timeframes.

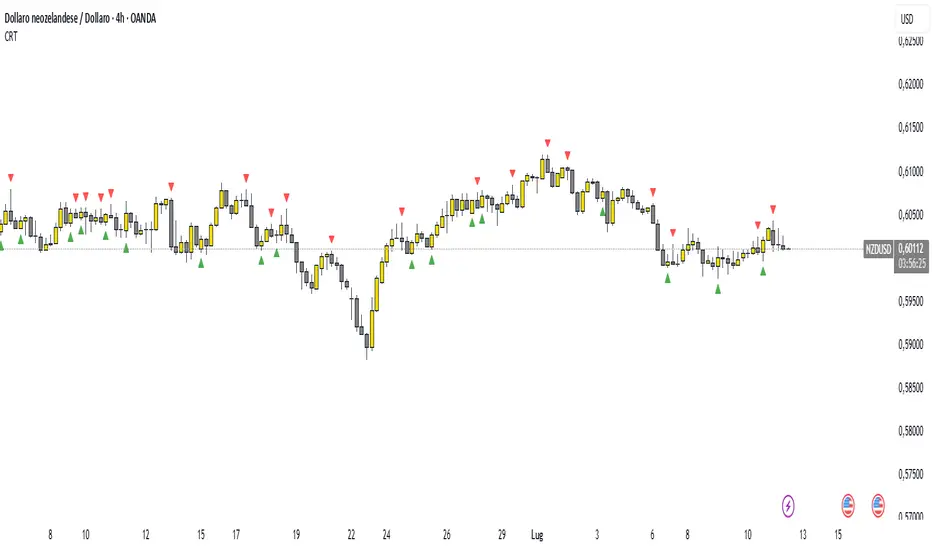
Candle Range Theory (CRT) indicator📌 Indicator Name: Candle Range Theory (CRT) indicator
This indicator detects potential bullish and bearish reversal setups based on specific candlestick price action behavior. It is designed to highlight moments when the market may be rejecting extremes and preparing to reverse direction — but only after confirmation with the closing price.
🔍 How It Works:
Bullish Setup (Long Signal):
The previous candle is bearish (closes lower than it opens).
The current candle makes a lower low than the previous one.
The current candle closes above the previous candle’s close.
Bearish Setup (Short Signal):
The previous candle is bullish (closes higher than it opens).
The current candle makes a higher high than the previous one.
The current candle closes below the previous candle’s close.
Signals are only triggered after the bar is fully closed, to avoid premature entries.
🔔 The script includes alert conditions for both long and short setups so you can receive notifications instantly.
🎥 Inspiration:
The idea for this indicator came from the excellent educational content presented in this video:
"How to Read Candlesticks Like a Pro"
We highly recommend watching it to better understand the price action principles behind this signal.
EdgeFlow Scalping Dashboard [GalihRidha]🚀 Unlock the Edge — Trade Smarter, Trade Safer!
Are you tired of missing high-quality entries, struggling with fakeouts, or second-guessing your trades?
EdgeFlow Scalping Dashboard puts professional-grade decision support right on your chart — so you always know when to strike, when to wait, and when to stay out.
No more trading in the dark. No more emotional guessing.
This is your real-time, on-chart trading edge — designed for the fast-paced world of scalping and adaptable for any trading style.
🧠 What Makes EdgeFlow Special?
Instant Signal Clarity:
Get crystal-clear LONG/SHORT signals and “Safety” ratings delivered exactly when you need them — one minute before every candle closes, on any timeframe!
Visual Risk Management:
Adaptive TP/SL levels and live reversal detection keep you out of chop and false moves, so your stops and targets are always optimized for current market conditions.
Professional, Multi-Factor Analysis:
Combines trend, momentum, volatility, volume, and advanced pattern recognition — including candlestick patterns, RSI divergence, and higher timeframe confirmation.
Actionable Dashboard:
The vertical, minimalist layout keeps your workflow clean and mobile-friendly. Track your last trade, prep your next move, and see at a glance if conditions are Safe, Neutral, or Not Safe.
🔑 Why Choose EdgeFlow Scalping Dashboard?
Trade with Confidence:
Stop hesitating — the dashboard highlights the safest opportunities, complete with risk grades and reversal probabilities.
React Faster:
See “Capturing...” as soon as the dashboard starts scanning for a new signal, so you never get left behind on entries.
Avoid Costly Mistakes:
Color-coded warnings and smart, dynamic TP/SL help you stay disciplined and skip high-risk setups.
For Every Trader:
Whether you’re a crypto scalper, forex daytrader, or swing trader — EdgeFlow adapts to any market, any timeframe, and any asset.
📈 How To Use
Watch the dashboard for the Next Section to light up — that’s your advanced notice to prepare an entry.
Double-check the Safety status and Reversal Probability.
Enter trades only when the conditions are green, or use your own system with these insights for even more edge.
Review the Last Section to learn from each trade and refine your timing.
💡 Ready To Level Up Your Trading?
Don’t settle for ordinary indicators. EdgeFlow Scalping Dashboard gives you everything you need — real-time signals, risk context, and pro-grade safety filtering — all in one place.
Try EdgeFlow on your favorite chart, and feel the difference with every decision.
📚 Dashboard Key
🔙 Last Section: Your previous signal and its full context.
🔜 Next Section: The upcoming opportunity — with targets and safety score.
🛰️ Capturing... = Dashboard is monitoring for your next edge.
🌟 Enjoy and trade safe!
Follow, fork, and tag if you publish an upgrade! Your feedback and ideas are always welcome . 🚦✨

Gabriel's Quick Table📊 Gabriel's Quick Table — Multi-Metric Market Scanner
Gabriel's Quick Table is a lightweight, customizable table overlay that displays key market metrics for intraday, swing, and options traders. It centralizes high-impact price, volume, and volatility data across multiple timeframes to quickly assess trade readiness, risk levels, and momentum without cluttering your chart.
🔍 Features
✅ ADR% (Average Daily Range %)
Measures price volatility by averaging the ratio of high/low over N days.
Helps spot compression/expansion setups.
✅ ATR (Average True Range)
Assists with stop-loss placement and measuring volatility strength.
User-defined ATR Length and timeframe.
✅ LoD Distance (% from Low of Day)
Identifies how far price has bounced off the intraday low.
Useful for reversal traders and support tests.
✅ % from 52-Week High
Calculates how far current price is from its long-term swing high.
Ideal for value reversion setups or breakout scanning.
✅ Relative Volume (RVOL)
Measures current volume versus average over N bars.
Highlights unusual activity or breakout potential.
✅ VWAP Distance
Shows how far price is from the volume-weighted average price.
Used by institutions and intraday traders to define fair value zones.
✅ Internal Bar Strength (IBS)
Normalized indicator showing whether price closed near the high or low of the candle.
Useful for fade vs. breakout setups.
✅ Open Interest % Change
Measures short-term change in OI, used in futures/options analysis.
Spikes may indicate buildup of positions or unwinding.
🚨 Built-In Alerts
Each core metric includes a customizable alert:
ADR%, ATR, RVOL, VWAP distance
Distance to 52-week high
OI % change
IBS thresholds
Use these to automate watchlist scanning or intraday alerts when your ideal trade conditions appear.
🧠 Smart Design
Multi-timeframe support for each input (e.g. Weekly 52W High + Intraday VWAP).
Minimalist table overlay that works even when multiple indicators are stacked.
Color-coded labels and values for intuitive scanning.
💡 Use Cases
Intraday traders looking for high-RVOL + VWAP bounce setups.
Swing traders waiting for price compression (low ADR%) or breakouts near 52W highs.
Futures and options traders tracking OI surges with volume confirmation.
Systematic traders using custom alert levels for automated signal generation.

Ultra Supply & DemandUltra Supply and Demand fixed.
Order Block Detection: Identifies potential order blocks (demand/supply zones)

Aggregated Open Interest🔰 Aggregated Open Interest — Multi-Exchange + Base/USD Denomination Control
By
This indicator was created to aggregate all available Open Interest (OI) data on TradingView across major crypto futures exchanges, providing a complete, real-time view of leveraged capital flow in the market.
It includes a powerful denomination toggle:
Base Denomination (default): shows OI in terms of the base asset (e.g., BTC, ETH)
USD Denomination: converts all OI values into USD using the real-time price
📦 Aggregates Open Interest from:
Binance (USDT, USD, and USDC contracts)
BitMEX (USD and USDT contracts)
Kraken (USD contracts)
OKX (USDT and USD contracts)
🆕 This script is designed to be updated continuously as TradingView adds new exchanges or instruments with _OI data. Any new OI source will be added in future updates automatically.
🧠 How to use it:
This indicator works on any chart — spot, perpetual, or otherwise — including BTC, ETH, altcoins, etc.
The OI data is pulled directly from supported futures contracts using request.security() — regardless of the current chart type.
🔍 Why Open Interest matters:
🔺 Rising OI with price: indicates new positions (breakouts or trend continuation)
🔻 Falling OI after strong move: suggests liquidations or profit taking
🔄 Divergences between price and OI (e.g., price up but OI down) often signal trend exhaustion
🧠 Use OI candles to analyze how leverage evolved within each bar (not just at the close)
💥 Spikes in OI wicks may reflect aggressive shorting or margin pressure
⚙️ Features:
✅ Aggregates OI from multiple exchanges
⚖️ Toggle between Base and USD denomination
📊 Real Open Interest Candlesticks (OHLC)
🧩 Modular: turn individual exchanges on/off
🛠️ Fully compatible with any crypto symbol, including spot and perp charts
Note: The indicator does not require you to apply it to a futures contract. It works on any symbol. The Open Interest data is fetched from _OI contracts internally, using request.security().
Telegram :
t.me

Multi-Timeframe Bands (final, with labels)This is a simple Kelt style Band indicator draws colored horizontal bands representing the high (top) and low (bottom) for each of the following timeframes:
4h: Blue (bottom), Red (top)
1D: Gold (bottom/top)
1W: Purple (bottom/top)
1M: Orange (bottom/top)
Quarterly: Light purple (bottom/top)
The script works on any chart timeframe, and the bands will update dynamically.

Check List RSI Đồng Thuận Liền Kề + Gợi ý + Âm thanh + Vùngvào lệnh khung m15 Vợi sự đồng thuận của RSI ở các khung lớn hơn và nhỏ hơn liền kề : m5, m15,h1,h4

Multiple MAs for Daily and IntradayMultiple DMAs (5, 8, 10, 21, 50, 65, 200) and their equivalent in lower timeframes (3min, 30min, 65min) with the options to select from SMA or EMA.

Daily, Weekly, Monthly Current/Average RangeThe "Daily, Weekly, Monthly Current/Average Range" calculates and displays current and average price ranges (high - low) for daily, weekly, and monthly timeframes in a customizable table.
Users can adjust the lookback period, table size, and font color, with the table updating on the last bar for efficiency.
When the current range exceeds the average for a timeframe, the corresponding cell highlights green, signaling price possibly reaching maximum expansion and potential retracement or consolidation may follow.
