Asset Premium/Discount Monitor📊 Overview
The Asset Premium/Discount Monitor is a tool for analyzing the relative value between two correlated assets. It measures when one asset is trading at a premium or discount compared to its historical relationship with another asset, helping traders identify potential mean reversion opportunities, or pairs trading opportunities.
🎯 Use Cases
Perfect for analyzing:
NASDAQ:MSTR vs CRYPTO:BTCUSD - MicroStrategy's premium/discount to Bitcoin
NASDAQ:COIN vs BITSTAMP:BTCUSD - Coinbase's relative value to Bitcoin
NASDAQ:TSLA vs NASDAQ:QQQ - Tesla's premium to tech sector
Regional banks AMEX:KRE vs AMEX:XLF - Individual bank stocks vs financial sector
Any two correlated assets where relative value matters
Example of a trade: MSTR vs BTC - When indicator shows MSTR at 95% percentile (extreme premium): Short MSTR, Buy BTC. Then exit when the spread reverts to the mean, say 40-60% percentile.
🔧 How It Works
Core Calculation
Ratio Analysis: Calculates the price ratio between your asset and the correlated asset
Historical Baseline: Establishes the "normal" relationship using a 252-day moving average. You can change this.
Premium Measurement: Measures current deviation from historical average as a percentage
Statistical Context: Provides percentile rankings and standard deviation bands
The Math
Premium % = (Current Ratio / Historical Average Ratio - 1) × 100
🎨 Customization Options
Correlated Asset: Choose any symbol for comparison
Lookback Period: Adjust historical baseline (50-1000 days)
Smoothing: Reduce noise with moving average (1-50 days)
Visual Toggles: Show/hide bands and percentile lines
Color Themes: Customize premium/discount colors
📊 Interpretation Guide
Premium/Discount Reading
Positive %: Asset trading above historical relationship (premium)
Negative %: Asset trading below historical relationship (discount)
Near 0%: Asset at fair value relative to correlation
Percentile Ranking
90%+: Near recent highs - potential selling opportunity
10% and below: Near recent lows - potential buying opportunity
25-75%: Normal trading range
Signal Classifications
🔴 SELL PREMIUM: Asset expensive relative to recent range
🟡 Premium Rich: Moderately expensive, monitor for reversal
⚪ NEUTRAL: Fair value territory
🟡 Discount Opportunity: Moderately cheap, potential accumulation zone
🟢 BUY DISCOUNT: Asset cheap relative to recent range
🚨 Built-in Alerts
Extreme Premium Alert: Triggers when percentile > 95%
Extreme Discount Alert: Triggers when percentile < 5%
⚠️ Important Notes
Works best with highly correlated assets
Historical relationships can change - monitor correlation strength
Not investment advice - use as one factor in your analysis
Backtest thoroughly before implementing any strategy
🔄 Updates & Future Features
This indicator will be continuously improved based on user feedback. So... please give me your feedback!
Regressions

Market to NAV Premium Arbitrage Alpha IndicatorMARKET TO NAV PREMIUM ARBITRAGE ALPHA INDICATOR
A quantitative tool for identifying statistical mispricings between market capitalization and net asset value (NAV), designed specifically for arbitrage strategies and alpha generation in Bitcoin-holding companies like MicroStrategy (MSTR), companies or SPACS used mostly to hold crypto, Bitcoin ETFs, and other NAV-based instruments. Can probably be also used in certain spin-offs.
📊 KEY FEATURES:
✅ Real-time Premium/Discount Calculation
• Automatically retrieves market cap data from TradingView
• Calculates precise NAV based on underlying asset holdings
• Formula: (Market Cap - NAV) / NAV × 100
✅ Statistical Analysis Framework
• Historical percentile rankings (customizable lookback period)
• Standard deviation bands (2σ) for extreme value detection
• Smoothing options to reduce noise
✅ Multi-Source Market Cap Detection
• Priority system: TradingView data → Calculated → Manual override
• Automatic fallback mechanisms for data reliability
✅ Advanced NAV Modeling
• Basic NAV: Asset holdings + cash
• Adjusted NAV: Includes software business value, debt, preferred shares. If the company has a lot of this kind of intrinsic value, put it in the "cash" field
• Support for any underlying asset (BTC, ETH, etc.)
📈 TRADING APPLICATIONS:
🎯 Pairs Trading Signals
• Long/Short opportunities when premium reaches statistical extremes
• Mean reversion strategies based on historical ranges
• Risk-adjusted position sizing using percentile ranks
🎯 Arbitrage Detection
• Identifies when market pricing significantly deviates from fair value
• Quantifies the magnitude of mispricing for profit potential
• Historical context for timing entry/exit points
🔧 CONFIGURATION OPTIONS:
• Underlying Asset: Any symbol (default: COINBASE:BTCUSD) NEED MANUAL INPUT
• Asset Quantity: Precise holdings amount. NEED MANUAL INPUT
• Cash Holdings: Additional liquid assets. NEED MANUAL INPUT
• Market Cap Mode: Auto-detect, calculated, or manual
• Advanced Adjustments: Business value, debt, preferred shares
• Display Settings: Lookback period, smoothing, custom colors
🎯 PERFECT FOR:
• Quantitative traders focused on statistical arbitrage
• Institutional investors monitoring NAV-based instruments
• Bitcoin ETF and MSTR traders seeking alpha generation
• Risk managers tracking premium/discount exposures
• Academic researchers studying market efficiency (as you can see, markets are not efficient 😉)
🔗 CONNECT & SUPPORT:
Follow for updates and additional quantitative trading tools. Feedback and suggestions welcome!

Adj Momentum (3M / 6M / 12M)Mirza Salman Volatility Adjusted Momentum.
The Volatility Adjusted Momentum Indicator distills a security’s recent performance into a single, decision-ready metric that captures both the velocity and the reliability of its trend. By simultaneously rewarding sustained price appreciation and discounting erratic fluctuations, the indicator highlights those stocks that are not only advancing but doing so with a consistent, low-volatility profile—attributes typically favoured by quantitative momentum and trend-following frameworks. A high positive reading points to instruments exhibiting strong, orderly upward trajectories, making them prime candidates for capital allocation in momentum-oriented portfolios. Conversely, muted or negative readings reveal markets whose returns have been lacklustre, unstable, or downward-sloping, signalling that they warrant caution or exclusion. In practice, this indicator enables portfolio managers and traders to rank broad watch-lists swiftly, focus due-diligence on the most robust price leaders, and enforce systematic discipline in scaling back exposure to choppier, less reliable names—all without resorting to subjective chart interpretation or ad-hoc volatility filters.


[TupTrader] rsi flow band | RSI Reversals ⚡️🎯 : RSI Flow Band — Section Descriptions
🟢 1) RSI Candle & Line
💡 What is it?
This module visualizes the RSI as candlesticks instead of a single line. Each RSI candle has its own open, high, low, and close — just like a price candle — but mapped inside the RSI scale.
It reveals hidden RSI dynamics: wicks, bodies, and the range of strength shifts within a single price candle.
🔍 How it works:
RSI open uses the open price.
RSI high uses the high price.
RSI low uses the low price.
RSI close uses the close price.
When RSI close > RSI open, it plots a bullish RSI candle; otherwise, a bearish one.
Additionally, you can enable a classic RSI line based on close prices to compare.
💪 Pro Tip:
When you see a long wick on an RSI candle but a small body, it can signal indecision or a potential turning point — just like with price action.
⚡️ Best use:
Perfect for scalpers wanting to confirm micro shifts in momentum or hidden divergences that a simple line can’t show.
🔵 2) RSI Regression Candles
💡 What is it?
This tool takes the same RSI candles and smooths them with a linear regression calculation.
It helps reduce RSI noise and clarifies the underlying momentum flow, giving you a trend bias overlay for your reversals.
🔍 How it works:
Each RSI open/high/low/close is processed through a linear regression function with adjustable length.
If the regression candle is bullish, you get a blue candle; if bearish, yellow.
💪 Pro Tip:
Use these smoothed candles to avoid getting trapped in fake reversals during choppy sideways markets.
⚡️ Best use:
Combine with the raw RSI candles. For example, if raw candles suggest a reversal but the regression stays steady, you may want to wait for confirmation.
🌊 3) Flow Bands (Outside & Inside)
💡 What is it?
Flow Bands build dynamic support and resistance zones around RSI action.
Outside Flow Band: A wide fence to contain major RSI tops and bottoms — like an adaptive extreme zone.
Inside Flow Band: A tighter channel that captures both minor and major swings, keeping RSI ‘floating’ inside the band to reveal pullbacks and smaller corrections.
🔍 How it works:
Outside Band is calculated using major RSI swing points and is independent of the multiplier.
Inside Band uses the multiplier to adjust its width dynamically.
Both bands use moving averages and custom smoothing logic to adapt to current volatility.
💪 Pro Tip:
Price moving outside the Outside Band can indicate exhaustion and a high probability of a major reversal.
Inside Band breaches can signal minor pullbacks or good spots to scale in/out with divergence confirmation.
⚡️ Best use:
Scalpers → Inside Band for fast moves.
Swing traders → Outside Band for larger trend shifts.
🚦 4) Static Overzone
💡 What is it?
These are classic RSI overbought/oversold levels, visualized as static bands instead of flat lines.
Traditionally, RSI 70 and 30 are the default, but you can fine-tune the p parameter to tighten or widen these zones.
🔍 How it works:
The upper/lower bands are offset by p, letting you adapt the static levels to match current market conditions.
💪 Pro Tip:
In a trending market, widening the zone helps avoid false reversal signals.
In a range, tightening the zone makes your signals sharper.
⚡️ Best use:
Use Static Overzones as a baseline. Combine them with Dynamic Overzones and Flow Bands for multi-layered confirmation.
🔄 5) Dynamic Overzone
💡 What is it?
Unlike the Static Overzone, this level floats and adapts to RSI behavior in real time.
It’s not fixed at 30/70 — it expands or contracts based on recent RSI dynamics, making it more responsive to changing volatility.
🔍 How it works:
Dynamic levels are calculated with a custom QQE smoothing function and multi-level averaging to create a zone with layered confidence bands.
You get multiple dynamic levels (+3, +2, +1, 0, -1, -2, -3) to spot deeper or weaker extremes.
💪 Pro Tip:
Watch for RSI pushing into outer dynamic bands (+3/-3) — this indicates strong momentum that may soon revert, especially when combined with divergence.
⚡️ Best use:
Pairs perfectly with Flow Bands: when RSI hits a Dynamic Overzone and a Flow Band edge at the same time, the probability of a strong reversal is higher.
🔍 6) Swing High-Low Bands & Reversal Signals
💡 What is it?
This plots key RSI swing highs and lows as levels. It also adds optional reversal signal markers (triangles) when RSI crosses these bands.
⚠️ Important:
These markers are NOT direct entry signals! They highlight potential pivot points where reversals may occur, but you should always wait for confirmation with price action or other tools.
💪 Pro Tip:
These swing bands are especially powerful when used with divergence setups — look for RSI to make a new swing high while price does not (or vice versa).
⚡️ Best use:
Use as an early warning system — if other confirmations align, the swing cross can be your final check.
✅ Full Transparency & Good Practices
Each layer is toggleable. Turn on/off what fits your style.
Tooltips inside the script explain every input clearly.
The default settings are tested for a balanced view, but adjust as needed.
This suite works for both scalping and swing trading, but RSI alone does not predict trend direction — it only measures momentum strength. Always use in context!

Fakeout Ex-GirlfriendBecause "Just Buy the Dip" Isn't a Strategy.
Welcome to Sweep N Cry™, the only indicator brave enough to admit it's just guessing — but doing it with style, math, and occasional market sorcery.
Built using a top-secret blend of trend-following wizardry, smart money voodoo, and a sprinkle of "please-don’t-repaint," this tool gives you crystal-clear BUY and SELL signals right before your emotions tell you to do the exact opposite.
What It Does:
BUY when retail panic is peaking and the smart money is loading up.
SELL when influencers say, “It’s going to the moon.”
Ignores RSI, ADX, and other indicators your uncle used in 2006.
Filters out chop so well you’ll forget sideways markets exist.
Built-in logic to avoid chasing green candles like a rookie.
What It's Not:
It’s not laggy.
It’s not a repainting magician.
And it’s definitely not designed for traders who enjoy getting stopped out right before price moons.
Ideal For:
Traders who want clear entries without 47 indicators on the chart.
Scalpers, swing traders, or degenerates trading gold at 3AM.
People tired of “signals” that look like confetti after a pump & dump.
Bonus Features:
Built-in “Common Sense Filter”™ (disabled by default).
Alerts so fast they may trigger your existential crisis.
Trend bias so smart it might write your trading journal for you.

52SIGNAL RECIPE CCI Linreg Bands═══ 52SIGNAL RECIPE CCI Linreg Bands ═══
◆ Overview
52SIGNAL RECIPE CCI Linreg Bands is an advanced technical indicator that combines the CCI (Commodity Channel Index) with Linear Regression Bands. This indicator visualizes the volatility of the CCI using linear regression bands, helping to clearly identify overbought/oversold areas and more accurately capture potential trend reversal points.
─────────────────────────────────────
◆ Key Features
• CCI-Based Overbought/Oversold Analysis: Uses the traditional CCI indicator to identify overbought/oversold conditions in the market
• Integrated Linear Regression Bands: Applies linear regression analysis to the CCI to visually represent the direction and strength of trends
• Dual Overbought/Oversold Levels: Sets overbought/oversold levels for both CCI and Linear Regression Bands to increase the accuracy of signals
• Advanced Visualization: Intuitive chart analysis is possible with color changes according to trend direction and clear band display
• Multiple Alert Settings: Alert functions for various conditions ensure you don't miss important trading moments
─────────────────────────────────────
◆ Technical Foundation
■ CCI (Commodity Channel Index)
• Basic Settings: 20-period CCI with Weighted Moving Average (WMA) applied
• Calculation Method: Measures the deviation from the average price normalized to a specific range
• Overbought/Oversold Levels: Default values set to +150 (overbought) and -150 (oversold)
■ Linear Regression Bands
• Period: Default value of 100 days
• Deviation: Default value of 4.5 standard deviations
• Center Line: The center line of the linear regression analysis for the CCI values
• Band Width: Displays the range of volatility around the center line based on the calculated standard deviation
• Overbought/Oversold Levels: Default values set to +250 (overbought) and -250 (oversold)
─────────────────────────────────────
◆ Practical Applications
■ Identifying Trading Signals
• Buy Signal:
▶ When the CCI falls below the oversold level (-150)
▶ When the lower band of the Linear Regression Bands falls below the oversold level (-250)
▶ When both conditions are met simultaneously (extreme oversold state) - a strong buy signal
• Sell Signal:
▶ When the CCI rises above the overbought level (+150)
▶ When the upper band of the Linear Regression Bands rises above the overbought level (+250)
▶ When both conditions are met simultaneously (extreme overbought state) - a strong sell signal
■ Trend Analysis
• Uptrend: When the linear regression center line is rising and the CCI is moving above the zero line
• Downtrend: When the linear regression center line is falling and the CCI is moving below the zero line
• Trend Strength: The wider the gap between the bands, the greater the volatility; the narrower, the more stable the trend
■ Divergence Confirmation
• Bearish Divergence: Price forms a new high, but the CCI is lower than the previous high (potential bearish signal)
• Bullish Divergence: Price forms a new low, but the CCI is higher than the previous low (potential bullish signal)
─────────────────────────────────────
◆ Advanced Setting Options
■ CCI Setting Adjustments
• CCI Source: Selectable options include Close (default), Open, High, Low, HL2, HLC3, OHLC4, etc.
• CCI Length: Adjust to lower values for short-term volatility, higher values for long-term trends
■ Linear Regression Setting Adjustments
• Period: Use lower values (20-50) for short-term analysis, higher values (100-200) for long-term analysis
• Deviation: Higher values create wider bands (more signals), lower values create narrower bands (more accurate signals)
■ Overbought/Oversold Level Adjustments
• CCI Levels: Adjust to more extreme values (±200) in highly volatile markets
• Linear Regression Band Levels: Adjustable to ±300 or ±200 depending on market conditions
─────────────────────────────────────
◆ Synergy with Other Indicators
• Bollinger Bands: Use alongside Bollinger Bands on the price chart to compare price volatility with CCI volatility
• MACD: Use with MACD for momentum and trend confirmation
• Fibonacci Retracement: Check CCI Linreg Bands signals with key support/resistance levels
• Moving Averages: Combine moving average crossovers with CCI Linreg Bands signals to improve reliability
─────────────────────────────────────
◆ Conclusion
52SIGNAL RECIPE CCI Linreg Bands provides a powerful and accurate technical analysis tool by combining traditional CCI with linear regression analysis. The dual overbought/oversold system increases the accuracy of trading signals and clearly visualizes trend direction and strength to help traders make decisions. You can achieve optimal results by adjusting various settings to match your trading style and market conditions.
─────────────────────────────────────
※ Disclaimer: Past performance does not guarantee future results. Always use appropriate risk management strategies.
═══ 52SIGNAL RECIPE CCI 선형회귀 밴드 ═══
◆ 개요
52SIGNAL RECIPE CCI 선형회귀 밴드는 CCI(Commodity Channel Index)와 선형회귀 밴드를 결합한 고급 기술적 지표입니다. 이 지표는 선형회귀 밴드를 사용하여 CCI의 변동성을 시각화하여 과매수/과매도 영역을 명확하게 식별하고 잠재적인 추세 반전 지점을 더 정확하게 포착하는 데 도움을 줍니다.
─────────────────────────────────────
◆ 주요 특징
• CCI 기반 과매수/과매도 분석: 전통적인 CCI 지표를 사용하여 시장의 과매수/과매도 상태를 식별
• 통합된 선형회귀 밴드: CCI에 선형회귀 분석을 적용하여 추세의 방향과 강도를 시각적으로 표현
• 이중 과매수/과매도 레벨: CCI와 선형회귀 밴드 모두에 과매수/과매도 레벨을 설정하여 신호의 정확도 향상
• 고급 시각화: 추세 방향에 따른 색상 변화와 명확한 밴드 표시로 직관적인 차트 분석 가능
• 다중 알림 설정: 다양한 조건에 대한 알림 기능으로 중요한 트레이딩 시점을 놓치지 않도록 보장
─────────────────────────────────────
◆ 기술적 기반
■ CCI (Commodity Channel Index)
• 기본 설정: 20기간 CCI에 가중이동평균(WMA) 적용
• 계산 방법: 평균 가격에 대한 편차를 측정하여 정규화한 값으로 표현
• 과매수/과매도 레벨: 기본값으로 +150(과매수)과 -150(과매도) 설정
■ 선형회귀 밴드
• 기간: 기본값 100일
• 편차: 기본값 4.5 표준편차
• 중심선: CCI 값에 대한 선형회귀 분석의 중심선
• 밴드 폭: 계산된 표준편차에 기반하여 중심선 주변의 변동성 범위 표시
• 과매수/과매도 레벨: 기본값으로 +250(과매수)와 -250(과매도) 설정
─────────────────────────────────────
◆ 실용적 응용
■ 트레이딩 신호 식별
• 매수 신호:
▶ CCI가 과매도 레벨(-150) 아래로 떨어질 때
▶ 선형회귀 밴드의 하단이 과매도 레벨(-250) 아래로 떨어질 때
▶ 두 조건이 동시에 충족될 때(극단적 과매도 상태) - 강한 매수 신호
• 매도 신호:
▶ CCI가 과매수 레벨(+150) 위로 상승할 때
▶ 선형회귀 밴드의 상단이 과매수 레벨(+250) 위로 상승할 때
▶ 두 조건이 동시에 충족될 때(극단적 과매수 상태) - 강한 매도 신호
■ 추세 분석
• 상승 추세: 선형회귀 중심선이 상승하고 CCI가 0선 위로 움직일 때
• 하락 추세: 선형회귀 중심선이 하락하고 CCI가 0선 아래로 움직일 때
• 추세 강도: 밴드 사이의 간격이 넓을수록 변동성이 크고, 좁을수록 추세가 안정적
■ 다이버전스 확인
• 약세 다이버전스: 가격이 신고점을 형성하지만 CCI가 이전 고점보다 낮을 때(잠재적 약세 신호)
• 강세 다이버전스: 가격이 신저점을 형성하지만 CCI가 이전 저점보다 높을 때(잠재적 강세 신호)
─────────────────────────────────────
◆ 고급 설정 옵션
■ CCI 설정 조정
• CCI 소스: 선택 가능한 옵션에는 종가(기본값), 시가, 고가, 저가, HL2, HLC3, OHLC4 등이 포함
• CCI 길이: 단기 변동성을 위해 낮은 값으로, 장기 추세를 위해 높은 값으로 조정
■ 선형회귀 설정 조정
• 기간: 단기 분석을 위해 낮은 값(20-50), 장기 분석을 위해 높은 값(100-200) 사용
• 편차: 높은 값은 더 넓은 밴드(더 많은 신호), 낮은 값은 더 좁은 밴드(더 정확한 신호) 생성
■ 과매수/과매도 레벨 조정
• CCI 레벨: 변동성이 큰 시장에서는 더 극단적인 값(±200)으로 조정
• 선형회귀 밴드 레벨: 시장 상황에 따라 ±300 또는 ±200으로 조정 가능
─────────────────────────────────────
◆ 다른 지표와의 시너지
• 볼린저 밴드: 가격 차트의 볼린저 밴드와 함께 사용하여 가격 변동성과 CCI 변동성 비교
• MACD: 모멘텀과 추세 확인을 위해 MACD와 함께 사용
• 피보나치 되돌림: CCI 선형회귀 밴드 신호를 주요 지지/저항 레벨과 함께 확인
• 이동평균선: 이동평균 교차와 CCI 선형회귀 밴드 신호를 결합하여 신뢰성 향상
─────────────────────────────────────
◆ 결론
52SIGNAL RECIPE CCI 선형회귀 밴드는 전통적인 CCI와 선형회귀 분석을 결합하여 강력하고 정확한 기술적 분석 도구를 제공합니다. 이중 과매수/과매도 시스템은 트레이딩 신호의 정확도를 높이고 추세 방향과 강도를 명확하게 시각화하여 트레이더의 의사 결정을 돕습니다. 다양한 설정을 트레이딩 스타일과 시장 상황에 맞게 조정하여 최적의 결과를 얻을 수 있습니다.
─────────────────────────────────────
※ 면책 조항: 과거 성과가 미래 결과를 보장하지 않습니다. 항상 적절한 리스크 관리 전략을 사용하세요.

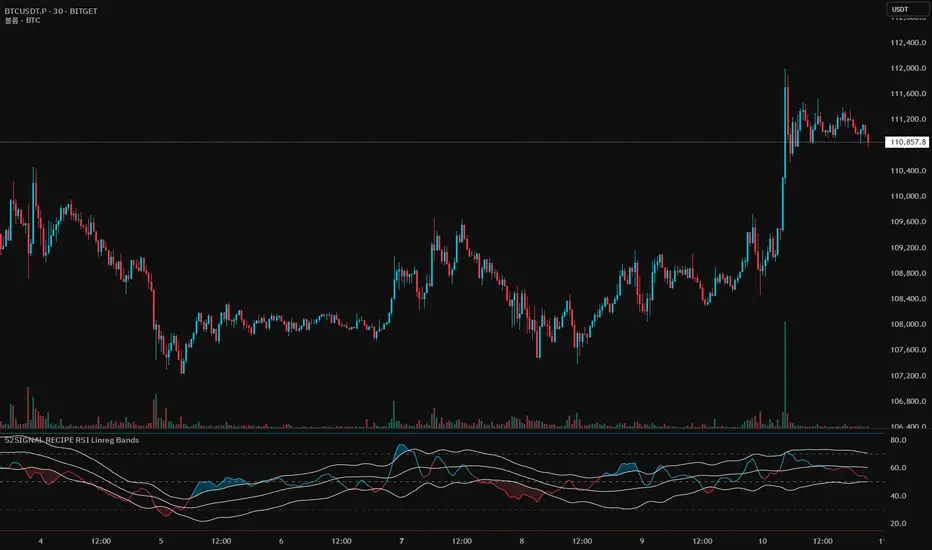
52SIGNAL RECIPE RSI Linreg Bands═══ 52SIGNAL RECIPE RSI Linreg Bands ═══
◆ Overview
52SIGNAL RECIPE RSI Linreg Bands is an advanced technical indicator that combines the RSI (Relative Strength Index) with Linear Regression Bands. This indicator visualizes the volatility of the RSI using linear regression bands, helping to clearly identify overbought/oversold areas and more accurately capture potential trend reversal points.
─────────────────────────────────────
◆ Key Features
• RSI-Based Overbought/Oversold Analysis: Uses the traditional RSI indicator to identify overbought/oversold conditions in the market
• Integrated Linear Regression Bands: Applies linear regression analysis to the RSI to visually represent the direction and strength of trends
• Dual Overbought/Oversold Levels: Sets overbought/oversold levels for both RSI and Linear Regression Bands to increase the accuracy of signals
• Advanced Visualization: Intuitive chart analysis is possible with color changes according to trend direction and clear band display
• Multiple Alert Settings: Alert functions for various conditions ensure you don't miss important trading moments
─────────────────────────────────────
◆ Technical Foundation
■ RSI (Relative Strength Index)
• Basic Settings: 14-period RSI with 5-period Weighted Moving Average (WMA) applied
• Calculation Method: Measures the relative strength of gains and losses, expressed as a value between 0-100
• Overbought/Oversold Levels: Default values set to 70 (overbought) and 30 (oversold)
■ Linear Regression Bands
• Period: Default value of 100 days
• Deviation: Default value of 2.5 standard deviations
• Center Line: The center line of the linear regression analysis for the RSI values
• Band Width: Displays the range of volatility around the center line based on the calculated standard deviation
• Overbought/Oversold Levels: Default values set to 85 (overbought) and 15 (oversold)
─────────────────────────────────────
◆ Practical Applications
■ Identifying Trading Signals
• Buy Signal:
▶ When the RSI falls below the oversold level (30)
▶ When the lower band of the Linear Regression Bands falls below the oversold level (15)
▶ When both conditions are met simultaneously (extreme oversold state) - a strong buy signal
• Sell Signal:
▶ When the RSI rises above the overbought level (70)
▶ When the upper band of the Linear Regression Bands rises above the overbought level (85)
▶ When both conditions are met simultaneously (extreme overbought state) - a strong sell signal
■ Trend Analysis
• Uptrend: When the linear regression center line is rising and the RSI is moving above the midline (50)
• Downtrend: When the linear regression center line is falling and the RSI is moving below the midline (50)
• Trend Strength: The wider the gap between the bands, the greater the volatility; the narrower, the more stable the trend
■ Divergence Confirmation
• Bearish Divergence: Price forms a new high, but the RSI is lower than the previous high (potential bearish signal)
• Bullish Divergence: Price forms a new low, but the RSI is higher than the previous low (potential bullish signal)
─────────────────────────────────────
◆ Advanced Setting Options
■ RSI Setting Adjustments
• RSI Source: Selectable options include Close (default), Open, High, Low, HL2, HLC3, OHLC4, etc.
• RSI Length: Adjust to lower values for short-term volatility, higher values for long-term trends
■ Linear Regression Setting Adjustments
• Period: Use lower values (20-50) for short-term analysis, higher values (100-200) for long-term analysis
• Deviation: Higher values create wider bands (more signals), lower values create narrower bands (more accurate signals)
■ Overbought/Oversold Level Adjustments
• RSI Levels: Adjust to more extreme values (80/20) in highly volatile markets
• Linear Regression Band Levels: Adjustable to 90/10 or 80/20 depending on market conditions
─────────────────────────────────────
◆ Synergy with Other Indicators
• Bollinger Bands: Use alongside Bollinger Bands on the price chart to compare price volatility with RSI volatility
• MACD: Use with MACD for momentum and trend confirmation
• Fibonacci Retracement: Check RSI Linreg Bands signals with key support/resistance levels
• Moving Averages: Combine moving average crossovers with RSI Linreg Bands signals to improve reliability
─────────────────────────────────────
◆ Conclusion
52SIGNAL RECIPE RSI Linreg Bands provides a powerful and accurate technical analysis tool by combining traditional RSI with linear regression analysis. The dual overbought/oversold system increases the accuracy of trading signals and clearly visualizes trend direction and strength to help traders make decisions. You can achieve optimal results by adjusting various settings to match your trading style and market conditions.
─────────────────────────────────────
※ Disclaimer: Past performance does not guarantee future results. Always use appropriate risk management strategies.
═══ 52SIGNAL RECIPE RSI 선형회귀 밴드 ═══
◆ 개요
52SIGNAL RECIPE RSI 선형회귀 밴드는 RSI(상대강도지수)와 선형회귀 밴드를 결합한 고급 기술적 지표입니다. 이 지표는 선형회귀 밴드를 사용하여 RSI의 변동성을 시각화하여 과매수/과매도 영역을 명확하게 식별하고 잠재적인 추세 반전 지점을 더 정확하게 포착하는 데 도움을 줍니다.
─────────────────────────────────────
◆ 주요 특징
• RSI 기반 과매수/과매도 분석: 전통적인 RSI 지표를 사용하여 시장의 과매수/과매도 상태를 식별
• 통합된 선형회귀 밴드: RSI에 선형회귀 분석을 적용하여 추세의 방향과 강도를 시각적으로 표현
• 이중 과매수/과매도 레벨: RSI와 선형회귀 밴드 모두에 과매수/과매도 레벨을 설정하여 신호의 정확도 향상
• 고급 시각화: 추세 방향에 따른 색상 변화와 명확한 밴드 표시로 직관적인 차트 분석 가능
• 다중 알림 설정: 다양한 조건에 대한 알림 기능으로 중요한 트레이딩 시점을 놓치지 않도록 보장
─────────────────────────────────────
◆ 기술적 기반
■ RSI (상대강도지수)
• 기본 설정: 14기간 RSI에 5기간 가중이동평균(WMA) 적용
• 계산 방법: 상승과 하락의 상대적 강도를 측정하여 0-100 사이의 값으로 표현
• 과매수/과매도 레벨: 기본값으로 70(과매수)과 30(과매도) 설정
■ 선형회귀 밴드
• 기간: 기본값 100일
• 편차: 기본값 2.5 표준편차
• 중심선: RSI 값에 대한 선형회귀 분석의 중심선
• 밴드 폭: 계산된 표준편차에 기반하여 중심선 주변의 변동성 범위 표시
• 과매수/과매도 레벨: 기본값으로 85(과매수)와 15(과매도) 설정
─────────────────────────────────────
◆ 실용적 응용
■ 트레이딩 신호 식별
• 매수 신호:
▶ RSI가 과매도 레벨(30) 아래로 떨어질 때
▶ 선형회귀 밴드의 하단이 과매도 레벨(15) 아래로 떨어질 때
▶ 두 조건이 동시에 충족될 때(극단적 과매도 상태) - 강한 매수 신호
• 매도 신호:
▶ RSI가 과매수 레벨(70) 위로 상승할 때
▶ 선형회귀 밴드의 상단이 과매수 레벨(85) 위로 상승할 때
▶ 두 조건이 동시에 충족될 때(극단적 과매수 상태) - 강한 매도 신호
■ 추세 분석
• 상승 추세: 선형회귀 중심선이 상승하고 RSI가 중간선(50) 위로 움직일 때
• 하락 추세: 선형회귀 중심선이 하락하고 RSI가 중간선(50) 아래로 움직일 때
• 추세 강도: 밴드 사이의 간격이 넓을수록 변동성이 크고, 좁을수록 추세가 안정적
■ 다이버전스 확인
• 약세 다이버전스: 가격이 신고점을 형성하지만 RSI가 이전 고점보다 낮을 때(잠재적 약세 신호)
• 강세 다이버전스: 가격이 신저점을 형성하지만 RSI가 이전 저점보다 높을 때(잠재적 강세 신호)
─────────────────────────────────────
◆ 고급 설정 옵션
■ RSI 설정 조정
• RSI 소스: 선택 가능한 옵션에는 종가(기본값), 시가, 고가, 저가, HL2, HLC3, OHLC4 등이 포함
• RSI 길이: 단기 변동성을 위해 낮은 값으로, 장기 추세를 위해 높은 값으로 조정
■ 선형회귀 설정 조정
• 기간: 단기 분석을 위해 낮은 값(20-50), 장기 분석을 위해 높은 값(100-200) 사용
• 편차: 높은 값은 더 넓은 밴드(더 많은 신호), 낮은 값은 더 좁은 밴드(더 정확한 신호) 생성
■ 과매수/과매도 레벨 조정
• RSI 레벨: 변동성이 큰 시장에서는 더 극단적인 값(80/20)으로 조정
• 선형회귀 밴드 레벨: 시장 상황에 따라 90/10 또는 80/20으로 조정 가능
─────────────────────────────────────
◆ 다른 지표와의 시너지
• 볼린저 밴드: 가격 차트의 볼린저 밴드와 함께 사용하여 가격 변동성과 RSI 변동성 비교
• MACD: 모멘텀과 추세 확인을 위해 MACD와 함께 사용
• 피보나치 되돌림: RSI 선형회귀 밴드 신호를 주요 지지/저항 레벨과 함께 확인
• 이동평균선: 이동평균 교차와 RSI 선형회귀 밴드 신호를 결합하여 신뢰성 향상
─────────────────────────────────────
◆ 결론
52SIGNAL RECIPE RSI 선형회귀 밴드는 전통적인 RSI와 선형회귀 분석을 결합하여 강력하고 정확한 기술적 분석 도구를 제공합니다. 이중 과매수/과매도 시스템은 트레이딩 신호의 정확도를 높이고 추세 방향과 강도를 명확하게 시각화하여 트레이더의 의사 결정을 돕습니다. 다양한 설정을 트레이딩 스타일과 시장 상황에 맞게 조정하여 최적의 결과를 얻을 수 있습니다.
─────────────────────────────────────
※ 면책 조항: 과거 성과가 미래 결과를 보장하지 않습니다. 항상 적절한 리스크 관리 전략을 사용하세요.


Market Dashboard by MohammadKamangari**داشبورد تحلیل وضعیت بازار**
این یک اندیکاتور جامع برای تحلیل سریع وضعیت بازار است و به عنوان یک داشبورد عمل میکند. این ابزار به جای دادن سیگنال مستقیم خرید یا فروش، اطلاعات کلیدی از چند اندیکاتور مهم را به صورت خلاصه و بصری نمایش میدهد تا به معاملهگر در تصمیمگیری آگاهانه کمک کند.
**ویژگیهای اصلی:**
* **جدول وضعیت بازار:** یک جدول خوانا در گوشه چارت که وضعیت روند، مومنتوم و قدرت روند را در یک نگاه نمایش میدهد.
* **روند (EMA):** بر اساس تقاطع دو میانگین متحرک، جهت کلی بازار (صعودی/نزولی) را مشخص میکند.
* **RSI:** وضعیت مومنتوم و حالتهای اشباع خرید/فروش را نشان میدهد.
* **ADX:** بین بازار دارای روند قوی و بازار خنثی (رنج) تمایز قائل میشود.
* **سطوح حمایت و مقاومت خودکار:** این اندیکاتور به صورت خودکار آخرین سقفها و کفهای قیمتی مهم (نقاط پیوت) را به عنوان سطوح مقاومت (دایرههای قرمز) و حمایت (دایرههای سبز) روی چارت مشخص میکند.
**نحوه استفاده:**
بهترین روش استفاده از این داشبورد، جستجوی "تایید" از چند شاخص به طور همزمان است. برای مثال، یک سیگنال خرید قوی زمانی است که جدول، روند صعودی، مومنتوم صعودی و روند قوی را نشان دهد و همزمان قیمت در حال شکستن یک سطح مقاومت باشد
**Market Status Analysis Dashboard**
This is a comprehensive indicator that acts as a dashboard for quickly analyzing the current market state. Instead of providing direct buy or sell signals, it summarizes key information from several important indicators into a visual format to aid in a trader's discretionary decision-making process.
**Key Features:**
* **Market Status Table:** A clean on-screen table that provides an at-a-glance summary of the trend, momentum, and trend strength.
* **Trend (EMA):** Determines the overall market direction (Bullish/Bearish) based on a dual-EMA crossover.
* **RSI:** Shows momentum status and Overbought/Oversold conditions.
* **ADX:** Differentiates between a strong, trending market and a neutral, range-bound market.
* **Automatic Support & Resistance Levels:** The indicator automatically identifies and plots recent significant price highs and lows (pivot points) as Resistance (red circles) and Support (green circles) levels on the chart.
**How to Use:**
The best way to use this dashboard is to look for confluence (confirmation) from multiple indicators simultaneously. For example, a high-probability long setup occurs when the table indicates a Bullish Trend, Bullish Momentum, and a Strong Trend, while the price is simultaneously breaking a key resistance level.

P3 Malaysian SNR 3-Candle Pattern1 ∙ Core Concept
This indicator turns one of the oldest discretionary price-action ideas—“support & resistance role-reversal”—into a fully rule-based, multi-time-frame model.
It detects, marks and continuously tracks the three-candle structure that Malaysian price-action traders call the SNR 3-candle pattern:
Candle-1 sets the impulse:
bullish close → potential future resistance
bearish close → potential future support
Candle-2 immediately closes the opposite way, signalling absorption of the impulse.
Candle-3 closes in the same direction as Candle-2 and confirms the level.
The script then:
Locks the HTF price zone (high/low of Candle-3) with a horizontal level.
Colours only the first two pattern candles yellow on every timeframe so lower-TF traders can see precisely which bars created the HTF level.
What Makes It Original?
Most S/R scripts only draw one line; this overlay colours all lower-TF bars that live inside the HTF pattern, letting scalpers “zoom in” on HTF structure—an approach not found in open-source examples.
Pure Price-Action –
The logic uses only raw OHLC data; there are no MAs, RSI, BB, etc. This is not a re-skin of classic indicator code.

🔒 Skrita Znanost - Povprečje🔒 Skrita Znanost – Povprečje
Ta indikator prikazuje dinamično povprečno ceno skozi celotno zgodovino trgovalnega para ter meri trenutno odstotno odstopanje cene od tega povprečja.
Namesto tradicionalnih drsečih povprečij, ki temeljijo na določenem številu svečnikov, ta indikator uporablja kumulativno povprečje od začetka grafikona. S tem omogoča edinstven pogled na to, kako se cena trenutno nahaja v primerjavi z dolgoročnim povprečjem.
🔸 Vizualni elementi:
Oranžna črta prikazuje povprečno ceno skozi celoten časovni obseg.
Na grafu se pojavi dinamična oznaka, ki prikazuje:
Natančno vrednost povprečne cene,
Trenutno odstopanje cene v odstotkih,
Besedno razlago: pozitivno odstopanje ↑, negativno odstopanje ↓ ali brez odstopanja.
📈 Uporaba:
Indikator je uporaben za prepoznavanje potencialnih skrajnosti – ko je cena izrazito nad ali pod dolgoročnim povprečjem, lahko to nakazuje na možen odboj, korekcijo ali nadaljevanje trenda.
This indicator displays a dynamic average price across the full historical range of the selected trading pair and calculates the current percentage deviation from that long-term average.
Unlike traditional moving averages based on a fixed number of candles, this tool uses a cumulative average from the beginning of the chart. This provides a unique perspective on where the price currently stands in relation to its entire historical performance.
🔸 Visual elements:
The orange line represents the cumulative historical average price.
A dynamic label on the chart displays:
The precise value of the average price,
The current deviation in percentage,
A textual note: positive deviation ↑, negative deviation ↓, or no deviation.
📈 Usage:
This indicator is particularly useful for identifying potential extremes – when the price is significantly above or below the historical average, it may signal a possible bounce, correction, or trend continuation.


Logistic Regression ICT FVG🚀 OVERVIEW
Welcome to the Logistic Regression Fair Value Gap (FVG) System — a next-gen trading tool that blends precision gap detection with machine learning intelligence.
Unlike traditional FVG indicators, this one evolves with each bar of price action, scoring and filtering gaps based on real market behavior.
🔧 CORE FEATURES
✨ Smart Gap Detection
Automatically identifies bullish and bearish Fair Value Gaps using volatility-aware candle logic.
📊 Probability-Based Filtering
Uses logistic regression to assign each gap a confidence score (0 to 1), showing only high-probability setups.
🔁 Real-Time Retest Tracking
Continuously watches how price interacts with each gap to determine if it deserves respect.
📈 Multi-Factor Assessment
Evaluates RSI, MACD, and body size at gap formation to build a full context snapshot.
🧠 Self-Learning Engine
The logistic regression model updates on each bar using gradient descent, refining its predictions over time.
📢 Built-In Alerts
Get instant alerts when a gap forms, gets retested, or breaks.
🎨 Custom Display Options
Control the color of bullish/bearish zones, and toggle on/off probability labels for cleaner charts.
🚩 WHAT MAKES IT DIFFERENT
This isn’t just another box-drawing indicator.
While others mark every imbalance, this system thinks before it draws — using statistical modeling to filter out noise and prioritize high-impact zones.
By learning from how price behaves around gaps (not just how they form), it helps you trade only what matters — not what clutters.
⚙️ HOW IT WORKS
1️⃣ Detection
FVGs are identified using ATR-based thresholds and sharp wick imbalances.
2️⃣ Behavior Monitoring
Every gap is tracked — and if respected enough times, it becomes part of the elite training set.
3️⃣ Context Capture
Each new FVG logs RSI, MACD, and body size to provide a feature-rich context for prediction.
4️⃣ Prediction (Logistic Regression)
The model predicts how likely the gap is to be respected and assigns it a probability score.
5️⃣ Classification & Alerts
Gaps above the threshold are plotted with score labels, and alerts trigger for entry/respect/break.
⚙️ CONFIGURATION PANEL
🔧 System Inputs
• Max Retests – How many times a gap must be respected to train the model
• Prediction Threshold – Minimum score to show a gap on the chart
• Learning Rate – Controls how fast the model adapts (default: 0.009)
• Max FVG Lifetime – Expiration duration for unused gaps
• Show Historic Gaps – Show/hide expired or invalidated gaps
🎨 Visual Options
• Bullish/Bearish Colors – Set gap colors to fit your chart style
• Confidence Labels – Show probability scores next to FVGs
• Alert Toggles – Enable alerts for:
– New FVG detected
– FVG respected (entry)
– FVG invalidated (break)
💡 WHY LOGISTIC REGRESSION?
Traditional FVG tools rely on candle shapes.
This system relies on probability — by training on RSI, MACD, and price behavior, it predicts whether a gap will act as a true liquidity zone.
Logistic regression lets the system continuously adapt using new data, making it more accurate the longer it runs.
That means smarter signals, fewer false positives, and a clearer view of where real opportunities lie.

CPR + SR Breaks with OBV DivergenceCore Features
Central Pivot Range (CPR)
Plots daily pivot (CP), bottom central (BC), and top central (TC) levels.
Key for intraday support/resistance. Price reactions near these levels signal opportunities.
Support/Resistance Tools
S/R: Auto-detects swing highs/lows as dynamic support/resistance.
S/R Re-Test: Highlights retest zones with customizable aging/deletion rules.
CISD: Marks intraday structural levels (breakout points).
Trend Indicators
SuperTrend: Follows trend direction (green = uptrend, red = downtrend).
Moving Averages: Multiple EMAs/SMAs (e.g., 20, 50, 100, 200) for confluence.
VWAP: Volume-weighted average price for dynamic support/resistance.
Advanced MAs
SALMA: Adaptive moving average with volatility filter (colored by trend).
VIDYA: Smooth trend-following MA with liquidity zones.
OBV Divergence
Detects hidden divergences between price and On-Balance Volume (OBV):
Bullish Divergence: Price makes lower lows, OBV makes higher lows (green labels).
Bearish Divergence: Price makes higher highs, OBV makes lower highs (red labels).
Table at bottom-right shows divergence strength and frequency.
Trend Strength Table
Top-right table summarizes:
Trend direction (Bullish/Bearish/Sideways)
Strength (Strong/Weak)
EMA Crosses & ADX momentum
How to Trade
Breakouts:
Enter trades when price breaks S/R levels with high volume (blue/green arrows).
Confirm with CPR/TC (resistance) or CPR/BC (support) breaks.
Reversals:
Watch for OBV divergences at key S/R levels (CISD or CPR).
Combine with SuperTrend flip (e.g., green to red = sell signal).
Trend Confluence:
Trade in the direction of the trend table (e.g., "Strong Bull" + EMA cross up).
Use SALMA/VIDYA as dynamic support in uptrends (or resistance in downtrends).

Momentum Regression [BackQuant]Momentum Regression
The Momentum Regression is an advanced statistical indicator built to empower quants, strategists, and technically inclined traders with a robust visual and quantitative framework for analyzing momentum effects in financial markets. Unlike traditional momentum indicators that rely on raw price movements or moving averages, this tool leverages a volatility-adjusted linear regression model (y ~ x) to uncover and validate momentum behavior over a user-defined lookback window.
Purpose & Design Philosophy
Momentum is a core anomaly in quantitative finance — an effect where assets that have performed well (or poorly) continue to do so over short to medium-term horizons. However, this effect can be noisy, regime-dependent, and sometimes spurious.
The Momentum Regression is designed as a pre-strategy analytical tool to help you filter and verify whether statistically meaningful and tradable momentum exists in a given asset. Its architecture includes:
Volatility normalization to account for differences in scale and distribution.
Regression analysis to model the relationship between past and present standardized returns.
Deviation bands to highlight overbought/oversold zones around the predicted trendline.
Statistical summary tables to assess the reliability of the detected momentum.
Core Concepts and Calculations
The model uses the following:
Independent variable (x): The volatility-adjusted return over the chosen momentum period.
Dependent variable (y): The 1-bar lagged log return, also adjusted for volatility.
A simple linear regression is performed over a large lookback window (default: 1000 bars), which reveals the slope and intercept of the momentum line. These values are then used to construct:
A predicted momentum trendline across time.
Upper and lower deviation bands , representing ±n standard deviations of the regression residuals (errors).
These visual elements help traders judge how far current returns deviate from the modeled momentum trend, similar to Bollinger Bands but derived from a regression model rather than a moving average.
Key Metrics Provided
On each update, the indicator dynamically displays:
Momentum Slope (β₁): Indicates trend direction and strength. A higher absolute value implies a stronger effect.
Intercept (β₀): The predicted return when x = 0.
Pearson’s R: Correlation coefficient between x and y.
R² (Coefficient of Determination): Indicates how well the regression line explains the variance in y.
Standard Error of Residuals: Measures dispersion around the trendline.
t-Statistic of β₁: Used to evaluate statistical significance of the momentum slope.
These statistics are presented in a top-right summary table for immediate interpretation. A bottom-right signal table also summarizes key takeaways with visual indicators.
Features and Inputs
✅ Volatility-Adjusted Momentum : Reduces distortions from noisy price spikes.
✅ Custom Lookback Control : Set the number of bars to analyze regression.
✅ Extendable Trendlines : For continuous visualization into the future.
✅ Deviation Bands : Optional ±σ multipliers to detect abnormal price action.
✅ Contextual Tables : Help determine strength, direction, and significance of momentum.
✅ Separate Pane Design : Cleanly isolates statistical momentum from price chart.
How It Helps Traders
📉 Quantitative Strategy Validation:
Use the regression results to confirm whether a momentum-based strategy is worth pursuing on a specific asset or timeframe.
🔍 Regime Detection:
Track when momentum breaks down or reverses. Slope changes, drops in R², or weak t-stats can signal regime shifts.
📊 Trade Filtering:
Avoid false positives by entering trades only when momentum is both statistically significant and directionally favorable.
📈 Backtest Preparation:
Before running costly simulations, use this tool to pre-screen assets for exploitable return structures.
When to Use It
Before building or deploying a momentum strategy : Test if momentum exists and is statistically reliable.
During market transitions : Detect early signs of fading strength or reversal.
As part of an edge-stacking framework : Combine with other filters such as volatility compression, volume surges, or macro filters.
Conclusion
The Momentum Regression indicator offers a powerful fusion of statistical analysis and visual interpretation. By combining volatility-adjusted returns with real-time linear regression modeling, it helps quantify and qualify one of the most studied and traded anomalies in finance: momentum.

NFP RangesThis simple indicator will mark the high and low prices during NFP days. You an choose how many NFP days you want to go back and a gradient to use for the levels.
The NFP dates are hard coded from 2023 through 2029. If this script survives past 2029, it should be simple to add more dates.

🧪 Yuri Garcia Smart Money Strategy FULL (Slope Divergence))📣 Yuri Garcia – Smart Money Strategy FULL
This is my private Smart Money Concept strategy, designed for my family and community to learn, trade, and grow sustainably.
🔑 How it works:
✅ Volume Cluster Zones: Automatically detects areas where strong buyers or sellers concentrate, acting as dynamic S/R levels.
✅ HTF Institutional Zones (4H): Higher timeframe trend filter ensures you’re always trading in the direction of major flows.
✅ Wick Pullback Filter: Confirms price rejects the zone, catching smart money traps and reversals.
✅ Cumulative Delta (CVD): Confirms whether buyers or sellers are truly in control.
✅ Slope-Based Divergence: Optional hidden divergence between price & CVD to spot reversals others miss.
✅ ATR Dynamic SL/TP: Adapts stop loss and take profit to live volatility with adjustable risk/reward.
🧩 Visual Markers Explained:
🟦 Blue X: Price inside HTF zone
🟨 Yellow X: Price inside Volume Cluster zone
🟧 Orange Circle: Wick pullback detected
🟥 Red Square: CVD confirms order flow strength
🔼 Aqua Triangle Up: Bullish slope divergence
🔽 Purple Triangle Down: Bearish slope divergence
🟢 Green Triangle Up: Final Long Entry confirmed
🔴 Red Triangle Down: Final Short Entry confirmed
⚡ Who is this for?
This strategy is best suited for traders who understand smart money concepts, order flow, and want an adaptive framework to trade major assets like BTC, Gold, SP500, NASDAQ, or FX pairs.
🔒 Important
Use responsibly, backtest extensively, and combine with solid risk management. This is for educational purposes only.
✨ Credits
Built with ❤️ by Yuri Garcia – dedicated to my family & community.
✅ How to use it
1️⃣ Add to chart
2️⃣ Adjust inputs for your asset & timeframe
3️⃣ Enable/disable slope divergence filter to match your style
4️⃣ Set your alerts with built-in conditions

Order Blocks Pro (SMC + TP/SL + Panel)An advanced Smart Money Concepts (SMC) script for TradingView that identifies Order Blocks, liquidity zones, structure breaks (CHOCH/BOS), and Fair Value Gaps (FVG). It features automatic entries (aggressive and confirmed), dynamic Take Profit (TP) and Stop Loss (SL) levels, and a visual panel showing key market conditions. Designed for traders seeking institutional-level precision and optimized entries based on structure, HTF wicks, and price behavior.

Navy Seal Trading - EdgarTrader📌 Navy Seal Trading – Asia, London, and NY Sessions
This indicator clearly displays the ranges of the Asia, London, and New York sessions, featuring:
✅ Full range visualization for each session
✅ Asia session high, low, and midline, with extended projection lines for precise reaction analysis
✅ Clean, minimalistic, and professional colors to keep your chart focused
🔷 Designed for the Navy Seal Trading community, focused on precision, discipline, and professional execution in the markets.
Use it to:
✔️ Mark liquidity zones
✔️ Identify Asia manipulation ranges
✔️ Prepare executions in London and NY with clear context
💡 Remember: Clarity in your zones gives you the confidence and discipline to execute like a true Navy Seal Trader.

Xcalibur Signals & Alerts [AlgoXcalibur]An advanced trend-following algorithm forged to empower retail traders with an edge.
Xcalibur Signals & Alerts is a sophisticated, multi-layered algorithm designed to consistently deliver real-time trend signals—without clutter or unnecessary complexity. The system combines refined trend-following logic with breakout detection, flat-market filtration, false signal failsafes, take profit cues, live alerts, and more — all in a visually simple, easy-to-use indicator built for all assets, timeframes, and market conditions.
🧠 Algorithm Logic
Xcalibur Signals & Alerts operates on a systematic framework that evaluates multiple technical dimensions in harmony—directional alignment, momentum confirmation, relative strength, volume bias, breakout detection, Fibonacci calculations, and more. Rather than reacting to isolated triggers, it filters every opportunity through a multi-layered confirmation engine. It doesn’t just react to every move—it evaluates them. This cohesive approach ensures that each signal results from aligned conditions—not arbitrary thresholds. By combining structural awareness with adaptive filtering, Xcalibur maintains clarity and consistency across a wide range of market environments—delivering actionable signals without unnecessary noise or lag.
⚙️ User-Adjustable Features
• Adjustable Sensitivity:
Choose from 5 pre-tuned Signal Trigger Settings and 3 dynamic Confirmation Filter Modes to tailor the system to your trading style, asset, and timeframe. Candle color reflects the active trigger condition, while an adaptive cyan line displays the selected Confirmation Filter—blocking signals until the filter threshold is crossed.
• Directional Stability Filter: When enabled, this filter uses mean-reversion calculations to determine directional bias and block unreliable signals during choppy, indecisive price action. A magenta line represents this filter threshold and provides higher-confidence signals during periods of low directional conviction.
• Pullback Allowance Filter:
When enabled, this unique filter uses Fibonacci ratios to deliberately block signals from temporary pullbacks during strong trend periods. A green (uptrend) or red (downtrend) line marks the active pullback allowance zone.
• False Signal Failsafe
:
Two selectable modes:
Simple — Cancels the signal if price breaks the signal candle’s high or low.
Advanced — Requires both a price break and opposing momentum confirmation.
When triggered, the system plots a white “X” signal, turns candles gray, disables the background color, sends an alert (if enabled), and enters standby mode until a valid trend condition re-emerges.
• Reaction Zones:
Identifies probable reversal or breakout zones based on recent price action patterns. A yellow line appears when active, with a yellow caution flag plotted if the price reaches this critical area.
• Take-Profit Cues
: Automatically detects potential trend exhaustion using price action structure and momentum shifts. When triggered, a visual “TP” marker is plotted—advising traders to manage profits or prepare for a possible reversal.
• Trailing Stop:
Plots a dynamic, percentage-based trailing stop or trailing take-profit using your selected input. Adjust it to suit your risk tolerance and asset.
• Multi-Timeframe Monitor
: Displays real-time trend direction across 1m, 2m, 5m, 15m, 1H, 4H, and 1D timeframes in a compact, easy-to-read table.
• Alert System
:
Receive desktop and/or mobile alerts for:
* New trend signals
* Failsafe triggers
* 9:00 AM Morning Greeting messages with auto re-arming confirmation
(Alerts are limited to 9:00 AM – 4:00 PM Eastern Time)
• SuperCandles
: Highlights strong momentum moves with a stunning and easily recognizable glow effect.
• Color-Coded Candles & Background
: Candles reflect the current trigger condition, while the background tint tracks the most recent trend—enhancing situational awareness.
*All input settings include tooltips to guide users through setup and interpretation.
⚔️ Not Just Another Signal Tool
Xcalibur Signals & Alerts was built from the ground up to empower retail traders with access to a cohesive, structured algorithmic system—one that reflects the kind of awareness, discipline, and market adaptability found in professional-grade algorithms.
This is not another oversensitive or under-responsive signal indicator that is limited to one specific type of market condition or trader. It does not utilize hyperactive triggers, rely on lagging crossover logic, or need infinitely adjustable and complex sensitivity settings. Instead of cluttered visuals to interpret, this indicator delivers a simple, easy-to-use tool—prioritizing clarity and usability without compromising on depth and sophistication.
Whether the market is trending, breaking out, or moving sideways, Xcalibur adapts—prioritizing trend stability, directional integrity, and visual clarity from one signal to the next.
⚠️ While the Xcalibur Signals & Alerts algorithm is immune to human emotion, you are not. Be mindful not to fall victim to costly emotions that can manipulate your judgment, and understand the unpredictable and complex nature of trading. No algorithm, strategy, or technique can deliver perfect accuracy, and Xcalibur Signals & Alerts is no exception. While AlgoXcalibur strives to be as accurate as possible, incorrect signals can and will occur. Xcalibur Signals & Alerts is a tool, not a guarantee. Users are fully responsible for making their own trading decisions, implementing proper risk management, and always trading responsibly.
🛡️ Wield Xcalibur as a standalone weapon or use it alongside other tools.
🔐 To get access or learn more, visit the Author’s Instructions section.
