[BUBBLENUKE] BOB The Reversal Trader=============================================================: BOB The Reversal Trader :=============================================================
COMPONENTS:
- VWAP Anchored at Friday CME close
- Bitcoin CME close
- Volume bars
SETTINGS:
- Asset: BTCUSDTPERP
- Time frame: 30M
- Hard TP %: 1.5
- Hard SL %: 40
- Trading Session Start (UTC): 4
- Trading Session End (UTC): 17
DESCRIPTION:
BOB is a mean-reversion trading system focused in BTCUSDT asset in the 30M time frame. The system is divided into 2 types of entries:
WEEKENDS:
BOB will trigger his entry when the price of Bitcoin is at one of the two deviations from the VWAP anchored at Friday CME close and BOB will take your profits when the price returns to the VWAP. When BOB hits Sunday and the CME reopens, BOB will close all your open positions.
INTRA-WEEK:
BOB will trigger its entry when the price of Bitcoin is at one of the two deviations from the VWAP anchored at the Friday CME close or when a volume candle indicates a reversal. BOB will take your profits when the price returns to the VWAP or when the HARD TP % is reached (1.5% by default). When BOB hits Friday and the CME closes, BOB will close all your open positions.
Regressions

RAS.V2 Strength Index OscillatorHeavily modified version of my previous "Relative Aggregate Strength Oscillator" -Added high/low lines, alma curves,, lrc bands, changed candle calculations + other small things. Replaces the standard RSI indicator with something a bit more insightful.
Credits to @wolneyyy - 'Mean Deviation Detector - Throw Out All Other Indicators ' And @algomojo - 'Responsive Coppock Curve'
And the default Relative Strength Index
The candles are the average of the MFI ,CCI ,MOM and RSI candles, they seemed similar enough in style to me so I created candles out of each and the took the sum of all the candle's OHLC values and divided by 4 to get an average, same as v1 but with some tweaks. Previous Peaks and Potholes visible with the blue horizontal lines which adjust when a new boundary is established. Toggle alma waves or smalrc curves or both to your liking. This indicator is great for calling out peaks and troughs in realtime, although is best when combined with other trusted indicators to get a consensus.

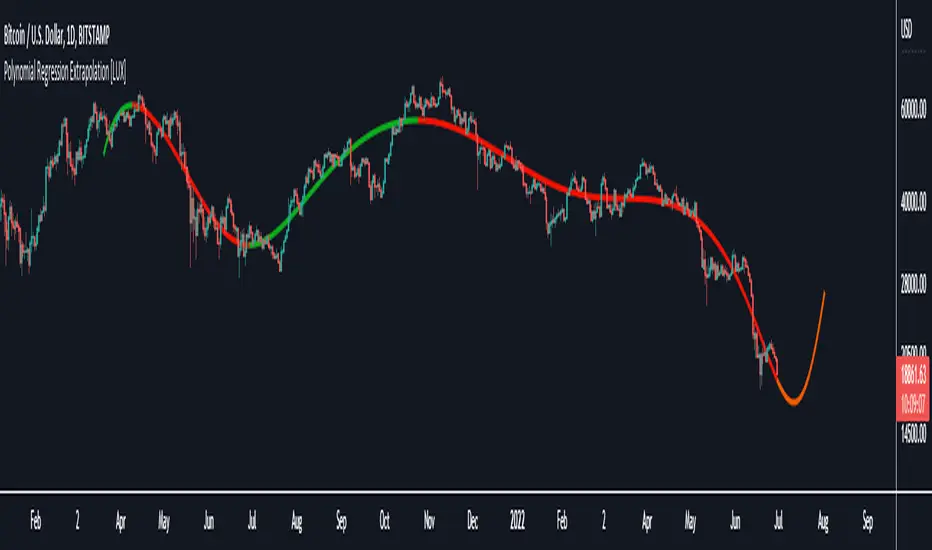
Polynomial Regression Extrapolation [LuxAlgo]This indicator fits a polynomial with a user set degree to the price using least squares and then extrapolates the result.
Settings
Length: Number of most recent price observations used to fit the model.
Extrapolate: Extrapolation horizon
Degree: Degree of the fitted polynomial
Src: Input source
Lock Fit: By default the fit and extrapolated result will readjust to any new price observation, enabling this setting allow the model to ignore new price observations, and extend the extrapolation to the most recent bar.
Usage
Polynomial regression is commonly used when a relationship between two variables can be described by a polynomial.
In technical analysis polynomial regression is commonly used to estimate underlying trends in the price as well as obtaining support/resistances. One common example being the linear regression which can be described as polynomial regression of degree 1.
Using polynomial regression for extrapolation can be considered when we assume that the underlying trend of a certain asset follows polynomial of a certain degree and that this assumption hold true for time t+1...,t+n . This is rarely the case but it can be of interest to certain users performing longer term analysis of assets such as Bitcoin.
The selection of the polynomial degree can be done considering the underlying trend of the observations we are trying to fit. In practice, it is rare to go over a degree of 3, as higher degree would tend to highlight more noisy variations.
Using a polynomial of degree 1 will return a line, and as such can be considered when the underlying trend is linear, but one could improve the fit by using an higher degree.
The chart above fits a polynomial of degree 2, this can be used to model more parabolic observations. We can see in the chart above that this improves the fit.
In the chart above a polynomial of degree 6 is used, we can see how more variations are highlighted. The extrapolation of higher degree polynomials can eventually highlight future turning points due to the nature of the polynomial, however there are no guarantee that these will reflect exact future reversals.
Details
A polynomial regression model y(t) of degree p is described by:
y(t) = β(0) + β(1)x(t) + β(2)x(t)^2 + ... + β(p)x(t)^p
The vector coefficients β are obtained such that the sum of squared error between the observations and y(t) is minimized. This can be achieved through specific iterative algorithms or directly by solving the system of equations:
β(0) + β(1)x(0) + β(2)x(0)^2 + ... + β(p)x(0)^p = y(0)
β(0) + β(1)x(1) + β(2)x(1)^2 + ... + β(p)x(1)^p = y(1)
...
β(0) + β(1)x(t-1) + β(2)x(t-1)^2 + ... + β(p)x(t-1)^p = y(t-1)
Note that solving this system of equations for higher degrees p with high x values can drastically affect the accuracy of the results. One method to circumvent this can be to subtract x by its mean.
ATR ChartATR Levels
Calculated by adding ATR to daily low and subtracting ATR from daily high.
Inputs can change ATR timeframe and range, defaults to 6 hr and daily.
Colorful RegressionColorful Regression is a trend indicator. The most important difference of it from other moving averages and regressions is that it can change color according to the momentum it has. so that users can have an idea about the direction, orientation and speed of the graph at the same time. This indicator contains 5 different colors. Black means extreme downtrend, red means downtrend, yellow means sideways trend, green means uptrend, and white means extremely uptrend. I recommend using it on the one hour chart. You can also use it in different time periods by changing the sensitivity settings.

Easy TrendCurrent script displays trend channel, which makes it easy to see reversal signals
Note:
- If price goes above the channel it might be an early sell signal
- If price falls from channel it might be a sell signal, better to enter position on retest
Plan for future development:
- Alerts
- Trend angle

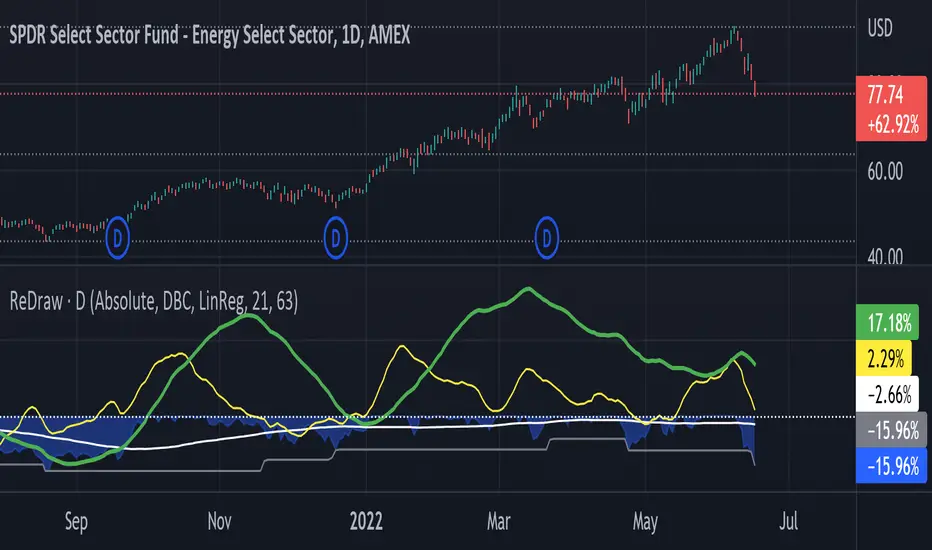
Return & Drawdown
ReDraw script calculates the historical returns and drawdown for the given periods.
By default, the return of the linear regression trends is displayed (can be turned off in settings). In this mode, two linear regression trends are being computed for both long and short periods, and the percent value indicates the "return of the trend" for the corresponding period. Observing the dynamic of the linear regression trends can give a great hint if the trend is slowing down.
When the smoothing method is set to "none" or WMA3/5, the real asset return is shown for both periods, using the formula (LastPrice-FirstPrice)/FirstPrice
The script calculates the maximum drawdown for the long period using the formula (max(Price) - LastPrice) / max(Price).
The white line under the zero is the average maximum drawdown over the long period.
When the mode is set to Compare, ReDraw will display the difference in metrics between the current and selected symbol (SPY by default).
Super trend BThis indicator is a mix of 3 well known indicators
the buy point is based on linear regression
the sell points are based on mix of super trend and Bollinger
it try to find best point to sell and buy which are independent from each other
for each time frame you need to try to search for best setting
alerts included

Enio_LR_SlopeEnio_LR_Slope is the slope curve of a Linear Regression Line. As such, it describes whether the LRL is decreasing or vice versa.
Its crossing above the Zero line is considered a Buy signal, and vice versa. This signal can also be used to confirm signals from other indicators.
The default setting is:
Slope curve, 30 periods
Cut-Off signal, 7-periods (This is a simple moving average of the Slope curve).
Cut-Off signals can be used for early buy/sell positioning.

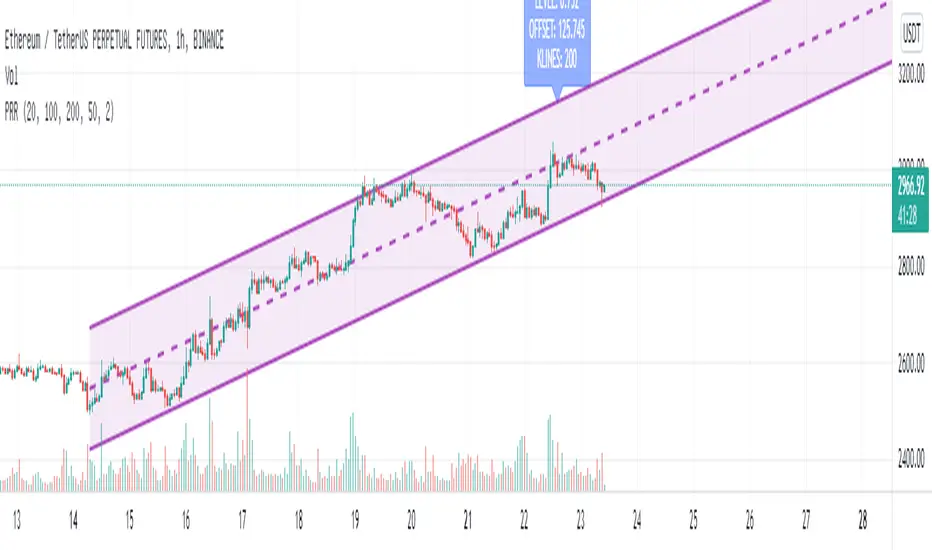
Regression Channel with projectionEXPERIMENTAL:
Auto adjusting regressive channel with projection.
Linear regression is a linear approach to modeling the relationship between a dependent variable and one or more independent variables.
In linear regression , the relationships are modeled using linear predictor functions whose unknown model parameters are estimated from the data.
Disclaimer :
Success in trading is all about following your trading strategy and indicators should fit into your own strategy, and not be traded purely on.
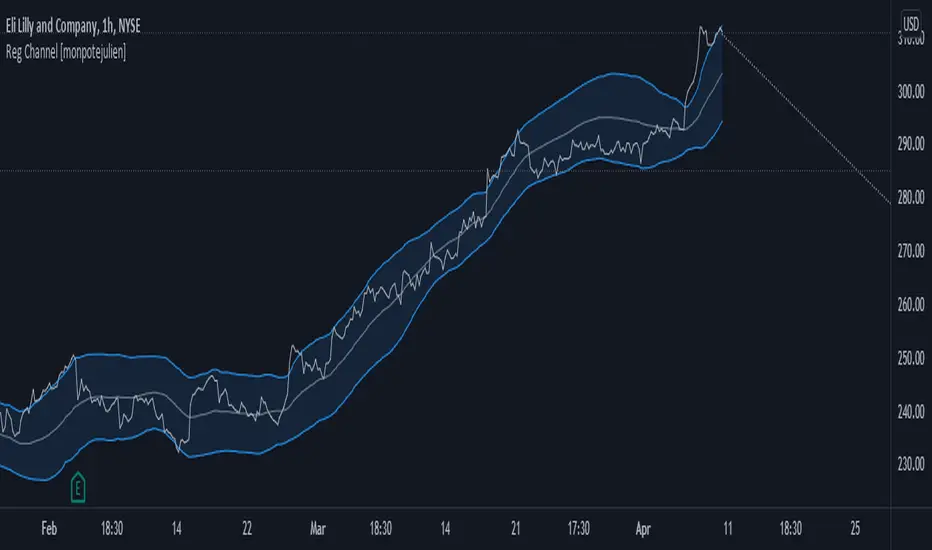
This script is for informational and educational purposes only. Use of the script does not constitute professional and / or financial advice. You are solely responsible for evaluating the outcome of the script and the risks associated with using the script. In exchange for the use of the script, you agree not to hold monpotejulien TradingView user responsible for any possible claims for damages arising out of any decisions you make based on the use of the script.
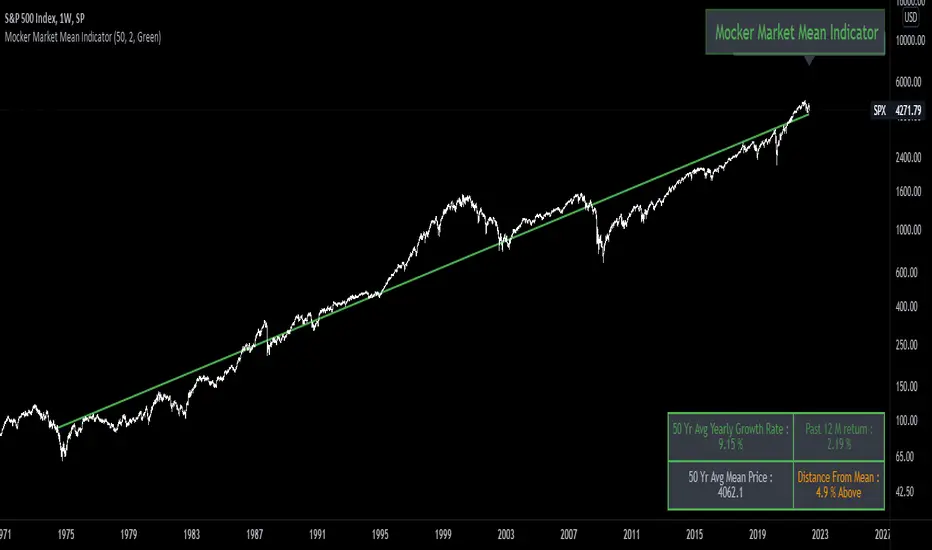
Mocker Market Mean IndicatorThe objective of this indicator is to find the historical mean price of a market ( Intended for Indexes or ETF's). Based off of the concept that Benjamin Graham taught, that Mr. Market is a manic depressive forever oscillating between unjustified pessimism to extreme optimism. The intent of this indicator is to supplement a regular allocation strategy to an index or ETF , to increase that allocation when it's trading below its historical mean and decrease when trading above. It does this by using an exponential regression model to find the closest approximation of the current mean price based on past growth rate, and user defined lookback period.
Relative slopeRelative slope metric
Description:
I was in need to create a simple, naive and elegant metric that was able to tell how strong is the trend in a given rolling window. While abstaining from using more complicated and arguably more precise approaches, I’ve decided to use Linearly Weighted Linear Regression slope for this goal. Outright values are useful, but the problem was that I wasn’t able to use it in comparative analysis, i.e between different assets & different resolutions & different window sizes, because obviously the outputs are scale-variant.
Here is the asset-agnostic, resolution-agnostic and window size agnostic version of the metric.
I made it asset agnostic & resolution agnostic by including spread information to the formula. In our case it's weighted stdev over differenced data (otherwise we contaminate the spread with the trend info). And I made it window size agnostic by adding a non-linear relation of length to the output, so finally it will be aprox in (-1, 1) interval, by taking square root of length, nothing fancy. All these / 2 and * 2 in unexpected places all around the formula help us to return the data to it’s natural scale while keeping the transformations in place.
Peace TV
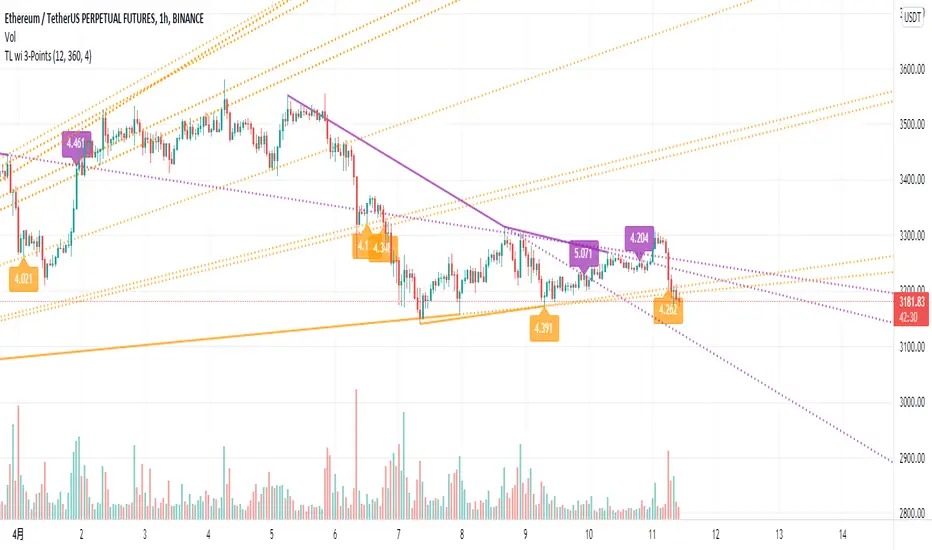
Trend Line wi 3-PointsHello, my friends. This is a new version of the trend line regression indicator, which always finds quantitive trend lines with three key points.
(1) Indicator description
This indicator finds a trend line with three key points on the historical K-line
Solving the problem of calculation timeout based on a faster trend line regression algorithm
Supports filtering unwanted trend lines by setting a trendline strength threshold
It's suitable for most markets and timeframes
(2) Key parameters
- Pivot High/Low Settings
Pivot Lookback Left: Number of K-lines to look back left from the pivot top/bottom
Pivot Lookback Right: Number of K-lines to look back right from the pivot top/bottom
- Trend Line Regression
Max of Lookback Forward: The maximum number of historical K-lines
Min Regression Strength: The minimum strength threshold for trend line regression
Multiply Regression Std: The width of the trend line to display on the chart
(3) Script description
Due to some circumstances that I don't want to see, subsequent scripts will not be open source, but you can still use the script for free. Thanks for your understanding and support!
If you have any suggestions or comments about the script, please feel free to leave your comments!
Happy trading, and enjoy your life!
————————————————————————————————————————
各位朋友大家好,这是一个全新的趋势线回归指标。该指标总是会找到在图表中具有3个关键点的合理趋势线
(1) 指标说明
该指标在历史K线上找到具有3个关键点的趋势线,并绘制于图表上
基于更快速的趋势线回归算法,解决了计算超时的问题
支持通过设置趋势线强度阈值过滤不需要的趋势线
该指标适用于大部分市场和时间周期
(2) 关键参数
- Pivot High/Low Settings
Pivot Lookback Left: 枢纽顶/底点往左回顾的 K线 数量
Pivot Lookback Right: 枢纽顶/底点往右回顾的 K线 数量
- Trend Line Regression
Max of Lookback Forward: 回顾历史 K线 的最大数量
Min Regression Strength: 趋势线回归的最小强度阈值
Multiply Regression Std: 趋势线的显示宽度
(3) 脚本说明
因为出现了一些我不希望看到的情况,后续的脚本将不再开源代码,但是您依然可以免费使用该脚本,感谢理解和支持!
如果您存在对于该脚本的使用建议或者意见,欢迎各位留言!
祝大家交易愉快
Compound strategyIn this strategy, I looked at how to manage the crypto I bought. Once we have a little understanding of how cryptocurrency is valued, we can manage the coins we have. For example, the most valuable coin in a coin is to sell when it is overvalued and re-buy when it is undervalued. Furthermore, I realised that buying from the right place and selling at the right time is very important to make a good profit. When it says sell, it's divided into several parts.
1. When the major uptrend is over and we are able to make the desired profit, we will sell our holdings outright.
2. Selling in the middle of a down trend and buying less than that amount again
3. When a small uptrend is over, sell the ones you bought at a lower price and make a small profit.
The other important thing is that the average cost is gradually reduced. Also, those who sell at a loss will reduce their profit (winning rate), so knowing that we will have a chance to calculate our loss and recover it. I used this to write a strategy in Trading View. I have put the link below it. From that we can see how this idea works. What I did was I made the signal by taking some technical indicators as I did in the previous one (all the indicators I got in this case were directional indicators, then I was able to get a good correlation and a standard deviation. I multiplied the correlation and the standard deviation by both and I took the signal as the time when the graph went through zero, and I connected it to the volume so that I could see some of the volume supported by it.)
Now let me tell you a little bit about what I see in this strategy. In this I used the compound effect. That is, the strategy, the profit he takes to reinvest. On the other hand, the strategy itself can put a separate stop loss value on each trade and avoid any major loss from that trade. I also added to this strategy the ability to do swing trading. That means we can take the small profits that come with going on a big up trend or a big down trend. Combined with Compound Effect, Stop Loss and Swing Trading, I was able to make a profit of 894% per annum (1,117.62% for 15 months) with a winning rate of 80%. Winning rate dropped to 80% because I added stop loss and swing trading. The other thing is that I applied DCA to this in both the up trend and the down trend (both). That was another reason for me to make a good profit. The orange line shows how to reduction of costly trade. The yellow line shows the profit and you can see that the profit line does not go down during the loss trades. That's because I want to absorb the loss from that trade.
Smart Reg channel [monpotejulien]This indicator calculates an adaptative regression channel over a specified period or interval.
Resources:
rosettacode.org
en.wikipedia.org

Strategy LinReg ST@RLStrategy LinReg ST@RL
Strategy LinReg ST@RL is a visual trend following indicator.
It is compiled in PINE Script Version V5 language.
This indicator/strategy, based on Linear Regression Calculation, is intended to help beginners (and also the more experienced ones) to trade in the right direction of the market trend and test strategy. It allows you to avoid the mistakes of always trading against the trend.
Strategy based on an original idea of @KivancOzbilgic (SuperTrend) and DevLucem (@LucemAnb) (Lin Reg ++)
A special credit goes to - KivancOzbilgic and @LucemAnb which inspired me a lot to improve this indicator/Strategy.
This indicator can be configured to your liking,according to your needs or your tastes.
The indicator/Strategy works in multi time frame.
The settings (length, offset, deviation, smoothing) are identical for all time frames if “Conf Auto” is not checked.
In this case the default settings (time frame=H1 settings) apply for all time frames.
The choice of source setting is common for all time frames.
If “Auto Conf” is checked,
then the settings will be optimized for each selected time frame (1m-3m H2 H3 H1 H4 & Daily). Time frames, other than 1m-3m H2 H3 H1 H4 & Daily will be affected with the default settings corresponding to the H1 time frame and will therefore not be optimized! The default setting values of each time frame (1m-3m H2 H3 H1 H4 & Daily) can be configured differently and optimized by you.
REVERSAL mode: Signal Buy=Sell and Signal Sell=Buy.
This option may be better than the regular strategy. Default mode is Reversal option.
Note that only for 1m (1 minute) Time frame, the option REVERSAL is opposite as default choice in configuration. (If reversal option is checked, then option for time frame 1m is not reversal!)
Trend indications (potential sell or buy areas) are displayed as a background color (bullish: green or bearish: red), assume that the market is moving in one direction.
You can tune the input, style and visibility settings to match your own preferences or habits.
Label Info (Simple or Full) gives trend info for each Exit (or current trade)
The choice of indicator colors is suitable for a graph with a "dark" theme, which you will probably need to modify for visual comfort, if you are using a "Light" mode or a custom mode.
This script is an indicator that you can run on standard chart types. It also works on non-standard chart types but the results will be skewed and different.
Non-standard charts are:
• Heikin Ashi (HA)
• Renko
• Kagi
• Point & Figure
• Range
As a reminder: No indicator is capable of providing accurate signals 100% of the time. Every now and then, even the best will fail, leaving you with a losing deal. Whichever indicator you base yourself on, remember to follow the basic rules of risk management and capital allocation.
BINANCE:BTCUSDT
! Français !
Strategy LinReg ST@RL
Stratégie LinReg ST@RL est un indicateur visuel de suivi de tendance.
Il est compilé en langage PINE Script Version V5.
Stratégie basée sur une idée originale de @KivancOzbilgic (SuperTrend) et DevLucem (@LucemAnb) (Lin Reg ++) Un crédit spécial va à - KivancOzbilgic et @LucemAnb qui m'ont beaucoup inspiré pour améliorer cet indicateur/stratégie.
Cet indicateur/strategie, basé sur le calcul de régression linéaire, est destiné à aider les débutants (et aussi les plus expérimentés) à trader dans le bon sens de la tendance du marché et à tester la stratégie. Cela vous permet d'éviter les erreurs de toujours négocier à contre-courant.
Cet indicateur peut être configuré à votre guise, selon vos besoins ou vos goûts.
L'indicateur/Stratégie fonctionne sur plusieurs bases de temps.
Les réglages (longueur, décalage, déviation, lissage) sont identiques pour toutes les bases de temps si
« Conf Auto » n'est pas coché. Dans ce cas, les paramètres par défaut (intervalle de temps=paramètres H1) s'appliquent à toutes les bases de temps.
Le choix du réglage de la source est commun à toutes les bases de temps.
Si "Auto Conf" est coché, alors les paramètres seront optimisés pour chaque base de temps sélectionnée (1m-3m H2 H3 H1 H4 & Daily). Les bases de temps, autres que 1m-3m H2 H3 H1 H4 & Daily seront affectées par les paramètres par défaut correspondant à la base de temps H1 et ne seront donc pas optimisées ! Les valeurs de réglage par défaut de chaque période (1m-3m H2 H3 H1 H4 & Daily) peuvent être configurées différemment et optimisées par vous.
Mode REVERSAL : Signal Achat=Vente et Signal Vente=Achat. Cette option peut être meilleure que la stratégie habituelle. Le mode par défaut est l'option REVERSAL.
Notez que seulement pour la base de temps de 1m (1 minute), l'option REVERSAL est l’opposée du choix par défaut dans la configuration. (Si l'option REVERSAL est cochée, alors l'option pour la base de temps 1 m n'est pas REVERSAL !)
Les indications de tendance (zones potentielles de vente ou d'achat) sont affichées en couleur de fond (haussier : vert ou baissier : rouge), supposons que le marché évolue dans une direction. Vous pouvez ajuster les paramètres d'entrée, de style et de visibilité en fonction de vos propres préférences ou habitudes.
Les informations sur l'étiquette (simples ou complètes) donnent des informations sur de chaque clôture (ou position en cours)
Le choix des couleurs des indicateurs est adapté à un graphique avec un thème "sombre", qu'il vous faudra probablement modifier pour le confort visuel, si vous utilisez un mode "Clair" ou un mode personnalisé.
Ce script est un indicateur que vous pouvez exécuter sur des types de graphiques standard. Cela fonctionne également sur les types de graphiques non standard, mais les résultats seront faussés et différents.
Les graphiques non standard sont :
• Heikin Ashi (HA)
• Renko
• Kagi
• Point & Figure
• Range
Pour rappel : Aucun indicateur n'est capable de fournir des signaux précis 100% du temps. De temps en temps, même les meilleurs échoueront, vous laissant avec une affaire perdante. Quel que soit l'indicateur sur lequel vous vous basez, rappelez-vous de suivre les règles de base de la gestion des risques et de l'allocation du capital.

Trend Line RegressionThis is a fast trend line regressor based on least squares regression.
(1) Supports setting regression from the Nth candle
(2) Supports the minimum and maximum regression candle interval length
(3) Supports finding the optimal regression region based on the length step among the minimum and maximum regression region lengths
(4) Supports displaying the optimal regression level
(5) The size of the regression region is 0.5 times the standard deviation by default
(6) You can filter the trend line by setting minimum trend line regression level
(6) Please properly set the parameters to avoid calculation timeout
Enjoy!
这是一个基于最小二乘法回归的快速趋势线回归
(1) 支持从第N根蜡烛开始设置回归
(2) 支持最小和最大的回归蜡烛区间长度
(3) 支持在最小和最大回归区间长度的基础上寻找最佳回归区域
(4) 支持显示最佳回归水平
(5) 回归区域的大小默认为标准差的0.5倍
(6) 可以通过设置最小趋势线回归等级来过滤趋势线
(6) 请正确设置参数以避免计算超时
使用愉快!

Price Region RegressionThis is an optimized price range regressor based on least squares regression.
(1) Supports setting regression from the Nth candle
(2) Supports the minimum and maximum regression candle interval length
(3) Supports finding the optimal regression region based on the length step among the minimum and maximum regression region lengths
(4) Supports displaying the optimal regression level
(5) The size of the regression region is two times the standard deviation by default
这是一个基于最小二乘回归的价格区间回归指标
(1) 支持设置从第N个蜡烛开始回归
(2) 支持最小和最大回归蜡烛的区间长度
(3) 在最小和最大回归区间长度中,根据长度步进寻找最优的回归区间
(4) 支持显示最优回归等级
(5) 回归区间的大小默认为2倍标准差
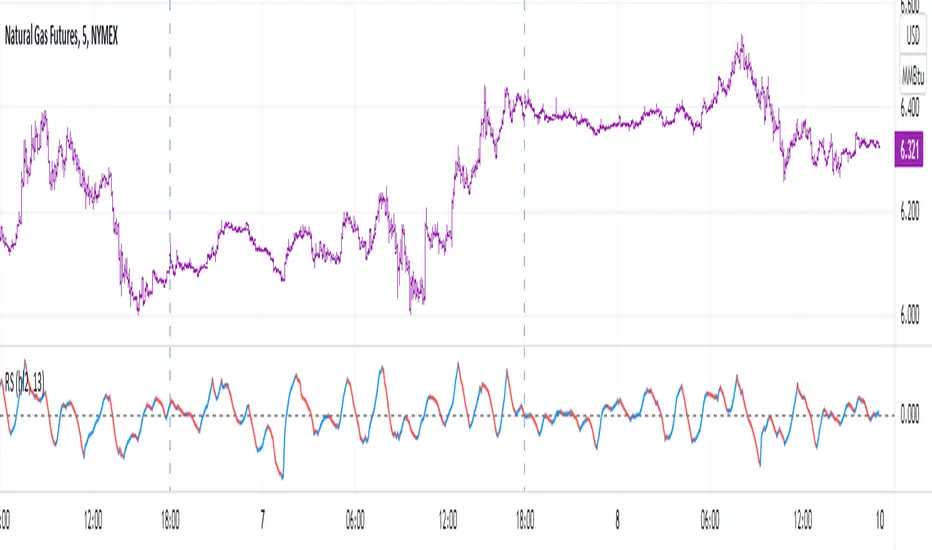
StrengthA mathematically elegant, native & modern way how to measure velocity/ strength/ momentum. As you can see it looks like MACD, but !suddenly! has N times shorter code (disregard the functions), and only 1 parameter instead of 3. OMG HOW DID HE DO IT?!?
MACD: "Let's take one filter (1 parameter), than another filter (2 parameters), then let's take dem difference, then let's place another filter over the difference (3rd parameter + introduction of a nested calculation), and let's write a whole book about it, make thousands of multi-hours YouTube videos about it, and let's never mention about the amount of uncertainty being introduced by multiple parameters & introduction of the nested calculation."
Strength: "let's get real, let's drop a weighted linear regression & usual linear regression over the data of the same length, take dem slopes, then make the difference over these slopes, all good. And then share it with people w/o putting an ® sign".
Fyi, regressions were introduced centuries ago, maybe decades idk, the point is long time ago, and computational power enough to calculate what I'm saying is slightly more than required for macd.
Rationale.
Linearly weighted linear regression has steeper slope (W) than the usual linear regression slope (S) due to the fact that the recent datapoints got more weight. This alone is enough of a metric to measure velocity. But still I've recalled macd and decided to make smth like it cuz I knew it'll might make you happy. I realized that S can be used instead of smoothing the W, thus eliminating the nested calculation and keeping entropy & info loss in place. And see, what we get is natural, simple, makes sense and brings flex. I also wanna remind you that by applying regression we maximize the info gain by using all the data in the window, instead of taking difference between the first and the last datapoints.
This script is dedicated to my friend Fabien. Man, you were the light in the darkness in that company. You'll get your alien green Lambo if you'll really want it, no doubts on my side bout that.
Good hunting

End Point Moving Average [EPMA]The End Point Moving Average was introduced in the October 95 issue of Technical Analysis of Stocks &
Commodities in the article "The End Point Moving Average", by Patrick E. Lafferty.
The Time Series Forecast takes this value and the slope of the regression line to forecast the next day and then plots this forecasted price as today's value.
For interpretation refer to Mr. Lafferty's article.
Please note
From line 10 starts my personal experemental modifications to this script, all above is original formula by Patrick E. Lafferty.

Bitcoin Best Value CorridorHere is my interpretation of the "Best Time To Buy" Bitcoin over its lifetime using a logarithmic regression trendline. The upper and lower lines are 10% deviations from the centre line. I calculated the trendline in excel and then coded my results into pine script.

Top 40 High Low Strategy for SPY, 5minThis strategy is developed based on my High Low Index SPY Top 40 indicator
Notes:
- this strategy is only developed for SPY on the 5 min chart . It seems to work with QQQ as well, but it isn't optimized for it
- P/L shown is based on 10 SPY option contracts, call or put, with strike price closest to the entry SPY price and expiry of 0 to 1 day. This includes commissions (can be changed). This is only an estimate calculated using an arbitrary multiplier factor, this can be changed in the setting
- P/L is based on $5000 initial capital
- Works with both regular / extended trading session turned on/off. However, max drawdown is 1/2 with extended trading session ON
- there is still a bug that doesn't allow alert to be created due to calculation error, will update once fixed
This strategy combines signals from the following indicators to determine entry signals:
- High Low Index SPY Top 40
- MACD
- Linear Regression Slope
Entry signal is triggered when:
- High Low Index line crosses the EMA line
- MACD trending in the same direction
- Linear Regression slope is accelerating above a threshold in the same direction, indicating a strong trend
Profit target(PT) and stop loss(SL) are determined using ATR value, with 2:1 Reward to Risk ratio as default.
Exit signal may be triggered prior to PT or SL trigger when:
- High Low Index SPY Top 40 shows a reversal after overbought or oversold conditions (optional)
- Opposite entry signal is triggered
There are a number of optional settings:
- Turn on/off "option trading", P/L will be calculated using share price only without multiplication factor for trading option contracts
- # of options per trade, default to 10
- Reinvest with profit made
- Trade with trailing SL after PT hit
- Take profit early based on Top 40 overbought/oversold
- Trade 0/1 day expiry. This will signal exit by the end of the day on Mon/Wed/Fri, and only exits 1/2 of positions (if in profit) on Tues/Thurs
- Can reduce the SL level without impacting PT
- No entry between 10:05 - 10:20 (don't ask me why, but statistically it performs better)
Consider donating me some of your profit if you make $$$ hahaha~ ;)
Enjoy~~

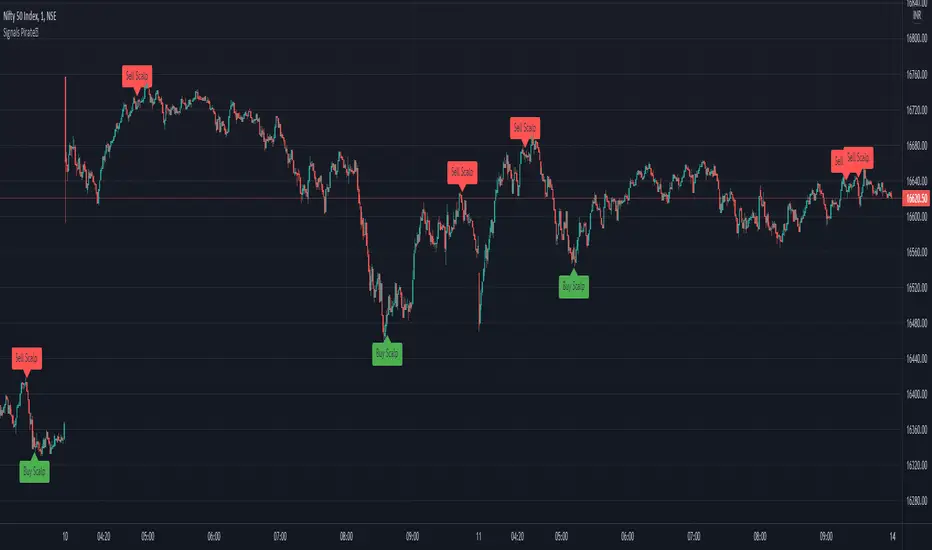
Signals Pirate™ ScalperSignalsPirate™ Scalper has been created specifically for asset scalping to help improve your short term trading by accurately identifying ‘Buy’ and ‘Sell’ opportunities!
The simplicity of this package ensures traders of all levels of expertise can utilise this tool and experience its benefits to the fullest. The only variable that alters the tools performance is the ‘Scalp Length’ option, which dictates how frequently scalping signals are identified. A value of 10 will result in more selective and less frequent signals, whereas a value of 1 will print ‘Buy’ and ‘Sell’ signals more often.
This tool has been formed using a number of trend reversal indicators, such as the RSI and Stochastics to identify overbought and oversold conditions. As well as these it incorporates crucial pivot points to identify potential support & resistance levels where scalp opportunities will have the highest chance of being successful. Combining these means when price is extremely oversold across a multitude of indicators while sitting at a pivot point support level, a ‘Buy Scalp’ label is created – and vice versa for ‘Sell Scalp’ signals.
The default settings are the best settings we’ve found so far but you can change them to build your own unique trading strategy. We’d recommend experimenting with these values to find the best results for the asset you are trading, and your own personal trading style.
Direction for use:
1. Use on any asset class and time frame, preferably on a lower timeframe (15min or less).
2. Fine tune the ‘Scalp Length’.
3. Enter a long position once a ‘Buy Scalp’ label is created, and close the position once a ‘Sell Scalp’ label is created. For short positions enter once a ‘Sell Scalp’ label is created and close once a ‘Buy Scalp’ label is created.
We hope you love this package, and it takes your trading and investing to the next level. Please let us know if you have any questions or queries regarding the logic behind the bundle, or if you have any suggestions for improvements etc. We love your feedback and are constantly striving to continuously improve!